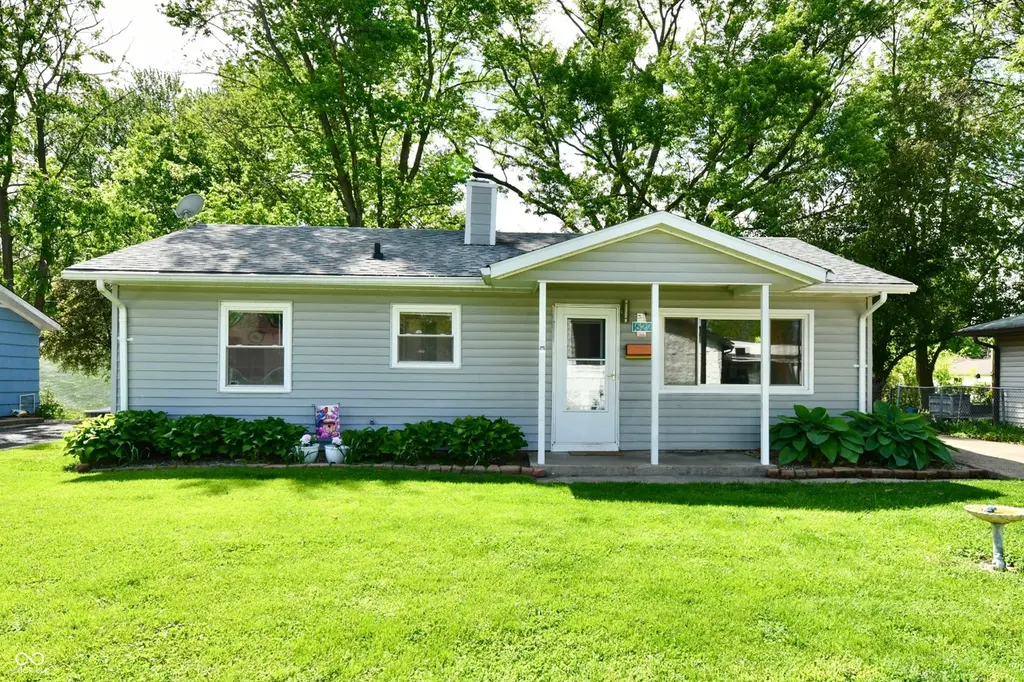
622 S Locust Ln · Brownsburg, IN
Flood risk 1/10 · Minimal
- FEMA flood zone
- X (unshaded)
- Chance of flooding over 30 yrs
- 0.0%
- Est. flood insurance / yr
- $507 – $1,088
Fire risk 1/10 · Minimal
- Est. fire insurance / yr
- $717 – $1,331
Heat risk 3/10 · Minor
- Hot days now (above 100°F)
- 7 days/yr
- Hot days in 30 yrs
- 19 days/yr
Wind risk 2/10 · Minimal
- Chance of severe wind over 30 yrs
- 0.0%
Air-quality risk 2/10 · Minimal
- Unhealthy air days now
- 1 days/yr
- Unhealthy air days in 30 yrs
- 2 days/yr
Risk factors via First Street. Map © Google.
Why this score? — see what drove the C grade
The composite is a weighted blend of 9 inputs, each scored 0–100. Each bar is that input's sub-score; the figure is the points it added to the 100-point composite (weight × sub-score).
- Cash flow +21.8/30.0
- ARV discount +9.5/15.0
- DSCR +7.0/10.0
- Schools +6.3/10.0
- 1% rule +5.0/10.0
- Rent growth +4.1/5.0
- Livability +3.8/5.0
- Condition / age +2.5/5.0
- Appreciation +0.0/10.0
$195,000
🖨 Deal sheet 📄 Offer letter ✓ Due diligence
Listing remarks MLS
953SF Move in ready, 3BR 1BA, new flooring, fenced in backyard w/patio area. With in walking distance of Williams Park. Great starter home or investment property for a rental. This won't last. See today!Preliminary Title work done through Abstract & Title.
Key facts
- Ample outdoor space
- Generous lot
- Mini barns
Tags
Property features AI
Finance
- Other: Lot size approximately 0.18 acres; GPS friendly directions
Exterior
- Parking: Concrete parking surface
- Utilities: Public water; Municipal sewer connected
- Home design: Single family residence; One level
- Construction: Vinyl siding; Slab foundation
- Exterior features: Covered porch; Patio/porch; Mini barn
Interior
- Kitchen: Gas cooktop; Electric oven; Dishwasher; Refrigerator; Pantry; Eat-in kitchen
- Bedrooms: Three bedrooms on the main level
- Flooring: Luxury vinyl plank in kitchen and living room
- Bathrooms: One full bathroom (main level)
- Heating & cooling: Forced air heating (natural gas); Central air conditioning
- Interior features: Attic access; Eat-in kitchen; Pantry
- Laundry & utility: Washer; Dryer; Electric water heater
Neighborhood map
What this means for you Summary
Snapshot
- This is a 3-bed/1.0-bath single-family listed at $195k.
Deal economics
- At list price, monthly cash flow is $303 ($4k/yr) — positive.
- The deal already cash-flows at list — no discount required.
- To meet the 1% rule (rent ≥ 1% of price), the offer needs to be $195k (0.2% below list).
- Recommended offer: $195k (0.2% below list) — sets the bar for 1% rule.
- Cap rate 8.2% vs local median 3.8% in Brownsburg — top-decile yield for the area; either an underpriced asset or a hidden risk that comps aren't pricing in. Stress-test before assuming the spread holds.
Location & tenants
- Location reads 75/100 on livability (#61 in IN, #4,105 nationally) — a middle-class / working-renter tenant base. Strengths: schools A+, crime A+, employment A+; Watch: amenities F, commute F, health & safety F.
- Brownsburg Community School Corporation (suburban): math 72% / reading 72% proficiency, ranked #2 of 301 in IN (top 1%) — strong family-tenant draw, lease renewals of 3-5y typical; only 17% free/reduced lunch — higher-income household profile.
- Market conditions: Rents rising fast (+6.3%/yr); 328 active listings in the ZIP; 3 comparable units currently listed for rent nearby; rentals leasing fast (median 2d on market — plan ~1-2 weeks tenant-placement turnaround); high-income renter base; 1,294 units permitted in Hendricks County in 2024 (18 in 5+ unit buildings).
Forward outlook
- Local home prices are declining (-3.0%/yr); year-one equity from $1k of loan paydown is wiped out by about $6k of value loss. Plan a longer hold.
- Hendricks County population projected at +35% by 2050 — long-run rental-demand tailwind backs the buy-and-hold thesis.
- At projected returns (-3.0% appreciation + 6.3% rent growth), your $55k cash investment doubles in ~10 years — after that, you're playing with house money.
Negotiation context
- Only 1 days on market — expect competitive offers; lowballing is unlikely to land.
- 8 sale attempts since 26y ago with the ask held roughly flat each time — persistent listings suggest the price (not the market) is what's stuck; bring a comps-based counter.
- Current owner paid $163k; 20% above their basis — modest negotiation headroom, anchor on the comps not their cost.
Risks & watch-outs
- Watch-outs: built in 1957 — expect roof / HVAC / electrical / plumbing capex.
Questions for the listing agent
- Built in 1957 — when were the roof, HVAC, electrical panel, plumbing, and water heater last replaced?
- Is there a deadline driving the sale (1031 exchange, divorce, estate, relocation)? That informs how much negotiation room exists.
- Schools are A-rated — typically a magnet for longer-tenancy family renters. What's the average tenant stay here, and is there a school-zone premium baked into asking?
- What's the average days-on-market for RENTAL listings here right now (not sales)? A rising rental-DOM trend means longer vacancies and softer asking-rent achievability than the comps imply.
- What's the recent tenant-quality profile in this submarket — average credit score on applications, eviction rate, late-payment / NSF rate, and stable-employment percentage? A property-management company in the area should have these aggregated.
- How much new for-sale + rental construction is in the pipeline within 1–3 miles? Heavy new supply typically softens prices + rents 12–24 months out; constrained supply supports both.
Investment metrics
- 1% rule
- 1.00% ✗
- Cap rate
- 8.16%
- Cash-on-cash
- 6.67%
- DSCR
- 1.30
- GRM
- 8.4
CMA / ARV
- ARV (on-the-fly)
- $203,942
- Comps found
- 12
Show comp detail 12 sales within ~0.75 mi
| Address | Dist | Beds/Ba | Sqft | Sold | Price | $/sf | Match |
|---|---|---|---|---|---|---|---|
| 622 S Locust Ln | 0.00mi | 3/1.0 | 953 (0%) | 1mo | $210,000 | $220 | 99 |
| 519 Maxine Mnr | 0.14mi | 3/1.0 | 953 (0%) | 18mo | $220,000 | $231 | 79 |
| 7 W William Dr | 0.24mi | 3/1.0 | 960 (+1%) | 16mo | $221,000 | $230 | 74 |
| 526 S Maxine Mnr | 0.15mi | 3/1.0 | 1,053 (+10%) | 9mo | $224,000 | $213 | 68 |
| 423 W Janet Dr | 0.18mi | 3/1.0 | 1,053 (+10%) | 10mo | $207,500 | $197 | 66 |
| 639 S Alpha Ave | 0.17mi | 3/1.0 | 1,062 (+11%) | 12mo | $227,000 | $214 | 63 |
| 117 Pamela Pkwy | 0.37mi | 3/1.0 | 1,012 (+6%) | 18mo | $230,000 | $227 | 58 |
| 311 W William Dr | 0.11mi | 3/1.5 | 1,074 (+13%) | 20mo | $240,000 | $223 | 56 |
| 414 S Green St | 0.34mi | 3/1.0 | 840 (-12%) | 11mo | $160,000 | $190 | 55 |
| 532 S Sunnybrook Dr | 0.37mi | 3/1.0 | 1,073 (+13%) | 16mo | $202,000 | $188 | 48 |
| 330 S Green St | 0.42mi | 2/1.0 (-1) | 840 (-12%) | 10mo | $145,000 | $173 | 47 |
| 4 Lincoln Dr | 0.60mi | 2/1.0 (-1) | 910 (-4%) | 16mo | $150,000 | $165 | 46 |
Match score weights: distance 35% · size 25% · config 20% · recency 20%. Top-matched comps best support the ARV.
Projected returns pro-forma
-3.0% appreciation · 6.31% rent growth · sell at horizon
- IRR
- -2.6%
- Equity multiple
- 0.90×
- Total profit
- $-5,624
- Equity at exit
- $29,075
- IRR
- 10.2%
- Equity multiple
- 1.90×
- Total profit
- $49,228
- Equity at exit
- $16,860
Cash invested: $54,600 (down + closing). Projections, not guarantees.
Landlord ↔ Tenant lean methodology
- Overall (STATE)
- 90 Strongly Landlord-Friendly
- State Indiana
- 90 Strongly Landlord-Friendly · R+11
- County
- — inherits STATE
- City
- — inherits STATE
ZIP-level market 46112
- Rents YoY
- 6.3%
- Active inventory
- 328
- Price-to-rent
- 8.4×
Monthly cashflow live
- Estimated rent
- $1,946 medium interval (Pro) →
- Mortgage (P&I)
- −$1,023
- Tax from tax record
- −$130 /mo · $1,562/yr
- Insurance
- −$81
- HOA
- −$0
- Vacancy / Maint / Mgmt
- −$409
- Net cashflow
- $303
Break-even live
UW: 25.0% down · 7.5% · 30yr · 1.5% tax · 5.0% vac · 8.0% maint · 8.0% mgmt
Financing live
Cash to close
- Down payment
- $48,750
- Closing costs
- $5,850
- Reserves months
- —
- Total cash needed
- —
Loan-product check · same deal, 3 products live
Conventional
25% down · 7.5% · 30yr
- Down + closing
- —
- Monthly P&I
- —
- Monthly cashflow
- —
- DSCR
- —
- Eligible?
- —
Personal DTI + credit; lowest rate.
DSCR
20% down · 8.5% · 30yr
- Down + closing
- —
- Monthly P&I
- —
- Monthly cashflow
- —
- DSCR
- —
- Eligible?
- —
No personal income docs; deal must DSCR.
Hard money
10% down · 12.0% · 12mo
- Down + closing
- —
- Monthly P&I
- —
- Monthly cashflow
- —
- DSCR
- —
- Eligible?
- —
Short-term bridge; refi at stabilization.
Rent comps 3 comps
| Address | Beds | Baths | Sqft | Rent | $/sqft | DOM | Units | Dist |
|---|---|---|---|---|---|---|---|---|
| 7249 Arbuckle Cmns Brownsburg, IN | 1.0–2.0 | 1.0–2.5 | 1548 | $2,545 | $1.64 | 1d | 17 | 1.15mi |
| 5793 N Green St Brownsburg, IN | 1.0–2.0 | 1.0–2.0 | 835 | $1,678 | $2.01 | 4d | 7 | 1.16mi |
| 4155 N County Road 575 E Brownsburg, IN | 2.0 | 1.0 | 783 | $1,100 | $1.40 | 1d | 1 | 1.22mi |
Listing history 19 events
-
2026-04-30status Pending
-
2026-04-29$195,000 Active
-
2022-03-08soldstatus $162,996 Closed 261-char remark
Show marketing remark (261 chars)
953SF Move in ready, 3BR 1BA, new flooring, fenced in backyard w/patio area. With in walking distance of Williams Park. Great starter home or investment property for a rental. This won't last. See today!Preliminary Title work done through Abstract & Title.
-
2022-02-22status Pending 261-char remark
Show marketing remark (261 chars)
953SF Move in ready, 3BR 1BA, new flooring, fenced in backyard w/patio area. With in walking distance of Williams Park. Great starter home or investment property for a rental. This won't last. See today!Preliminary Title work done through Abstract & Title.
-
2022-02-21status Active 261-char remark
Show marketing remark (261 chars)
953SF Move in ready, 3BR 1BA, new flooring, fenced in backyard w/patio area. With in walking distance of Williams Park. Great starter home or investment property for a rental. This won't last. See today!Preliminary Title work done through Abstract & Title.
-
2022-02-11status Pending 261-char remark
Show marketing remark (261 chars)
953SF Move in ready, 3BR 1BA, new flooring, fenced in backyard w/patio area. With in walking distance of Williams Park. Great starter home or investment property for a rental. This won't last. See today!Preliminary Title work done through Abstract & Title.
-
2022-02-09status Active 261-char remark
Show marketing remark (261 chars)
953SF Move in ready, 3BR 1BA, new flooring, fenced in backyard w/patio area. With in walking distance of Williams Park. Great starter home or investment property for a rental. This won't last. See today!Preliminary Title work done through Abstract & Title.
-
2022-01-27status Pending 261-char remark
Show marketing remark (261 chars)
953SF Move in ready, 3BR 1BA, new flooring, fenced in backyard w/patio area. With in walking distance of Williams Park. Great starter home or investment property for a rental. This won't last. See today!Preliminary Title work done through Abstract & Title.
-
2022-01-24$164,900 Active 261-char remark
Show marketing remark (261 chars)
953SF Move in ready, 3BR 1BA, new flooring, fenced in backyard w/patio area. With in walking distance of Williams Park. Great starter home or investment property for a rental. This won't last. See today!Preliminary Title work done through Abstract & Title.
-
2016-08-17soldstatus $84,000 Sold 301-char remark
Show marketing remark (301 chars)
Newly updated 3BR home within walking distance to Williams Park. Brand new flooring and paint throughout the entire home with large living area and eat in kitchen. Newer windows and roof installed. Large fenced in backyard with patio area for grilling!! A must see in this quiet residential area!!
-
2016-08-04status Pending 301-char remark
Show marketing remark (301 chars)
Newly updated 3BR home within walking distance to Williams Park. Brand new flooring and paint throughout the entire home with large living area and eat in kitchen. Newer windows and roof installed. Large fenced in backyard with patio area for grilling!! A must see in this quiet residential area!!
-
2016-07-17historical Active with Contingency 301-char remark
Show marketing remark (301 chars)
Newly updated 3BR home within walking distance to Williams Park. Brand new flooring and paint throughout the entire home with large living area and eat in kitchen. Newer windows and roof installed. Large fenced in backyard with patio area for grilling!! A must see in this quiet residential area!!
-
2016-07-09$84,500 Active 301-char remark
Show marketing remark (301 chars)
Newly updated 3BR home within walking distance to Williams Park. Brand new flooring and paint throughout the entire home with large living area and eat in kitchen. Newer windows and roof installed. Large fenced in backyard with patio area for grilling!! A must see in this quiet residential area!!
-
2007-07-12historical
-
2007-05-14$94,900
-
2004-06-30soldstatus $85,000
-
2004-03-29$88,900
-
2000-06-16soldstatus $82,000
-
2000-04-25$84,700
ⓘ Source: listings_history table (triggers on properties + properties_extension) + one-shot
backfill from property_details.listing_events for pre-trigger history.
Tax reassessment forecast IN · Partial reset (capped growth)
- Current annual tax
- $1,562 · $130/mo
- Projected year-2 tax
- $1,610 · $134/mo
- Expected delta
- +$48/yr (+$4/mo · 3.1%)
ⓘ Screening estimate from a state-policy table — verify with the county assessor before closing.
Climate risk First Street
- Flood 1/10 Low FEMA zone X (unshaded) · 0% chance over 30 yrs
- Wildfire 1/10 Low
- Heat 3/10 Moderate 7 d/yr ≥100°F today · 19 d/yr by 30 yrs out
- Wind 2/10 Low 0% chance of damaging wind over 30 yrs
- Air quality 2/10 Low 1 unhealthy d/yr today · 2 by 30 yrs out
Nearby sold comps map
Loading sold comps map…
Walkable amenities ~0.75 mi
Loading nearby amenities…
Taxation est. · year 1
- Rental income
- $23,352
- − Mortgage interest
- −$10,923
- − Property taxes
- −$1,562
- − Insurance
- −$975
- − Repairs & maintenance
- −$1,868
- − Management
- −$1,868
- − Depreciation
- −$5,673
- Taxable income
- $483
- Est. tax owed @ 24.0%
- −$116
- After-tax cash flow
- $3,524/yr
For passive investors: Depreciation is non-cash, so a rental often shows a tax loss while cash-flowing — sheltering income. Rental losses are passive: they offset passive income freely, and up to $25,000/yr can offset ordinary (W-2) income if you actively participate and your MAGI is under $100k (phasing out to $0 by $150k); unused losses carry forward. On sale, claimed depreciation is recaptured at up to 25%, and gains may owe capital-gains tax (a 1031 exchange can defer both). Figures are a year-1 estimate at your 24.0% rate — not tax advice; consult a CPA.
Schools (NCES district)
- District
- Brownsburg Community School Corporation
- NCES district ID
- 1801020
- Math proficiency
- 72% ▼ -5.00%
- Reading proficiency
- 72% ▼ -4.00%
- Median HH income
- $75,304
- Composite
- 63.45/100
- National rank
- #616
- State rank
- #2 of 301 in IN
Livability — Brownsburg
- Score
- 75/100
- State rank
- #61
- US rank
- #4105
Category grades
Schools grade is shown separately in the Schools card above.
Census & demographics
- Census place
- Brownsburg, IN
- County
- Hendricks County · 143,373 people
- City population
- 44,220
- Metro
- Indianapolis-Carmel-Anderson, IN
- Population (ZIP)
- 44,220
- Household income
- $112,565
- Rent vs Own
- Severe rent burden
- 614.0
Population outlook (Hendricks County) Hauer SSP2
- Today (2025)
- 187,418 people
- By 2030
- 201,494 · +7.5%
- By 2040
- 228,487 · +21.9%
- By 2050
- 253,068 · +35.0%
- By 2075
- 308,920 · +64.8%
- By 2100
- 336,510 · +79.6%
Race, ethnicity, and origin ACS 2023
- Neighborhood character
- Predominantly White (83%)
- Race & ethnicity
- White 83% Black 10% Two or more races 4% Hispanic / Latino 4%
- Common ancestry
- Slovak 3% Iranian 2% Romanian 2%
- Foreign-born
- 6% · Canada, China
- Languages at home
- 93% English-only · Spanish 2% French/Haitian/Cajun 1%
Political lean MEDSL · Hendricks
- 2024 margin
- Strong R (+21.5) · D 38.4% · R 59.9% · Other 1.7%
- 2008→2024 swing
- +1.9pp toward D · 2008: -23.4pp · 2024: -21.5pp
- All cycles
- 2024: R+21.5 2020: R+23.9 2016: R+34.2 2012: R+34.9 2008: R+23.4
Not yet ingested
- Civics
- —
Market trends
- HPI YoY
- ▼ -135.99%
- Current HPI
- 217.3787
- Rent YoY
- ▲ 6.31%
- Metro
- Indianapolis-Carmel-Anderson, IN
- State GDP YoY
- ▲ 2.90%
- F500 in state
- 18
Industry mix (Fortune 500 HQ in IN)
| Industry | F500 HQs | Revenue |
|---|---|---|
| Industrial Machinery | 2 | $37B |
|
||
| Healthcare | 1 | $177B |
|
||
| Pharmaceuticals | 1 | $45B |
|
||
| Metals / Steel | 1 | $18B |
|
||
| Agriculture | 1 | $17B |
|
||
| Packaging | 1 | $12B |
|
||
Price history
+130.2% since first listed19 events — show timeline
- 2026-04-30 Pending — MIBOR as Distributed by MLS Grid
- 2026-04-29 Listed $195,000 MIBOR as Distributed by MLS Grid
- 2022-03-08 Sold (MLS) $162,996 MIBOR as Distributed by MLS Grid
- 2022-02-22 Pending — MIBOR as Distributed by MLS Grid
- 2022-02-21 Relisted — MIBOR as Distributed by MLS Grid
- 2022-02-11 Pending — MIBOR as Distributed by MLS Grid
- 2022-02-09 Relisted — MIBOR as Distributed by MLS Grid
- 2022-01-27 Pending — MIBOR as Distributed by MLS Grid
- 2022-01-24 Listed $164,900 MIBOR as Distributed by MLS Grid
- 2016-08-17 Sold (MLS) $84,000 MIBOR as Distributed by MLS Grid
- 2016-08-04 Pending — MIBOR as Distributed by MLS Grid
- 2016-07-17 Contingent — MIBOR as Distributed by MLS Grid
- 2016-07-09 Listed $84,500 MIBOR as Distributed by MLS Grid
- 2007-07-12 Listing Removed — MIBOR as Distributed by MLS Grid
- 2007-05-14 Listed $94,900 MIBOR as Distributed by MLS Grid
- 2004-06-30 Sold (MLS) $85,000 MIBOR as Distributed by MLS Grid
- 2004-03-29 Listed $88,900 MIBOR as Distributed by MLS Grid
- 2000-06-16 Sold (MLS) $82,000 MIBOR as Distributed by MLS Grid
- 2000-04-25 Listed $84,700 MIBOR as Distributed by MLS Grid
Property tax history
+0.5%/yrLatest (2025): $1,562 · +7.9% YoY. Source: county tax records.
Cash-flow waterfall
monthlySold comps — $/sqft
last 12 mo · ≤1 miLoading sold comps…