475 W Depot St · Avinger, TX
Flood risk 1/10 · Minimal
- FEMA flood zone
- X (unshaded)
- Chance of flooding over 30 yrs
- 0.0%
- Est. flood insurance / yr
- $507 – $1,088
Fire risk 5/10 · Moderate
- Est. fire insurance / yr
- $1,222 – $2,270
Heat risk 7/10 · Major
- Hot days now (above 112°F)
- 7 days/yr
- Hot days in 30 yrs
- 23 days/yr
Wind risk 6/10 · Moderate
- Chance of severe wind over 30 yrs
- 45.0%
Air-quality risk 2/10 · Minimal
- Unhealthy air days now
- 0 days/yr
- Unhealthy air days in 30 yrs
- 1 days/yr
Risk factors via First Street. Map © Google.
Why this score? — see what drove the B+ grade
The composite is a weighted blend of 9 inputs, each scored 0–100. Each bar is that input's sub-score; the figure is the points it added to the 100-point composite (weight × sub-score).
- Cash flow +29.7/30.0
- ARV discount +15.0/15.0
- DSCR +10.0/10.0
- 1% rule +8.0/10.0
- Appreciation +6.1/10.0
- Schools +3.2/10.0
- Livability +3.0/5.0
- Rent growth +2.5/5.0
- Condition / age +2.5/5.0
$89,900
🖨 Deal sheet (PDF) 📄 Offer letter ✓ Due diligence
Listing remarks MLS
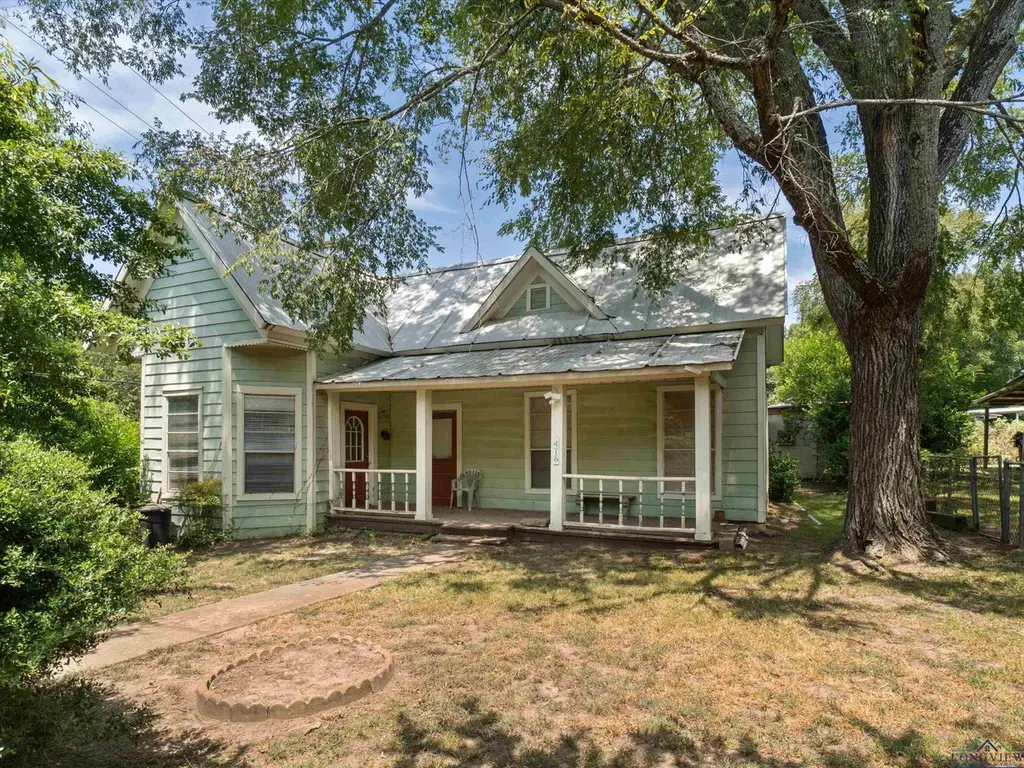
BUILT IN 1927 – FULL OF CHARM & CHARACTER This older home is full of uniqueness and possibilities! Featuring 3 bedrooms, 1.5 baths, a sunroom, and tons of built-ins, it offers warmth and personality throughout. Relax on the inviting front porch with your morning coffee or take advantage of the spacious workshop—perfect for hobbies, a craft space, or a man cave. While the home is in need of some TLC, it has incredible potential to be transformed into a cozy rental, a charming retirement home, or a sought-after Airbnb. Sitting on a corner lot with a chain-link fence, this property offers both convenience and charm—ready for your vision to bring it to life!
Key facts
- Front porch
- Spacious workshop
- Sunroom
Tags
Neighborhood map
What this means for you Summary
Snapshot
- This is a 3-bed/1.5-bath single-family listed at $90k.
Deal economics
- At list price, monthly cash flow is $326 ($4k/yr) — positive.
- The deal already cash-flows at list — no discount required.
- Meets the 1% rule at list price ($1k rent vs $90k).
- Recommended offer: $79k (12.0% below list) — sets the bar for market timing.
Location & tenants
- Location reads 60/100 on livability (#1,080 in TX) — a middle-class / working-renter tenant base. Strengths: cost of living A+, housing A+; Watch: schools F, crime F, amenities F.
- Avinger ISD (rural): math 35% / reading 35% proficiency, ranked #903 of 1,141 in TX (top 79%) — families likely to look elsewhere, expect single-tenant / working-renter base with shorter leases; 68% free/reduced lunch — lower-income household profile, screen leases tightly.
- Market conditions: 84 active listings in the ZIP; 12 units permitted in Cass County in 2024 (0 in 5+ unit buildings).
Forward outlook
- In year one you build about $3k of equity ($622 loan paydown + $2k appreciation (2.2% local appreciation)).
- Cass County population projected to shrink 9% by 2050 — rents likely to lag national; underwrite the cash flow, not the appreciation.
- At projected returns (2.2% appreciation + 3.0% rent growth), your $25k cash investment doubles in ~4 years — after that, you're playing with house money.
Negotiation context
- It's been on market 310 days — a 12% lower offer ($79k) is reasonable based on typical stale-listing flexibility.
Risks & watch-outs
- Watch-outs: built in 1927 — expect roof / HVAC / electrical / plumbing capex.
- Climate carrying-cost: major wind risk, 45% chance of damaging wind over 30y; moderate wildfire risk; extreme-heat days projected 7→23/yr by 2055 (HVAC capex compounding) — expect insurance premiums to compound above CPI over the hold.
Questions for the listing agent
- It's been on market 310 days. Have you received any prior offers? Is the seller open to a 12% concession, seller financing, or rate buy-down credit?
- Built in 1927 — when were the roof, HVAC, electrical panel, plumbing, and water heater last replaced?
- Why hasn't it sold? Are there any deal-killer items the seller is aware of (foundation, flood, title, zoning, code violations)?
- Is there a deadline driving the sale (1031 exchange, divorce, estate, relocation)? That informs how much negotiation room exists.
- Schools are F-rated, which usually means shorter tenancies and higher turnover. Who's the typical renter profile here, and what's been the actual vacancy rate?
- Crime grade is F in this area — have there been break-ins, vandalism, or insurance claims at this property in the last 3 years? What carrier currently insures it and at what premium?
- What's the average days-on-market for RENTAL listings here right now (not sales)? A rising rental-DOM trend means longer vacancies and softer asking-rent achievability than the comps imply.
- What's the recent tenant-quality profile in this submarket — average credit score on applications, eviction rate, late-payment / NSF rate, and stable-employment percentage? A property-management company in the area should have these aggregated.
- How much new for-sale + rental construction is in the pipeline within 1–3 miles? Heavy new supply typically softens prices + rents 12–24 months out; constrained supply supports both.
Investment metrics
- 1% rule
- 1.30% ✓
- Cap rate
- 10.65%
- Cash-on-cash
- 15.54%
- DSCR
- 1.69
- GRM
- 6.4
CMA / ARV
- ARV (median comp)
- $141,972
- List price
- $89,900
- Delta
- -36.68%
- Verdict
- UNDERPRICED
- Comps
- 2 within 1.0 mi
Projected returns pro-forma
2.25% appreciation · 3.0% rent growth · sell at horizon
- IRR
- 20.4%
- Equity multiple
- 2.12×
- Total profit
- $28,098
- Equity at exit
- $36,699
- IRR
- 22.2%
- Equity multiple
- 4.00×
- Total profit
- $75,426
- Equity at exit
- $53,816
Cash invested: $25,172 (down + closing). Projections, not guarantees.
Landlord ↔ Tenant lean methodology
- Overall (STATE)
- 87 Strongly Landlord-Friendly
- State Texas
- 87 Strongly Landlord-Friendly · R+5
- County
- — inherits STATE
- City
- — inherits STATE
ZIP-level market 75630
- Home prices YoY
- 2.0%
- Active inventory
- 84
- Price-to-rent
- 6.4×
Monthly cashflow live
- Estimated rent
- $1,165 medium interval (Pro) →
- Mortgage (P&I)
- −$471
- Tax from tax record
- −$85 /mo · $1,021/yr
- Insurance
- −$37
- HOA
- −$0
- Vacancy / Maint / Mgmt
- −$245
- Net cashflow
- $326
Break-even live
Sensitivity live
| Price | -10% $377 | -5% $352 | +0% $326 | +5% $301 | +10% $275 |
|---|---|---|---|---|---|
| Rent | -10% $234 | -5% $280 | +0% $326 | +5% $372 | +10% $418 |
| Rate | -1.0pp $371 | -0.5pp $349 | base $326 | +0.5pp $303 | +1.0pp $279 |
UW: 25.0% down · 7.5% · 30yr · 1.5% tax · 5.0% vac · 8.0% maint · 8.0% mgmt
Financing live
Cash to close
- Down payment
- $22,475
- Closing costs
- $2,697
- Reserves months
- —
- Total cash needed
- —
Loan-product check · same deal, 3 products live
Conventional
25% down · 7.5% · 30yr
- Down + closing
- —
- Monthly P&I
- —
- Monthly cashflow
- —
- DSCR
- —
- Eligible?
- —
Personal DTI + credit; lowest rate.
DSCR
20% down · 8.5% · 30yr
- Down + closing
- —
- Monthly P&I
- —
- Monthly cashflow
- —
- DSCR
- —
- Eligible?
- —
No personal income docs; deal must DSCR.
Hard money
10% down · 12.0% · 12mo
- Down + closing
- —
- Monthly P&I
- —
- Monthly cashflow
- —
- DSCR
- —
- Eligible?
- —
Short-term bridge; refi at stabilization.
Listing history 17 events
-
2026-06-18days on market $89,900 Active 310 DOM
-
2026-06-17days on market $89,900 Active 309 DOM
-
2026-06-16days on market $89,900 Active 308 DOM
-
2026-06-15days on market $89,900 Active 307 DOM
-
2026-06-13days on market $89,900 Active 305 DOM
-
2026-06-12days on market $89,900 Active 304 DOM
-
2026-06-09days on market $89,900 Active 301 DOM
-
2026-06-08days on market $89,900 Active 300 DOM
-
2026-06-08days on market $89,900 Active 299 DOM
-
2026-06-05days on market $89,900 Active 297 DOM
-
2026-06-03days on market $89,900 Active 295 DOM
-
2026-06-02days on market $89,900 Active 294 DOM
-
2026-06-01days on market $89,900 Active 293 DOM
-
2026-05-31days on market $89,900 Active 292 DOM
-
2026-03-31price $89,900 686-char remark
Show marketing remark (686 chars)
BUILT IN 1927 – FULL OF CHARM & CHARACTER This older home is full of uniqueness and possibilities! Featuring 3 bedrooms, 1.5 baths, a sunroom, and tons of built-ins, it offers warmth and personality throughout. Relax on the inviting front porch with your morning coffee or take advantage of the spacious workshop—perfect for hobbies, a craft space, or a man cave. While the home is in need of some TLC, it has incredible potential to be transformed into a cozy rental, a charming retirement home, or a sought-after Airbnb. Sitting on a corner lot with a chain-link fence, this property offers both convenience and charm—ready for your vision to bring it to life!
-
2026-01-25price $94,500 686-char remark
Show marketing remark (686 chars)
BUILT IN 1927 – FULL OF CHARM & CHARACTER This older home is full of uniqueness and possibilities! Featuring 3 bedrooms, 1.5 baths, a sunroom, and tons of built-ins, it offers warmth and personality throughout. Relax on the inviting front porch with your morning coffee or take advantage of the spacious workshop—perfect for hobbies, a craft space, or a man cave. While the home is in need of some TLC, it has incredible potential to be transformed into a cozy rental, a charming retirement home, or a sought-after Airbnb. Sitting on a corner lot with a chain-link fence, this property offers both convenience and charm—ready for your vision to bring it to life!
-
2025-08-12$99,000 Active 686-char remark
Show marketing remark (686 chars)
BUILT IN 1927 – FULL OF CHARM & CHARACTER This older home is full of uniqueness and possibilities! Featuring 3 bedrooms, 1.5 baths, a sunroom, and tons of built-ins, it offers warmth and personality throughout. Relax on the inviting front porch with your morning coffee or take advantage of the spacious workshop—perfect for hobbies, a craft space, or a man cave. While the home is in need of some TLC, it has incredible potential to be transformed into a cozy rental, a charming retirement home, or a sought-after Airbnb. Sitting on a corner lot with a chain-link fence, this property offers both convenience and charm—ready for your vision to bring it to life!
ⓘ Source: listings_history table (triggers on properties + properties_extension) + one-shot
backfill from property_details.listing_events for pre-trigger history.
Tax reassessment forecast TX · Resets to sale price
- Current annual tax
- $1,021 · $85/mo
- Projected year-2 tax
- $1,645 · $137/mo
- Expected delta
- +$625/yr (+$52/mo · 61.2%)
ⓘ Screening estimate from a state-policy table — verify with the county assessor before closing.
Climate risk First Street
- Flood 1/10 Low FEMA zone X (unshaded) · 0% chance over 30 yrs
- Wildfire 5/10 Major
- Heat 7/10 Severe 7 d/yr ≥112°F today · 23 d/yr by 30 yrs out
- Wind 6/10 Major 45% chance of damaging wind over 30 yrs
- Air quality 2/10 Low 0 unhealthy d/yr today · 1 by 30 yrs out
Nearby sold comps map
Loading sold comps map…
Walkable amenities ~0.75 mi
Loading nearby amenities…
Taxation est. · year 1
- Rental income
- $13,975
- − Mortgage interest
- −$5,036
- − Property taxes
- −$1,021
- − Insurance
- −$450
- − Repairs & maintenance
- −$1,118
- − Management
- −$1,118
- − Depreciation
- −$2,615
- Taxable income
- $2,618
- Est. tax owed @ 24.0%
- −$628
- After-tax cash flow
- $3,285/yr
For passive investors: Depreciation is non-cash, so a rental often shows a tax loss while cash-flowing — sheltering income. Rental losses are passive: they offset passive income freely, and up to $25,000/yr can offset ordinary (W-2) income if you actively participate and your MAGI is under $100k (phasing out to $0 by $150k); unused losses carry forward. On sale, claimed depreciation is recaptured at up to 25%, and gains may owe capital-gains tax (a 1031 exchange can defer both). Figures are a year-1 estimate at your 24.0% rate — not tax advice; consult a CPA.
Schools (NCES district)
- District
- Avinger ISD
- NCES district ID
- 4809090
- Math proficiency
- 35% ▲ 20.00%
- Reading proficiency
- 35% ▬ 0.00%
- Median HH income
- $42,510
- Composite
- 32.26/100
- National rank
- #10932
- State rank
- #903 of 1141 in TX
Livability — Avinger
- Score
- 60/100
- State rank
- #1080
- US rank
- #19129
Category grades
Schools grade is shown separately in the Schools card above.
Census & demographics
- Census place
- Avinger, TX
- Population (ZIP)
- 2,693
Population outlook (Cass County) Hauer SSP2
- Today (2025)
- 29,998 people
- By 2030
- 29,583 · -1.4%
- By 2040
- 28,512 · -5.0%
- By 2050
- 27,230 · -9.2%
- By 2075
- 24,917 · -16.9%
- By 2100
- 21,582 · -28.1%
Race, ethnicity, and origin ACS 2023
- Neighborhood character
- Predominantly White (80%)
- Race & ethnicity
- White 80% Black 9% Hispanic / Latino 7% Two or more races 6%
- Hispanic origin (detail)
- Mexican 5%
- Common ancestry
- Slovak 3% Iranian 2% Portuguese 2%
- Foreign-born
- 3% · Canada
- Languages at home
- 97% English-only · Spanish 2%
Political lean MEDSL · Cass
- 2024 margin
- Solid R (+65.7) · D 17.0% · R 82.7%
- 2008→2024 swing
- -25.2pp toward R · 2008: -40.4pp · 2024: -65.7pp
- All cycles
- 2024: R+65.7 2020: R+59.1 2016: R+59.7 2012: R+49.5 2008: R+40.4
Not yet ingested
- Civics
- —
Market trends
- HPI YoY
- ▲ 2.25%
- Current HPI
- 112.8934
- Rent YoY
- —
- Metro
- —
- State GDP YoY
- ▲ 3.95%
- F500 in state
- 110
Industry mix (Fortune 500 HQ in TX)
| Industry | F500 HQs | Revenue |
|---|---|---|
| Energy | 16 | $1,198B |
|
||
| Technology | 5 | $198B |
|
||
| Engineering / Construction | 4 | $72B |
|
||
| Energy Services | 3 | $60B |
|
||
| Utilities | 3 | $41B |
|
||
| Healthcare | 2 | $330B |
|
||
Price history
-9.2% since first listed3 events — show timeline
- 2026-03-31 Price Changed $89,900 LAAR
- 2026-01-25 Price Changed $94,500 LAAR
- 2025-08-12 Listed $99,000 LAAR
Property tax history
-0.4%/yrLatest (2025): $1,021 · -4.1% YoY. Source: county tax records.
Cash-flow waterfall
monthlySold comps — $/sqft
last 12 mo · ≤1 miLoading sold comps…