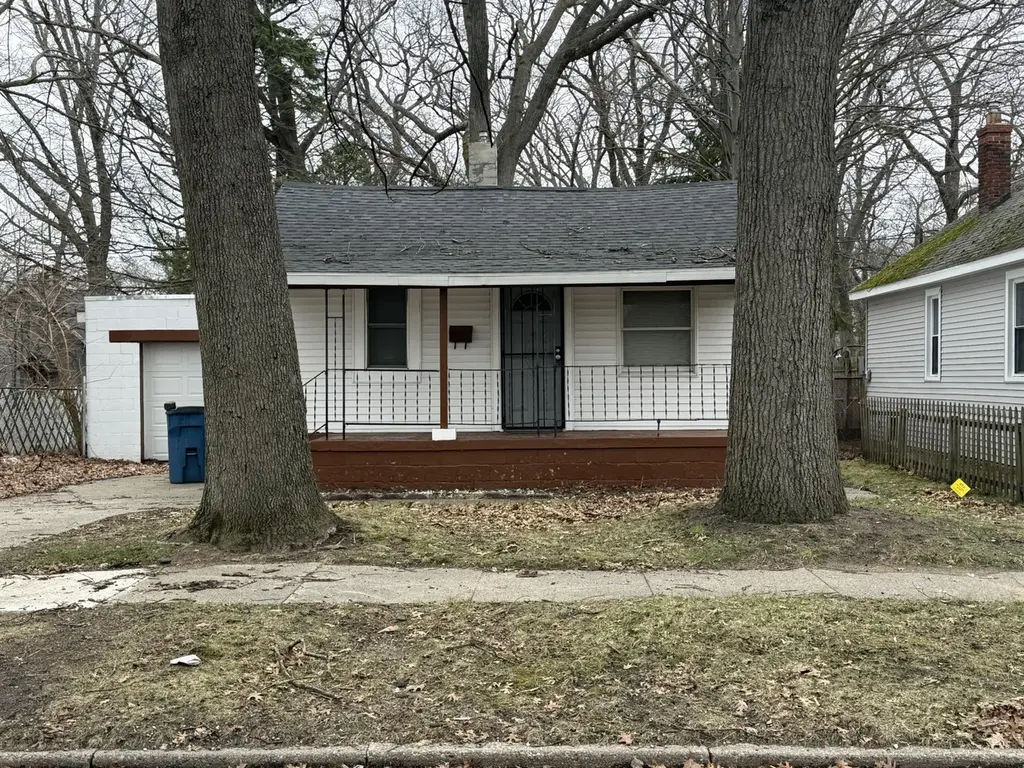
2820 Park St · Muskegon Heights, MI
Flood risk 3/10 · Minor
- FEMA flood zone
- X (unshaded)
- Chance of flooding over 30 yrs
- 0.2%
- Est. flood insurance / yr
- $473 – $860
Fire risk 1/10 · Minimal
- Est. fire insurance / yr
- $784 – $1,456
Heat risk 2/10 · Minimal
- Hot days now (above 93°F)
- 7 days/yr
- Hot days in 30 yrs
- 15 days/yr
Wind risk 1/10 · Minimal
- Chance of severe wind over 30 yrs
- —
Air-quality risk 4/10 · Minor
- Unhealthy air days now
- 5 days/yr
- Unhealthy air days in 30 yrs
- 7 days/yr
Risk factors via First Street. Map © Google.
Why this score? — see what drove the D+ grade
The composite is a weighted blend of 9 inputs, each scored 0–100. Each bar is that input's sub-score; the figure is the points it added to the 100-point composite (weight × sub-score).
- Cash flow +21.1/30.0
- DSCR +6.7/10.0
- 1% rule +5.7/10.0
- Schools +5.0/10.0
- Livability +3.1/5.0
- Rent growth +2.5/5.0
- Condition / age +2.5/5.0
- ARV discount +0.0/15.0
- Appreciation +0.0/10.0
$77,900
🖨 Deal sheet 📄 Offer letter ✓ Due diligence
Listing remarks MLS
Excellent investment opportunity in West Michigan! This well-maintained property is currently tenant-occupied with a long-term renter who is on a month-to-month lease and would like to stay, offering immediate rental income for the new owner. Ideal for investors looking to add a turnkey property to their portfolio or for buyers seeking flexibility. Convenient location with strong rental history--don't miss this opportunity!
Key facts
- 6,229 sq ft lot
- Garage
- Built 1915
Property features AI
Exterior
- Parking: Attached garage (1 car)
- Utilities: Natural gas water heater; Public water
- Home design: Single family residence; Residential property; Built in 1915
- Construction: Brick and vinyl siding construction; Composition roof; Living area approximately 616
- Exterior features: Sidewalk; Paved road access; Public water
Interior
- Bedrooms: Primary bedroom; Second bedroom
- Bathrooms: 1 full bathroom (primary bathroom)
- Heating & cooling: Forced air heating; Has heating
- Interior features: Replacement windows; Full basement; 4 total rooms
Neighborhood map
What this means for you Summary
Snapshot
- This is a 2-bed/1.0-bath single-family listed at $78k.
Deal economics
- At list price, monthly cash flow is $112 ($1k/yr) — positive.
- The deal already cash-flows at list — no discount required.
- Meets the 1% rule at list price ($836 rent vs $78k).
- Recommended offer: $73k (6.0% below list) — sets the bar for market timing.
Location & tenants
- Location reads 61/100 on livability (#574 in MI) — a middle-class / working-renter tenant base. Strengths: cost of living A+, housing A; Watch: schools D+, crime F, amenities F.
- Market conditions: 237 active listings in the ZIP; 5 comparable units currently listed for rent nearby; rentals at typical pace (median 21d on market — plan ~3-4 weeks tenant-placement turnaround); 438 units permitted in Muskegon County in 2024 (115 in 5+ unit buildings).
Forward outlook
- Local home prices are declining (-3.0%/yr); year-one equity from $539 of loan paydown is wiped out by about $2k of value loss. Plan a longer hold.
- Muskegon County population projected to shrink 8% by 2050 — rents likely to lag national; underwrite the cash flow, not the appreciation.
Negotiation context
- It's been on market 77 days — a 6% lower offer ($73k) is reasonable based on typical stale-listing flexibility.
- 20 sale attempts since 4y ago with the ask held roughly flat each time — persistent listings suggest the price (not the market) is what's stuck; bring a comps-based counter.
- Current owner paid $65k; 20% above their basis — modest negotiation headroom, anchor on the comps not their cost.
Risks & watch-outs
- Watch-outs: built in 1915 — expect roof / HVAC / electrical / plumbing capex.
Questions for the listing agent
- It's been on market 77 days. Have you received any prior offers? Is the seller open to a 6% concession, seller financing, or rate buy-down credit?
- Built in 1915 — when were the roof, HVAC, electrical panel, plumbing, and water heater last replaced?
- Why hasn't it sold? Are there any deal-killer items the seller is aware of (foundation, flood, title, zoning, code violations)?
- Is there a deadline driving the sale (1031 exchange, divorce, estate, relocation)? That informs how much negotiation room exists.
- Schools are D-rated, which usually means shorter tenancies and higher turnover. Who's the typical renter profile here, and what's been the actual vacancy rate?
- Crime grade is F in this area — have there been break-ins, vandalism, or insurance claims at this property in the last 3 years? What carrier currently insures it and at what premium?
- The area grade is low — what's the realistic commute time and amenity access for the typical tenant pool here? Any planned neighborhood developments (good or bad) we should know about?
- What's the average days-on-market for RENTAL listings here right now (not sales)? A rising rental-DOM trend means longer vacancies and softer asking-rent achievability than the comps imply.
- What's the recent tenant-quality profile in this submarket — average credit score on applications, eviction rate, late-payment / NSF rate, and stable-employment percentage? A property-management company in the area should have these aggregated.
- How much new for-sale + rental construction is in the pipeline within 1–3 miles? Heavy new supply typically softens prices + rents 12–24 months out; constrained supply supports both.
Investment metrics
- 1% rule
- 1.07% ✓
- Cap rate
- 8.02%
- Cash-on-cash
- 6.16%
- DSCR
- 1.27
- GRM
- 7.8
CMA / ARV
- ARV (on-the-fly)
- $65,912
- Comps found
- 12
Show comp detail 12 sales within ~0.75 mi
| Address | Dist | Beds/Ba | Sqft | Sold | Price | $/sf | Match |
|---|---|---|---|---|---|---|---|
| 3015 Lemuel St | 0.29mi | 2/1.0 | 592 (-4%) | 6mo | $29,900 | $51 | 75 |
| 3041 Park St | 0.25mi | 2/1.0 | 604 (-2%) | 16mo | $65,000 | $108 | 72 |
| 3212 5th St | 0.50mi | 2/1.0 | 624 (+1%) | 14mo | $68,000 | $109 | 63 |
| 2524 8th St | 0.42mi | 1/1.0 (-1) | 576 (-6%) | 10mo | $60,000 | $104 | 56 |
| 2925 Lemuel St | 0.24mi | 2/1.0 | 672 (+9%) | 21mo | $114,900 | $171 | 56 |
| 2417 7th St | 0.57mi | 2/1.0 | 576 (-6%) | 14mo | $72,500 | $126 | 51 |
| 3140 Temple St | 0.40mi | 2/1.0 | 690 (+12%) | 12mo | $90,000 | $130 | 51 |
| 3364 7th St | 0.64mi | 1/1.0 (-1) | 660 (+7%) | 9mo | $39,900 | $60 | 45 |
| 3229 Waalkes St | 0.44mi | 2/1.0 | 700 (+14%) | 14mo | $75,000 | $107 | 45 |
| 3300 5th St | 0.56mi | 2/1.0 | 704 (+14%) | 8mo | $59,500 | $85 | 43 |
| 3316 Sanford St | 0.68mi | 1/1.0 (-1) | 640 (+4%) | 22mo | $45,000 | $70 | 38 |
| 3304 Jefferson St | 0.63mi | 3/1.0 (+1) | 688 (+12%) | 20mo | $59,900 | $87 | 29 |
Match score weights: distance 35% · size 25% · config 20% · recency 20%. Top-matched comps best support the ARV.
Projected returns pro-forma
-3.0% appreciation · 3.0% rent growth · sell at horizon
- IRR
- -6.8%
- Equity multiple
- 0.75×
- Total profit
- $-5,476
- Equity at exit
- $11,615
- IRR
- 2.9%
- Equity multiple
- 1.21×
- Total profit
- $4,486
- Equity at exit
- $6,735
Cash invested: $21,812 (down + closing). Projections, not guarantees.
Landlord ↔ Tenant lean methodology
- Overall (STATE)
- 62 Landlord-Friendly
- State Michigan
- 62 Landlord-Friendly · EVEN
- County
- — inherits STATE
- City
- — inherits STATE
ZIP-level market 49444
- Active inventory
- 237
- Price-to-rent
- 7.8×
Monthly cashflow live
- Estimated rent
- $836 high interval (Pro) →
- Mortgage (P&I)
- −$409
- Tax from tax record
- −$107 /mo · $1,288/yr
- Insurance
- −$32
- HOA
- −$0
- Vacancy / Maint / Mgmt
- −$176
- Net cashflow
- $112
Break-even live
UW: 25.0% down · 7.5% · 30yr · 1.5% tax · 5.0% vac · 8.0% maint · 8.0% mgmt
Financing live
Cash to close
- Down payment
- $19,475
- Closing costs
- $2,337
- Reserves months
- —
- Total cash needed
- —
Loan-product check · same deal, 3 products live
Conventional
25% down · 7.5% · 30yr
- Down + closing
- —
- Monthly P&I
- —
- Monthly cashflow
- —
- DSCR
- —
- Eligible?
- —
Personal DTI + credit; lowest rate.
DSCR
20% down · 8.5% · 30yr
- Down + closing
- —
- Monthly P&I
- —
- Monthly cashflow
- —
- DSCR
- —
- Eligible?
- —
No personal income docs; deal must DSCR.
Hard money
10% down · 12.0% · 12mo
- Down + closing
- —
- Monthly P&I
- —
- Monthly cashflow
- —
- DSCR
- —
- Eligible?
- —
Short-term bridge; refi at stabilization.
Rent comps 5 comps
| Address | Beds | Baths | Sqft | Rent | $/sqft | DOM | Units | Dist |
|---|---|---|---|---|---|---|---|---|
| 2901 Temple St Unit 2 Muskegon Heights, MI | 1.0 | 1.0 | 400 | $750 | $1.88 | 21d | 1 | 0.18mi |
| 2516 5th St Apt 1 Muskegon Heights, MI | 1.0 | 1.0 | 630 | $775 | $1.23 | 21d | 1 | 0.53mi |
| 2516 5th St Apt 2 Muskegon Heights, MI | 1.0 | 1.0 | 630 | $750 | $1.19 | 21d | 1 | 0.53mi |
| 1893 Jefferson St Unit 2 Muskegon, MI | 1.0 | 1.0 | 594 | $700 | $1.18 | 21d | 1 | 1.29mi |
| 121 E Holbrook Ave Apt 3 Muskegon, MI | 2.0 | 1.0 | 650 | $950 | $1.46 | 21d | 1 | 1.38mi |
Listing history 50 events
-
2026-06-19days on market $77,900 Active 77 DOM
-
2026-06-18days on market $77,900 Active 76 DOM
-
2026-06-17days on market $77,900 Active 75 DOM
-
2026-06-16days on market $77,900 Active 74 DOM
-
2026-06-15days on market $77,900 Active 73 DOM
-
2026-06-14days on market $77,900 Active 71 DOM
-
2026-06-13days on market $77,900 Active 70 DOM
-
2026-06-10days on market $77,900 Active 68 DOM
-
2026-06-09days on market $77,900 Active 67 DOM
-
2026-06-08days on market $77,900 Active 66 DOM
-
2026-06-07days on market $77,900 Active 65 DOM
-
2026-06-02days on market $77,900 Active 60 DOM
-
2026-06-01days on market $77,900 Active 59 DOM
-
2026-05-31days on market $77,900 Active 58 DOM
-
2026-05-30days on market $77,900 Active 57 DOM
-
2026-04-10status Active 427-char remark
Show marketing remark (427 chars)
Excellent investment opportunity in West Michigan! This well-maintained property is currently tenant-occupied with a long-term renter who is on a month-to-month lease and would like to stay, offering immediate rental income for the new owner. Ideal for investors looking to add a turnkey property to their portfolio or for buyers seeking flexibility. Convenient location with strong rental history--don't miss this opportunity!
-
2026-04-09historical 427-char remark
Show marketing remark (427 chars)
Excellent investment opportunity in West Michigan! This well-maintained property is currently tenant-occupied with a long-term renter who is on a month-to-month lease and would like to stay, offering immediate rental income for the new owner. Ideal for investors looking to add a turnkey property to their portfolio or for buyers seeking flexibility. Convenient location with strong rental history--don't miss this opportunity!
-
2026-04-03$77,900 Active 427-char remark
Show marketing remark (427 chars)
Excellent investment opportunity in West Michigan! This well-maintained property is currently tenant-occupied with a long-term renter who is on a month-to-month lease and would like to stay, offering immediate rental income for the new owner. Ideal for investors looking to add a turnkey property to their portfolio or for buyers seeking flexibility. Convenient location with strong rental history--don't miss this opportunity!
-
2026-04-03$77,900 Active
Show marketing remark (427 chars)
Excellent investment opportunity in West Michigan! This well-maintained property is currently tenant-occupied with a long-term renter who is on a month-to-month lease and would like to stay, offering immediate rental income for the new owner. Ideal for investors looking to add a turnkey property to their portfolio or for buyers seeking flexibility. Convenient location with strong rental history--don't miss this opportunity!
-
2026-04-03$77,900 Active 427-char remark
Show marketing remark (427 chars)
Excellent investment opportunity in West Michigan! This well-maintained property is currently tenant-occupied with a long-term renter who is on a month-to-month lease and would like to stay, offering immediate rental income for the new owner. Ideal for investors looking to add a turnkey property to their portfolio or for buyers seeking flexibility. Convenient location with strong rental history--don't miss this opportunity!
-
2026-02-04historical
-
2026-02-03historical
-
2025-09-22$75,000 Active
-
2025-09-22$75,000 Active
-
2024-06-04soldstatus $65,000
-
2024-05-31soldstatus $65,000 Sold
-
2024-05-31soldstatus $65,000 Sold
-
2024-05-31soldstatus $65,000 Closed
-
2024-05-14status Pending
-
2024-05-14status Pending
-
2024-05-14status Pending
-
2024-04-25$54,900 Active
-
2024-04-25$54,900 Active
-
2024-04-25$54,900 Active
-
2023-01-20soldstatus $40,000 Sold
-
2023-01-20soldstatus $40,000 Sold
-
2023-01-16status Pending
-
2023-01-16status Pending
-
2023-01-16status Pending
-
2023-01-06price $49,999
-
2023-01-05price $49,999
-
2023-01-05price $49,999
-
2022-11-12price $55,000
-
2022-11-12price $55,000
-
2022-11-12price $55,000
-
2022-11-04status Active
-
2022-11-04status Active
-
2022-11-04status Active
-
2022-10-26status Pending
-
2022-10-26status Pending
ⓘ Source: listings_history table (triggers on properties + properties_extension) + one-shot
backfill from property_details.listing_events for pre-trigger history.
Tax reassessment forecast MI · Partial reset (capped growth)
- Current annual tax
- $1,288 · $107/mo
- Projected year-2 tax
- $1,288 · $107/mo
- Expected delta
- $0/yr ($0/mo · 0.0%)
ⓘ Screening estimate from a state-policy table — verify with the county assessor before closing.
Climate risk First Street
- Flood 3/10 Moderate FEMA zone X (unshaded) · 20% chance over 30 yrs
- Wildfire 1/10 Low
- Heat 2/10 Low 7 d/yr ≥93°F today · 15 d/yr by 30 yrs out
- Wind 1/10 Low
- Air quality 4/10 Moderate 5 unhealthy d/yr today · 7 by 30 yrs out
Nearby sold comps map
Loading sold comps map…
Walkable amenities ~0.75 mi
Loading nearby amenities…
Taxation est. · year 1
- Rental income
- $10,029
- − Mortgage interest
- −$4,364
- − Property taxes
- −$1,288
- − Insurance
- −$390
- − Repairs & maintenance
- −$802
- − Management
- −$802
- − Depreciation
- −$2,266
- Taxable income
- $117
- Est. tax owed @ 24.0%
- −$28
- After-tax cash flow
- $1,315/yr
For passive investors: Depreciation is non-cash, so a rental often shows a tax loss while cash-flowing — sheltering income. Rental losses are passive: they offset passive income freely, and up to $25,000/yr can offset ordinary (W-2) income if you actively participate and your MAGI is under $100k (phasing out to $0 by $150k); unused losses carry forward. On sale, claimed depreciation is recaptured at up to 25%, and gains may owe capital-gains tax (a 1031 exchange can defer both). Figures are a year-1 estimate at your 24.0% rate — not tax advice; consult a CPA.
Schools (NCES district)
No district data.
Livability — Muskegon Heights
- Score
- 61/100
- State rank
- #574
- US rank
- #18269
Category grades
Schools grade is shown separately in the Schools card above.
Census & demographics
- Census place
- Muskegon Heights, MI
- County
- Muskegon County · 107,917 people
- Metro
- Muskegon, MI
- Population (ZIP)
- 26,372
- Household income
- $53,054
- Rent vs Own
- Severe rent burden
- 930.0
Population outlook (Muskegon County) Hauer SSP2
- Today (2025)
- 174,032 people
- By 2030
- 173,365 · -0.4%
- By 2040
- 168,877 · -3.0%
- By 2050
- 160,306 · -7.9%
- By 2075
- 134,426 · -22.8%
- By 2100
- 98,836 · -43.2%
Race, ethnicity, and origin ACS 2023
- Neighborhood character
- Diverse neighborhood (Simpson 0.55)
- Race & ethnicity
- White 59% Black 31% Two or more races 6% Hispanic / Latino 4% Native American 1%
- Common ancestry
- Iranian 6% Romanian 4% Lithuanian 2%
- Foreign-born
- 1% · Canada
- Languages at home
- 97% English-only · Spanish 2%
Political lean MEDSL · Muskegon
- 2024 margin
- Toss-up / Even · D 48.4% · R 50.2% · Other 1.5%
- 2008→2024 swing
- -31.1pp toward R · 2008: 29.3pp · 2024: -1.8pp
- All cycles
- 2024: R+1.8 2020: D+0.6 2016: D+0.9 2012: D+17.8 2008: D+29.3
Not yet ingested
- Civics
- —
Market trends
- HPI YoY
- ▼ -150.02%
- Current HPI
- 209.2698
- Rent YoY
- —
- Metro
- Muskegon, MI
- State GDP YoY
- ▲ 1.37%
- F500 in state
- 28
Industry mix (Fortune 500 HQ in MI)
| Industry | F500 HQs | Revenue |
|---|---|---|
| Automotive Parts | 3 | $48B |
|
||
| Automotive | 2 | $372B |
|
||
| Chemicals | 1 | $45B |
|
||
| Automotive Retail | 1 | $29B |
|
||
| Healthcare / Medical Devices | 1 | $23B |
|
||
| Automotive Technology | 1 | $20B |
|
||
Price history
+4.0% since first listed53 events — show timeline
- 2026-04-10 Relisted — MiRealSource-MiMLS
- 2026-04-09 Listing Removed — MiRealSource-MiMLS
- 2026-04-03 Listed $77,900 REALCOMP
- 2026-04-03 Listed $77,900 SW Michigan MLS
- 2026-04-03 Listed $77,900 MiRealSource-MiMLS
- 2026-02-04 Listing Removed — MiRealSource-MiMLS
- 2026-02-03 Listing Removed — REALCOMP
- 2025-09-22 Listed $75,000 REALCOMP
- 2025-09-22 Listed $75,000 MiRealSource-MiMLS
- 2024-06-04 Sold (Public Records) $65,000 Public Records
- 2024-05-31 Sold (MLS) $65,000 MiRealSource-MiMLS
- 2024-05-31 Sold (MLS) $65,000 SW Michigan MLS
- 2024-05-31 Sold (MLS) $65,000 REALCOMP
- 2024-05-14 Pending — REALCOMP
- 2024-05-14 Pending — MiRealSource-MiMLS
- 2024-05-14 Pending — SW Michigan MLS
- 2024-04-25 Listed $54,900 MiRealSource-MiMLS
- 2024-04-25 Listed $54,900 SW Michigan MLS
- 2024-04-25 Listed $54,900 REALCOMP
- 2023-01-20 Sold (MLS) $40,000 SW Michigan MLS
- 2023-01-20 Sold (MLS) $40,000 REALCOMP
- 2023-01-16 Pending — REALCOMP
- 2023-01-16 Pending — MiRealSource-MiMLS
- 2023-01-16 Pending — SW Michigan MLS
- 2023-01-06 Price Changed $49,999 MiRealSource-MiMLS
- 2023-01-05 Price Changed $49,999 REALCOMP
- 2023-01-05 Price Changed $49,999 SW Michigan MLS
- 2022-11-12 Price Changed $55,000 MiRealSource-MiMLS
- 2022-11-12 Price Changed $55,000 REALCOMP
- 2022-11-12 Price Changed $55,000 SW Michigan MLS
- 2022-11-04 Relisted — REALCOMP
- 2022-11-04 Relisted — MiRealSource-MiMLS
- 2022-11-04 Relisted — SW Michigan MLS
- 2022-10-26 Pending — MiRealSource-MiMLS
- 2022-10-26 Pending — REALCOMP
- 2022-10-26 Pending — SW Michigan MLS
- 2022-10-13 Relisted — MiRealSource-MiMLS
- 2022-10-13 Relisted — REALCOMP
- 2022-10-13 Relisted — SW Michigan MLS
- 2022-09-13 Pending — REALCOMP
- 2022-09-13 Pending — SW Michigan MLS
- 2022-09-13 Listing Removed — MiRealSource-MiMLS
- 2022-09-12 Price Changed $59,900 REALCOMP
- 2022-09-12 Price Changed $59,900 SW Michigan MLS
- 2022-08-26 Relisted — SW Michigan MLS
- 2022-08-26 Relisted — REALCOMP
- 2022-08-21 Pending — REALCOMP
- 2022-08-21 Pending — SW Michigan MLS
- 2022-08-03 Price Changed $69,900 REALCOMP
- 2022-08-03 Price Changed $69,900 SW Michigan MLS
- 2022-07-28 Listed $59,900 MiRealSource-MiMLS
- 2022-07-28 Listed $74,900 SW Michigan MLS
- 2022-07-28 Listed $74,900 REALCOMP
Property tax history
+3.8%/yrLatest (2025): $1,288 · +29.5% YoY. Source: county tax records.
Cash-flow waterfall
monthlySold comps — $/sqft
last 12 mo · ≤1 miLoading sold comps…