 🏷️ Likely Rental
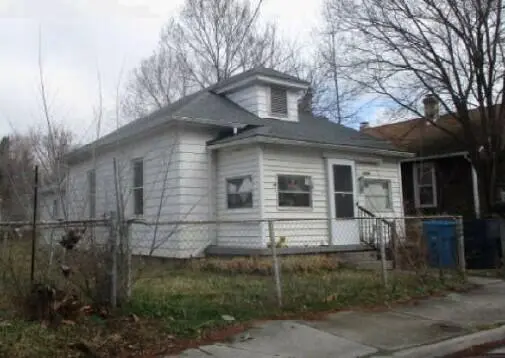
1334 Morton Ave SE · Roanoke, VA
Flood risk 4/10 · Minor
- FEMA flood zone
- X (unshaded)
- Chance of flooding over 30 yrs
- 0.24%
- Est. flood insurance / yr
- $507 – $1,088
Fire risk 3/10 · Minor
- Est. fire insurance / yr
- $666 – $1,236
Heat risk 5/10 · Moderate
- Hot days now (above 102°F)
- 7 days/yr
- Hot days in 30 yrs
- 19 days/yr
Wind risk 2/10 · Minimal
- Chance of severe wind over 30 yrs
- 1.0%
Air-quality risk 2/10 · Minimal
- Unhealthy air days now
- 1 days/yr
- Unhealthy air days in 30 yrs
- 1 days/yr
Risk factors via First Street. Map © Google.
Why this score? — see what drove the B grade
The composite is a weighted blend of 9 inputs, each scored 0–100. Each bar is that input's sub-score; the figure is the points it added to the 100-point composite (weight × sub-score).
- Cash flow +26.4/30.0
- ARV discount +15.0/15.0
- DSCR +9.0/10.0
- 1% rule +7.1/10.0
- Schools +4.1/10.0
- Livability +3.7/5.0
- Rent growth +2.5/5.0
- Condition / age +2.5/5.0
- Appreciation +0.0/10.0
$94,300
🖨 Deal sheet 📄 Offer letter ✓ Due diligence
Listing remarks MLS
This house has great potential for investment property! Large fenced lot. One parking spot in front with potential parking in the back. New refrigerator and stove. Refinished hardwood and new LVP flooring. Front flower bed is currently growing mint - perfect for cooking or adding to a delicious drink. Property is being sold AS-IS. Currently vacant, but was being rented for $1,000/month.
Key facts
- 4,356 sq ft lot
- Built 1900
- Listed 44 days
Property features AI
Exterior
- Home design: Residential property; Built in 1900
- Construction: Original construction from 1900
- Exterior features: 0.1 acre lot (approximately 4,356 sq ft)
Interior
- Bedrooms: 2 bedrooms (both on the main level)
- Bathrooms: 1 full bathroom (on the main level)
- Heating & cooling: Baseboard electric heating
- Interior features: Crawl space basement
Neighborhood map
What this means for you Summary
Snapshot
- This is a 1-bed/1.0-bath single-family listed at $94k.
Deal economics
- At list price, monthly cash flow is $247 ($3k/yr) — positive.
- The deal already cash-flows at list — no discount required.
- Meets the 1% rule at list price ($1k rent vs $94k).
- Recommended offer: $91k (3.0% below list) — sets the bar for market timing.
- Cap rate 9.4% vs local median 4.2% in Roanoke — top-decile yield for the area; either an underpriced asset or a hidden risk that comps aren't pricing in. Stress-test before assuming the spread holds.
Location & tenants
- Location reads 73/100 on livability (#163 in VA) — a middle-class / working-renter tenant base. Strengths: cost of living A+, health & safety A+, housing A; Watch: amenities C-, employment D, crime F.
- Roanoke City Public School District (urban): math 40% / reading 58% proficiency, ranked #102 of 131 in VA (top 78%) — families likely to look elsewhere, expect single-tenant / working-renter base with shorter leases; 67% free/reduced lunch — lower-income household profile, screen leases tightly.
- Zoned schools: Fallon Park Elementary (math 33% / reading 42%, grade F, #931 of 1,108 statewide, top 84%, 533 students, 99% FRL); John P. Fishwick Middle (math 33% / reading 60%, grade D+, #264 of 342 statewide, top 77%, 501 students, 98% FRL); Patrick Henry High (math 57% / reading 77%, grade B, #185 of 319 statewide, top 61%, 2,005 students, 95% FRL) — zoned schools average 97% FRL vs 67% district-wide (31 pts higher); higher-poverty schools than district average — tighter screening recommended.
- Market conditions: 77 active listings in the ZIP; 35 comparable units currently listed for rent nearby; rentals at typical pace (median 21d on market — plan ~3-4 weeks tenant-placement turnaround); 40% of comp listings sitting > 30 days — soft ceiling on asking rent; 113 units permitted in Roanoke city in 2024 (0 in 5+ unit buildings).
Forward outlook
- Local home prices are declining (-3.0%/yr); year-one equity from $652 of loan paydown is wiped out by about $3k of value loss. Plan a longer hold.
- Roanoke County population projected at +11% by 2050 — modest demand growth; plan on rents tracking national, not racing it.
- At projected returns (-3.0% appreciation + 3.0% rent growth), your $26k cash investment doubles in ~10 years — after that, you're playing with house money.
Negotiation context
- It's been on market 44 days — a 3% lower offer ($91k) is reasonable based on typical stale-listing flexibility.
- 7 sale attempts since 19y ago with the ask held roughly flat each time — persistent listings suggest the price (not the market) is what's stuck; bring a comps-based counter.
Risks & watch-outs
- Watch-outs: built in 1900 — expect roof / HVAC / electrical / plumbing capex.
- Climate carrying-cost: extreme-heat days projected 7→19/yr by 2055 (HVAC capex compounding) — expect insurance premiums to compound above CPI over the hold.
Questions for the listing agent
- It's been on market 44 days. Have you received any prior offers? Is the seller open to a 3% concession, seller financing, or rate buy-down credit?
- Built in 1900 — when were the roof, HVAC, electrical panel, plumbing, and water heater last replaced?
- Is there a deadline driving the sale (1031 exchange, divorce, estate, relocation)? That informs how much negotiation room exists.
- Schools are A-rated — typically a magnet for longer-tenancy family renters. What's the average tenant stay here, and is there a school-zone premium baked into asking?
- Crime grade is F in this area — have there been break-ins, vandalism, or insurance claims at this property in the last 3 years? What carrier currently insures it and at what premium?
- What's the average days-on-market for RENTAL listings here right now (not sales)? A rising rental-DOM trend means longer vacancies and softer asking-rent achievability than the comps imply.
- What's the recent tenant-quality profile in this submarket — average credit score on applications, eviction rate, late-payment / NSF rate, and stable-employment percentage? A property-management company in the area should have these aggregated.
- How much new for-sale + rental construction is in the pipeline within 1–3 miles? Heavy new supply typically softens prices + rents 12–24 months out; constrained supply supports both.
Investment metrics
- 1% rule
- 1.21% ✓
- Cap rate
- 9.43%
- Cash-on-cash
- 11.21%
- DSCR
- 1.50
- GRM
- 6.9
CMA / ARV
- ARV (median comp)
- $152,966
- List price
- $94,300
- Delta
- -38.35%
- Verdict
- UNDERPRICED
- Comps
- 20 within 1.0 mi
Show comp detail 12 sales within ~0.75 mi
| Address | Dist | Beds/Ba | Sqft | Sold | Price | $/sf | Match |
|---|---|---|---|---|---|---|---|
| 1507 Gladstone Ave SE | 0.16mi | 2/1.0 (+1) | 918 (+3%) | 3mo | $149,000 | $162 | 80 |
| 1465 Greenbrier Ave SE | 0.26mi | 2/1.0 (+1) | 857 (-4%) | 10mo | $153,333 | $179 | 67 |
| 1318 Dale Ave SE | 0.32mi | 2/1.0 (+1) | 856 (-4%) | 8mo | $70,000 | $82 | 66 |
| 1241 Dale Ave SE | 0.31mi | 2/1.0 (+1) | 844 (-6%) | 8mo | $102,000 | $121 | 64 |
| 1412 9th St SE | 0.58mi | 2/1.0 (+1) | 892 (-0%) | 9mo | $75,100 | $84 | 61 |
| 2228 Eastland Ave SE | 0.68mi | 2/1.0 (+1) | 915 (+2%) | 1mo | $190,100 | $208 | 58 |
| 1521 Church Ave SE | 0.47mi | 2/1.0 (+1) | 810 (-9%) | 9mo | $140,000 | $173 | 50 |
| 1554 Riverdale Rd SE | 0.73mi | 2/1.0 (+1) | 837 (-6%) | 10mo | $175,000 | $209 | 42 |
| 1919 Clinton Ave SE | 0.43mi | 2/1.0 (+1) | 1,020 (+14%) | 11mo | $80,000 | $78 | 42 |
| 1542 Langhorne St SE | 0.43mi | 2/1.0 (+1) | 1,018 (+14%) | 14mo | $155,000 | $152 | 40 |
| 670 Morrill Ave SE | 0.73mi | 2/1.0 (+1) | 774 (-13%) | 2mo | $109,000 | $141 | 37 |
| 126 10 1/2 St SE | 0.61mi | 2/1.0 (+1) | 791 (-11%) | 14mo | $110,000 | $139 | 36 |
Match score weights: distance 35% · size 25% · config 20% · recency 20%. Top-matched comps best support the ARV.
Projected returns pro-forma
-3.0% appreciation · 3.0% rent growth · sell at horizon
- IRR
- 0.4%
- Equity multiple
- 1.02×
- Total profit
- $449
- Equity at exit
- $14,060
- IRR
- 10.1%
- Equity multiple
- 1.78×
- Total profit
- $20,692
- Equity at exit
- $8,153
Cash invested: $26,404 (down + closing). Projections, not guarantees.
Landlord ↔ Tenant lean methodology
- Overall (STATE)
- 55 Moderately Landlord-Leaning
- State Virginia
- 55 Moderately Landlord-Leaning · D+2
- County
- — inherits STATE
- City
- — inherits STATE
ZIP-level market 24013
- Home prices YoY
- -18.0%
- Active inventory
- 77
- Price-to-rent
- 6.9×
Monthly cashflow live
- Estimated rent
- $1,137 high interval (Pro) →
- Mortgage (P&I)
- −$495
- Tax from tax record
- −$117 /mo · $1,409/yr
- Insurance
- −$39
- HOA
- −$0
- Vacancy / Maint / Mgmt
- −$239
- Net cashflow
- $247
Break-even live
UW: 25.0% down · 7.5% · 30yr · 1.5% tax · 5.0% vac · 8.0% maint · 8.0% mgmt
Financing live
Cash to close
- Down payment
- $23,575
- Closing costs
- $2,829
- Reserves months
- —
- Total cash needed
- —
Loan-product check · same deal, 3 products live
Conventional
25% down · 7.5% · 30yr
- Down + closing
- —
- Monthly P&I
- —
- Monthly cashflow
- —
- DSCR
- —
- Eligible?
- —
Personal DTI + credit; lowest rate.
DSCR
20% down · 8.5% · 30yr
- Down + closing
- —
- Monthly P&I
- —
- Monthly cashflow
- —
- DSCR
- —
- Eligible?
- —
No personal income docs; deal must DSCR.
Hard money
10% down · 12.0% · 12mo
- Down + closing
- —
- Monthly P&I
- —
- Monthly cashflow
- —
- DSCR
- —
- Eligible?
- —
Short-term bridge; refi at stabilization.
Rent comps 35 comps
| Address | Beds | Baths | Sqft | Rent | $/sqft | DOM | Units | Dist |
|---|---|---|---|---|---|---|---|---|
| 922 12th St SE Unit A Roanoke, VA | 2.0 | 1.0 | 800 | $899 | $1.12 | 43d | 1 | 0.24mi |
| 1513 Morningside St SE Roanoke, VA | 2.0 | 1.0 | 900 | $1,200 | $1.33 | 13d | 1 | 0.38mi |
| 1605 Church Ave SE Roanoke, VA | 2.0 | 1.0 | 776 | $1,200 | $1.55 | 13d | 1 | 0.46mi |
| 950 Morgan Ave SE Roanoke, VA | 2.0 | 2.0 | 869 | $1,550 | $1.78 | 43d | 1 | 0.64mi |
| 1905 Wise Ave SE Roanoke, VA | 2.0 | 1.0 | 1044 | $1,123 | $1.08 | 13d | 1 | 0.64mi |
| 806 Stewart Ave SE Roanoke, VA | 1.0 | 1.0 | 651 | $875 | $1.34 | 21d | 1 | 0.67mi |
| 1816 Bennington St SE Roanoke, VA | 2.0 | 1.5 | 938 | $1,023 | $1.09 | 21d | 1 | 0.80mi |
| 601 Highland Ave SE Apt B Roanoke, VA | 2.0 | 1.0 | 617 | $975 | $1.58 | 21d | 1 | 0.83mi |
| 439 Cedar Bluff Ave SE Roanoke, VA | 2.0 | 1.0 | 716 | $2,350 | $3.28 | 13d | 1 | 0.98mi |
| 339 Cedar Ave Vinton, VA | 2.0 | 1.0 | 830 | $1,200 | $1.45 | 43d | 1 | 1.00mi |
| 220 8th St Vinton, VA | 2.0 | 1.0 | 850 | $1,199 | $1.41 | 13d | 1 | 1.04mi |
| 321 9th St #6 Vinton, VA | 1.0 | 1.0 | 546 | $696 | $1.27 | 43d | 1 | 1.08mi |
| 520 Riverland Rd SE Roanoke, VA | 2.0 | 1.0 | 948 | $1,500 | $1.58 | 43d | 1 | 1.09mi |
| 635 Riverland Rd SE Roanoke, VA | 2.0 | 1.0 | 905 | $1,250 | $1.38 | 13d | 1 | 1.11mi |
| 703 Riverland Rd SE Roanoke, VA | 2.0 | 1.0 | 1000 | $1,250 | $1.25 | 43d | 1 | 1.11mi |
| 420 Riverland Rd SE Roanoke, VA | 2.0 | 1.0 | 834 | $975 | $1.17 | 21d | 1 | 1.12mi |
| 1708 Baldwin Ave NE Unit A Roanoke, VA | 2.0 | 1.5 | 952 | $1,550 | $1.63 | 43d | 1 | 1.13mi |
| 16 Church Ave SW Unit 103 Roanoke, VA | — | 1.0 | 612 | $795 | $1.30 | 13d | 1 | 1.24mi |
| 1716 Rutrough Rd SE Roanoke, VA | 1.0–2.0 | 1.0 | 572 | $999 | $1.75 | 13d | 6 | 1.24mi |
| 1810 Rutrough Rd SE Roanoke, VA | 2.0 | 1.0 | 777 | $1,225 | $1.58 | 21d | 1 | 1.28mi |
| 1423 Varnell Ave NE Roanoke, VA | 2.0 | 1.0 | 720 | $1,650 | $2.29 | 13d | 1 | 1.33mi |
| 110 Campbell Ave SW Unit 203 Roanoke, VA | 1.0 | 1.0 | 780 | $1,045 | $1.34 | 43d | 1 | 1.34mi |
| 110 Campbell Ave SW Ste 206 Roanoke, VA | 1.0 | 1.0 | 750 | $1,300 | $1.73 | 43d | 1 | 1.34mi |
| 110 Campbell Ave SW Unit 205 Roanoke, VA | 1.0 | 1.0 | 800 | $1,250 | $1.56 | 43d | 1 | 1.34mi |
| 110 Campbell Ave SW Unit 303 Roanoke, VA | 1.0 | 1.0 | 780 | $1,350 | $1.73 | 21d | 1 | 1.34mi |
| 113 Norfolk Ave SW Unit 10 Roanoke, VA | 1.0 | 1.0 | 700 | $1,050 | $1.50 | 13d | 1 | 1.36mi |
| 113 Norfolk Ave SW Unit 12 Roanoke, VA | 1.0 | 1.0 | 700 | $1,050 | $1.50 | 21d | 1 | 1.36mi |
| 1824 Eastern Ave NE Roanoke, VA | 2.0 | 1.0 | 863 | $1,200 | $1.39 | 43d | 1 | 1.38mi |
| 1415 15th St NE Roanoke, VA | 1.0 | 1.0 | 566 | $995 | $1.76 | 13d | 1 | 1.40mi |
| 317 Jefferson Ave Vinton, VA | 2.0 | 1.0 | 980 | $1,525 | $1.56 | 43d | 1 | 1.41mi |
| 217 Mountain Ave SW Unit 217-2 Roanoke, VA | 2.0 | 1.0 | 700 | $945 | $1.35 | 43d | 1 | 1.42mi |
| 100 Highland Rd Vinton, VA | 1.0–2.0 | 1.0–2.0 | 665 | $1,025 | $1.54 | 13d | 1 | 1.42mi |
| 538 Chestnut St Vinton, VA | 1.0 | 1.0 | 675 | $950 | $1.41 | 13d | 1 | 1.43mi |
| 301 E Cleveland Ave Unit 1 Vinton, VA | 1.0 | 1.0 | 650 | $1,050 | $1.62 | 43d | 1 | 1.44mi |
| 410 Jefferson Ave Unit D Vinton, VA | 1.0 | 1.0 | 650 | $900 | $1.38 | 21d | 1 | 1.48mi |
Listing history 30 events
-
2026-06-18days on market $94,300 Active 44 DOM
-
2026-06-17days on market $94,300 Active 43 DOM
-
2026-06-16days on market $94,300 Active 42 DOM
-
2026-06-15days on market $94,300 Active 41 DOM
-
2026-06-14days on market $94,300 Active 39 DOM
-
2026-06-13days on market $94,300 Active 38 DOM
-
2026-06-10days on market $94,300 Active 36 DOM
-
2026-06-09days on market $94,300 Active 35 DOM
-
2026-06-08days on market $94,300 Active 34 DOM
-
2026-06-05days on market $94,300 Active 30 DOM
-
2026-06-03days on market $94,300 Active 29 DOM
-
2026-06-02days on market $94,300 Active 28 DOM
-
2026-06-01days on market $94,300 Active 27 DOM
-
2026-05-31days on market $94,300 Active 26 DOM
-
2026-05-30days on market $94,300 Active 25 DOM
-
2026-05-05$94,300 Active 414-char remark
-
2023-08-08soldstatus $109,950 Closed 390-char remark
Show marketing remark (390 chars)
This house has great potential for investment property! Large fenced lot. One parking spot in front with potential parking in the back. New refrigerator and stove. Refinished hardwood and new LVP flooring. Front flower bed is currently growing mint - perfect for cooking or adding to a delicious drink. Property is being sold AS-IS. Currently vacant, but was being rented for $1,000/month.
-
2023-07-10status Pending 390-char remark
Show marketing remark (390 chars)
This house has great potential for investment property! Large fenced lot. One parking spot in front with potential parking in the back. New refrigerator and stove. Refinished hardwood and new LVP flooring. Front flower bed is currently growing mint - perfect for cooking or adding to a delicious drink. Property is being sold AS-IS. Currently vacant, but was being rented for $1,000/month.
-
2023-07-07$109,950 Active 390-char remark
Show marketing remark (390 chars)
This house has great potential for investment property! Large fenced lot. One parking spot in front with potential parking in the back. New refrigerator and stove. Refinished hardwood and new LVP flooring. Front flower bed is currently growing mint - perfect for cooking or adding to a delicious drink. Property is being sold AS-IS. Currently vacant, but was being rented for $1,000/month.
-
2021-04-09soldstatus $180,000
-
2018-09-11soldstatus $37,000
Show marketing remark (161 chars)
This house has great potential for investment property! 3 Bedrooms, 1 Full Bath. Large fenced lot, potential parking in the back. Bring offers, seller motivated.
-
2018-06-25$42,000
Show marketing remark (161 chars)
This house has great potential for investment property! 3 Bedrooms, 1 Full Bath. Large fenced lot, potential parking in the back. Bring offers, seller motivated.
-
2010-05-25soldstatus $34,000
-
2010-03-25$34,950
-
2009-10-04historical
-
2009-06-26$38,500
-
2008-03-31historical
-
2008-01-10$55,000
-
2007-12-22historical
-
2007-06-22$59,950
ⓘ Source: listings_history table (triggers on properties + properties_extension) + one-shot
backfill from property_details.listing_events for pre-trigger history.
Tax reassessment forecast VA · Resets to sale price
- Current annual tax
- $1,409 · $117/mo
- Projected year-2 tax
- $1,409 · $117/mo
- Expected delta
- $0/yr ($0/mo · 0.0%)
ⓘ Screening estimate from a state-policy table — verify with the county assessor before closing.
Climate risk First Street
- Flood 4/10 Moderate FEMA zone X (unshaded) · 24% chance over 30 yrs
- Wildfire 3/10 Moderate
- Heat 5/10 Major 7 d/yr ≥102°F today · 19 d/yr by 30 yrs out
- Wind 2/10 Low 100% chance of damaging wind over 30 yrs
- Air quality 2/10 Low 1 unhealthy d/yr today · 1 by 30 yrs out
Nearby sold comps map
Loading sold comps map…
Walkable amenities ~0.75 mi
Loading nearby amenities…
Taxation est. · year 1
- Rental income
- $13,640
- − Mortgage interest
- −$5,282
- − Property taxes
- −$1,409
- − Insurance
- −$472
- − Repairs & maintenance
- −$1,091
- − Management
- −$1,091
- − Depreciation
- −$2,743
- Taxable income
- $1,551
- Est. tax owed @ 24.0%
- −$372
- After-tax cash flow
- $2,588/yr
For passive investors: Depreciation is non-cash, so a rental often shows a tax loss while cash-flowing — sheltering income. Rental losses are passive: they offset passive income freely, and up to $25,000/yr can offset ordinary (W-2) income if you actively participate and your MAGI is under $100k (phasing out to $0 by $150k); unused losses carry forward. On sale, claimed depreciation is recaptured at up to 25%, and gains may owe capital-gains tax (a 1031 exchange can defer both). Figures are a year-1 estimate at your 24.0% rate — not tax advice; consult a CPA.
Schools (NCES district)
- District
- Roanoke City Public School District
- NCES district ID
- 5103300
- Math proficiency
- 40% ▼ -38.00%
- Reading proficiency
- 58% ▼ -12.00%
- Median HH income
- $38,592
- Composite
- 40.8/100
- National rank
- #3639
- State rank
- #102 of 131 in VA
Livability — Roanoke
- Score
- 73/100
- State rank
- #163
- US rank
- #5055
Category grades
Schools grade is shown separately in the Schools card above.
Census & demographics
- Census place
- Roanoke, VA
- County
- Roanoke City · 101,625 people
- City population
- 168,930
- Metro
- Roanoke, VA
- Population (ZIP)
- 8,026
- Household income
- $51,290
- Rent vs Own
- Severe rent burden
- 345.0
Population outlook (Roanoke County) Hauer SSP2
- Today (2025)
- 106,094 people
- By 2030
- 108,927 · +2.7%
- By 2040
- 114,104 · +7.5%
- By 2050
- 118,032 · +11.3%
- By 2075
- 123,363 · +16.3%
- By 2100
- 116,827 · +10.1%
Race, ethnicity, and origin ACS 2023
- Neighborhood character
- Diverse neighborhood (Simpson 0.59)
- Race & ethnicity
- White 57% Black 29% Two or more races 9% Hispanic / Latino 7%
- Hispanic origin (detail)
- Mexican 4% Puerto Rican 1% Cuban 2%
- Common ancestry
- Slovak 2% Greek 1% German 1%
- Foreign-born
- 3% · Canada
- Languages at home
- 93% English-only · Spanish 6% Vietnamese 1%
Political lean MEDSL · Roanoke
- 2024 margin
- Strong D (+23.6) · D 61.1% · R 37.5% · Other 1.4%
- 2008→2024 swing
- +0.2pp no change · 2008: 23.4pp · 2024: 23.6pp
- All cycles
- 2024: D+23.6 2020: D+25.8 2016: D+17.6 2012: D+21.5 2008: D+23.4
Not yet ingested
- Civics
- —
Market trends
- HPI YoY
- ▼ -49.00%
- Current HPI
- 223.42
- Rent YoY
- —
- Metro
- Roanoke, VA
- State GDP YoY
- ▲ 2.40%
- F500 in state
- 50
Industry mix (Fortune 500 HQ in VA)
| Industry | F500 HQs | Revenue |
|---|---|---|
| Aerospace / Defense | 4 | $236B |
|
||
| Technology / Defense | 3 | $32B |
|
||
| Financial Services | 2 | $176B |
|
||
| Utilities | 2 | $27B |
|
||
| Insurance | 2 | $25B |
|
||
| Technology | 2 | $15B |
|
||
Price history
+57.3% since first listed15 events — show timeline
- 2026-05-05 Listed $94,300 MLSRV
- 2023-08-08 Sold (MLS) $109,950 MLSRV
- 2023-07-10 Pending — MLSRV
- 2023-07-07 Listed $109,950 MLSRV
- 2021-04-09 Sold (Public Records) $180,000 Public Records
- 2018-09-11 Sold (MLS) $37,000 MLSRV
- 2018-06-25 Listed $42,000 MLSRV
- 2010-05-25 Sold (MLS) $34,000 MLSRV
- 2010-03-25 Listed $34,950 MLSRV
- 2009-10-04 Listing Removed — MLSRV
- 2009-06-26 Listed $38,500 MLSRV
- 2008-03-31 Listing Removed — MLSRV
- 2008-01-10 Listed $55,000 MLSRV
- 2007-12-22 Listing Removed — MLSRV
- 2007-06-22 Listed $59,950 MLSRV
Property tax history
+12.6%/yrLatest (2025): $1,409 · +12.3% YoY. Source: county tax records.
Cash-flow waterfall
monthlySold comps — $/sqft
last 12 mo · ≤1 miLoading sold comps…