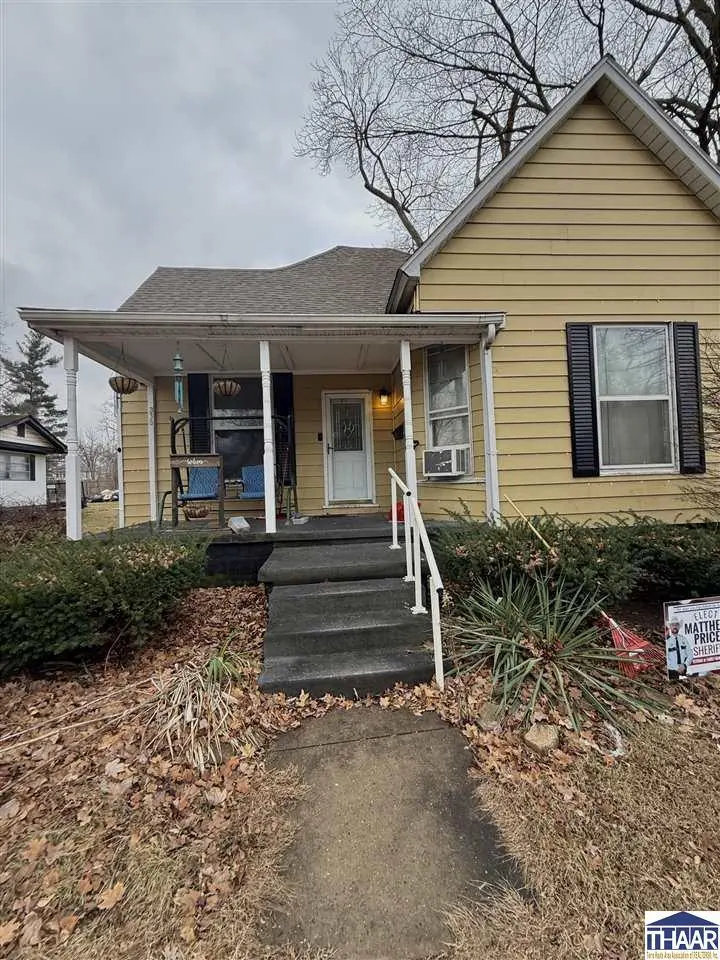
333 W Sylvandell St · Sullivan, IN
Flood risk 1/10 · Minimal
- FEMA flood zone
- —
- Chance of flooding over 30 yrs
- 0.0%
- Est. flood insurance / yr
- —
Fire risk 1/10 · Minimal
- Est. fire insurance / yr
- $717 – $1,331
Heat risk 4/10 · Minor
- Hot days now (above 105°F)
- 7 days/yr
- Hot days in 30 yrs
- 19 days/yr
Wind risk 2/10 · Minimal
- Chance of severe wind over 30 yrs
- 2.0%
Air-quality risk 2/10 · Minimal
- Unhealthy air days now
- 1 days/yr
- Unhealthy air days in 30 yrs
- 2 days/yr
Risk factors via First Street. Map © Google.
Why this score? — see what drove the C grade
The composite is a weighted blend of 9 inputs, each scored 0–100. Each bar is that input's sub-score; the figure is the points it added to the 100-point composite (weight × sub-score).
- Cash flow +19.1/30.0
- ARV discount +15.0/15.0
- DSCR +6.0/10.0
- 1% rule +5.1/10.0
- Schools +3.5/10.0
- Livability +3.5/5.0
- Rent growth +2.5/5.0
- Condition / age +2.5/5.0
- Appreciation +0.0/10.0
$99,000
🖨 Deal sheet 📄 Offer letter ✓ Due diligence
Listing remarks MLS
Versatile property offering excellent potential as a single-family residence or income-producing investment. This 3-bedroom, 3-bath home features 1,494 square feet of living space and is currently occupied as a single-family home, though it was previously configured as a duplex and can easily be converted back. The property is equipped with two water heaters and separately metered electric for the front and rear portions of the home—ideal for a duplex or rental setup. Situated on a . 28-acre lot, the home also includes a utility shed and a spacious living room area. A great opportunity for investors or buyers seeking flexibility and future income potential.
Key facts
- Utility shed
- Spacious living room
- 0.28 acre lot
Tags
Neighborhood map
What this means for you Summary
Snapshot
- This is a 3-bed/3.0-bath single-family listed at $99k.
Deal economics
- At list price, monthly cash flow is $105 ($1k/yr) — positive.
- The deal already cash-flows at list — no discount required.
- Meets the 1% rule at list price ($995 rent vs $99k).
- Recommended offer: $87k (12.0% below list) — sets the bar for market timing.
- Cap rate 7.6% vs local median 4.5% in Sullivan — top-decile yield for the area; either an underpriced asset or a hidden risk that comps aren't pricing in. Stress-test before assuming the spread holds.
Location & tenants
- Location reads 70/100 on livability (#167 in IN) — a middle-class / working-renter tenant base. Strengths: cost of living A+, housing A+, health & safety A+; Watch: schools D+, amenities F, commute F.
- Southwest School Corporation (rural): math 40% / reading 42% proficiency, ranked #137 of 301 in IN (top 46%) — families likely to look elsewhere, expect single-tenant / working-renter base with shorter leases.
- Market conditions: 79 active listings in the ZIP; 2 comparable units currently listed for rent nearby; 4 units permitted in Sullivan County in 2024 (0 in 5+ unit buildings).
Forward outlook
- Local home prices are declining (-3.0%/yr); year-one equity from $684 of loan paydown is wiped out by about $3k of value loss. Plan a longer hold.
- Sullivan County population projected at -12% by 2050 — secular population decline; favor cash flow + early exit over multi-decade hold.
Negotiation context
- It's been on market 163 days — a 12% lower offer ($87k) is reasonable based on typical stale-listing flexibility.
Risks & watch-outs
- Watch-outs: built in 1890 — expect roof / HVAC / electrical / plumbing capex.
Questions for the listing agent
- It's been on market 163 days. Have you received any prior offers? Is the seller open to a 12% concession, seller financing, or rate buy-down credit?
- Built in 1890 — when were the roof, HVAC, electrical panel, plumbing, and water heater last replaced?
- Why hasn't it sold? Are there any deal-killer items the seller is aware of (foundation, flood, title, zoning, code violations)?
- Is there a deadline driving the sale (1031 exchange, divorce, estate, relocation)? That informs how much negotiation room exists.
- Schools are D-rated, which usually means shorter tenancies and higher turnover. Who's the typical renter profile here, and what's been the actual vacancy rate?
- What's the average days-on-market for RENTAL listings here right now (not sales)? A rising rental-DOM trend means longer vacancies and softer asking-rent achievability than the comps imply.
- What's the recent tenant-quality profile in this submarket — average credit score on applications, eviction rate, late-payment / NSF rate, and stable-employment percentage? A property-management company in the area should have these aggregated.
- How much new for-sale + rental construction is in the pipeline within 1–3 miles? Heavy new supply typically softens prices + rents 12–24 months out; constrained supply supports both.
Investment metrics
- 1% rule
- 1.01% ✓
- Cap rate
- 7.57%
- Cash-on-cash
- 4.57%
- DSCR
- 1.20
- GRM
- 8.3
CMA / ARV
- ARV (median comp)
- $144,619
- List price
- $99,000
- Delta
- -31.54%
- Verdict
- UNDERPRICED
- Comps
- 20 within 1.0 mi
Show comp detail 12 sales within ~0.75 mi
| Address | Dist | Beds/Ba | Sqft | Sold | Price | $/sf | Match |
|---|---|---|---|---|---|---|---|
| 524 W Sylvandell St | 0.14mi | 3/2.0 | 1,485 (-1%) | 1mo | $219,900 | $148 | 88 |
| 326 W Graysville St | 0.45mi | 3/2.0 | 1,500 (+0%) | 5mo | $183,250 | $122 | 70 |
| 105 N French St | 0.31mi | 2/2.0 (-1) | 1,520 (+2%) | 4mo | $67,500 | $44 | 70 |
| 419 S Bell St St | 0.20mi | 3/2.0 | 1,363 (-9%) | 3mo | $230,000 | $169 | 70 |
| 319 E Wall St | 0.51mi | 4/2.5 (+1) | 1,505 (+1%) | 1mo | $284,490 | $189 | 67 |
| 318 E Washington St | 0.55mi | 4/2.5 (+1) | 1,505 (+1%) | 1mo | $284,490 | $189 | 65 |
| 210 N West St | 0.35mi | 2/2.0 (-1) | 1,413 (-5%) | 2mo | $89,900 | $64 | 64 |
| 320 E Washington St | 0.55mi | 3/2.0 | 1,426 (-5%) | 1mo | $269,599 | $189 | 62 |
| 339 N Broad St St | 0.62mi | 2/2.0 (-1) | 1,578 (+6%) | 0mo | $169,900 | $108 | 53 |
| 306 N State St St | 0.53mi | 2/1.0 (-1) | 1,421 (-5%) | 3mo | $154,900 | $109 | 52 |
| 324 S State St | 0.36mi | 3/1.0 | 1,713 (+15%) | 4mo | $133,500 | $78 | 47 |
| 562 S Court St St | 0.44mi | 2/1.0 (-1) | 1,288 (-14%) | 5mo | $135,000 | $105 | 40 |
Match score weights: distance 35% · size 25% · config 20% · recency 20%. Top-matched comps best support the ARV.
Projected returns pro-forma
-3.0% appreciation · 3.0% rent growth · sell at horizon
- IRR
- -9.2%
- Equity multiple
- 0.66×
- Total profit
- $-9,312
- Equity at exit
- $14,761
- IRR
- 0.3%
- Equity multiple
- 1.02×
- Total profit
- $593
- Equity at exit
- $8,560
Cash invested: $27,720 (down + closing). Projections, not guarantees.
Landlord ↔ Tenant lean methodology
- Overall (STATE)
- 90 Strongly Landlord-Friendly
- State Indiana
- 90 Strongly Landlord-Friendly · R+11
- County
- — inherits STATE
- City
- — inherits STATE
ZIP-level market 47882
- Home prices YoY
- -11.1%
- Active inventory
- 79
- Price-to-rent
- 8.3×
Monthly cashflow live
- Estimated rent
- $995 medium interval (Pro) →
- Mortgage (P&I)
- −$519
- Tax from tax record
- −$120 /mo · $1,442/yr
- Insurance
- −$41
- HOA
- −$0
- Vacancy / Maint / Mgmt
- −$209
- Net cashflow
- $105
Break-even live
UW: 25.0% down · 7.5% · 30yr · 1.5% tax · 5.0% vac · 8.0% maint · 8.0% mgmt
Financing live
Cash to close
- Down payment
- $24,750
- Closing costs
- $2,970
- Reserves months
- —
- Total cash needed
- —
Loan-product check · same deal, 3 products live
Conventional
25% down · 7.5% · 30yr
- Down + closing
- —
- Monthly P&I
- —
- Monthly cashflow
- —
- DSCR
- —
- Eligible?
- —
Personal DTI + credit; lowest rate.
DSCR
20% down · 8.5% · 30yr
- Down + closing
- —
- Monthly P&I
- —
- Monthly cashflow
- —
- DSCR
- —
- Eligible?
- —
No personal income docs; deal must DSCR.
Hard money
10% down · 12.0% · 12mo
- Down + closing
- —
- Monthly P&I
- —
- Monthly cashflow
- —
- DSCR
- —
- Eligible?
- —
Short-term bridge; refi at stabilization.
Rent comps 2 comps
| Address | Beds | Baths | Sqft | Rent | $/sqft | DOM | Units | Dist |
|---|---|---|---|---|---|---|---|---|
| 564 S Court St Sullivan, IN | 2.0 | 1.0 | 978 | $995 | $1.02 | 14d | 1 | 0.47mi |
| 564 S Court St Sullivan, IN | 2.0 | 1.0 | 978 | $995 | $1.02 | 12d | 1 | 0.47mi |
Listing history 19 events
-
2026-06-18days on market $99,000 Active 163 DOM
-
2026-06-17days on market $99,000 Active 162 DOM
-
2026-06-16days on market $99,000 Active 161 DOM
-
2026-06-15days on market $99,000 Active 160 DOM
-
2026-06-13days on market $99,000 Active 158 DOM
-
2026-06-12days on market $99,000 Active 157 DOM
-
2026-06-09days on market $99,000 Active 154 DOM
-
2026-06-08days on market $99,000 Active 153 DOM
-
2026-06-07days on market $99,000 Active 152 DOM
-
2026-06-07days on market $99,000 Active 151 DOM
-
2026-06-04days on market $99,000 Active 148 DOM
-
2026-06-02days on market $99,000 Active 147 DOM
-
2026-06-01days on market $99,000 Active 146 DOM
-
2026-05-31days on market $99,000 Active 145 DOM
-
2026-05-31days on market $99,000 Active 144 DOM
-
2026-05-19price $99,000 671-char remark
Show marketing remark (671 chars)
Versatile property offering excellent potential as a single-family residence or income-producing investment. This 3-bedroom, 3-bath home features 1,494 square feet of living space and is currently occupied as a single-family home, though it was previously configured as a duplex and can easily be converted back. The property is equipped with two water heaters and separately metered electric for the front and rear portions of the home—ideal for a duplex or rental setup. Situated on a . 28-acre lot, the home also includes a utility shed and a spacious living room area. A great opportunity for investors or buyers seeking flexibility and future income potential.
-
2026-04-29price $120,000 671-char remark
Show marketing remark (671 chars)
Versatile property offering excellent potential as a single-family residence or income-producing investment. This 3-bedroom, 3-bath home features 1,494 square feet of living space and is currently occupied as a single-family home, though it was previously configured as a duplex and can easily be converted back. The property is equipped with two water heaters and separately metered electric for the front and rear portions of the home—ideal for a duplex or rental setup. Situated on a . 28-acre lot, the home also includes a utility shed and a spacious living room area. A great opportunity for investors or buyers seeking flexibility and future income potential.
-
2026-02-22price $145,000 671-char remark
Show marketing remark (671 chars)
Versatile property offering excellent potential as a single-family residence or income-producing investment. This 3-bedroom, 3-bath home features 1,494 square feet of living space and is currently occupied as a single-family home, though it was previously configured as a duplex and can easily be converted back. The property is equipped with two water heaters and separately metered electric for the front and rear portions of the home—ideal for a duplex or rental setup. Situated on a . 28-acre lot, the home also includes a utility shed and a spacious living room area. A great opportunity for investors or buyers seeking flexibility and future income potential.
-
2026-01-06$160,000 Active 671-char remark
Show marketing remark (671 chars)
Versatile property offering excellent potential as a single-family residence or income-producing investment. This 3-bedroom, 3-bath home features 1,494 square feet of living space and is currently occupied as a single-family home, though it was previously configured as a duplex and can easily be converted back. The property is equipped with two water heaters and separately metered electric for the front and rear portions of the home—ideal for a duplex or rental setup. Situated on a . 28-acre lot, the home also includes a utility shed and a spacious living room area. A great opportunity for investors or buyers seeking flexibility and future income potential.
ⓘ Source: listings_history table (triggers on properties + properties_extension) + one-shot
backfill from property_details.listing_events for pre-trigger history.
Tax reassessment forecast IN · Partial reset (capped growth)
- Current annual tax
- $1,442 · $120/mo
- Projected year-2 tax
- $1,442 · $120/mo
- Expected delta
- $0/yr ($0/mo · 0.0%)
ⓘ Screening estimate from a state-policy table — verify with the county assessor before closing.
Climate risk First Street
- Flood 1/10 Low 0% chance over 30 yrs
- Wildfire 1/10 Low
- Heat 4/10 Moderate 7 d/yr ≥105°F today · 19 d/yr by 30 yrs out
- Wind 2/10 Low 2% chance of damaging wind over 30 yrs
- Air quality 2/10 Low 1 unhealthy d/yr today · 2 by 30 yrs out
Nearby sold comps map
Loading sold comps map…
Walkable amenities ~0.75 mi
Loading nearby amenities…
Taxation est. · year 1
- Rental income
- $11,940
- − Mortgage interest
- −$5,546
- − Property taxes
- −$1,442
- − Insurance
- −$495
- − Repairs & maintenance
- −$955
- − Management
- −$955
- − Depreciation
- −$2,880
- Taxable loss
- −$333
- Est. tax savings @ 24.0%
- +$80
- After-tax cash flow
- $1,346/yr
For passive investors: Depreciation is non-cash, so a rental often shows a tax loss while cash-flowing — sheltering income. Rental losses are passive: they offset passive income freely, and up to $25,000/yr can offset ordinary (W-2) income if you actively participate and your MAGI is under $100k (phasing out to $0 by $150k); unused losses carry forward. On sale, claimed depreciation is recaptured at up to 25%, and gains may owe capital-gains tax (a 1031 exchange can defer both). Figures are a year-1 estimate at your 24.0% rate — not tax advice; consult a CPA.
Schools (NCES district)
- District
- Southwest School Corporation
- NCES district ID
- 1810860
- Math proficiency
- 40% ▼ -10.00%
- Reading proficiency
- 42% ▼ -9.00%
- Median HH income
- $43,624
- Composite
- 34.71/100
- National rank
- #5136
- State rank
- #137 of 301 in IN
Livability — Sullivan
- Score
- 70/100
- State rank
- #167
- US rank
- #7960
Category grades
Schools grade is shown separately in the Schools card above.
Census & demographics
- Census place
- Sullivan, IN
- City population
- 8,494
- Population (ZIP)
- 8,494
Population outlook (Sullivan County) Hauer SSP2
- Today (2025)
- 20,313 people
- By 2030
- 19,908 · -2.0%
- By 2040
- 19,009 · -6.4%
- By 2050
- 17,972 · -11.5%
- By 2075
- 14,929 · -26.5%
- By 2100
- 11,391 · -43.9%
Race, ethnicity, and origin ACS 2023
- Neighborhood character
- Predominantly White (95%)
- Race & ethnicity
- White 95% Two or more races 3%
- Common ancestry
- Italian 2% Slovak 2% Iranian 2%
- Foreign-born
- 1% · China
- Languages at home
- 99% English-only · Spanish 1%
Political lean MEDSL · Sullivan
- 2024 margin
- Solid R (+52.7) · D 22.8% · R 75.5% · Other 1.7%
- 2008→2024 swing
- -52.0pp toward R · 2008: -0.7pp · 2024: -52.7pp
- All cycles
- 2024: R+52.7 2020: R+50.5 2016: R+47.0 2012: R+20.6 2008: R+0.7
Not yet ingested
- Civics
- —
Market trends
- HPI YoY
- ▼ -23.79%
- Current HPI
- 190.5334
- Rent YoY
- —
- Metro
- —
- State GDP YoY
- ▲ 2.90%
- F500 in state
- 18
Industry mix (Fortune 500 HQ in IN)
| Industry | F500 HQs | Revenue |
|---|---|---|
| Industrial Machinery | 2 | $37B |
|
||
| Healthcare | 1 | $177B |
|
||
| Pharmaceuticals | 1 | $45B |
|
||
| Metals / Steel | 1 | $18B |
|
||
| Agriculture | 1 | $17B |
|
||
| Packaging | 1 | $12B |
|
||
Price history
-38.1% since first listed4 events — show timeline
- 2026-05-19 Price Changed $99,000 THAAR
- 2026-04-29 Price Changed $120,000 THAAR
- 2026-02-22 Price Changed $145,000 THAAR
- 2026-01-06 Listed $160,000 THAAR
Property tax history
+56.4%/yrLatest (2024): $1,442 · +56.4% YoY. Source: county tax records.
Cash-flow waterfall
monthlySold comps — $/sqft
last 12 mo · ≤1 miLoading sold comps…