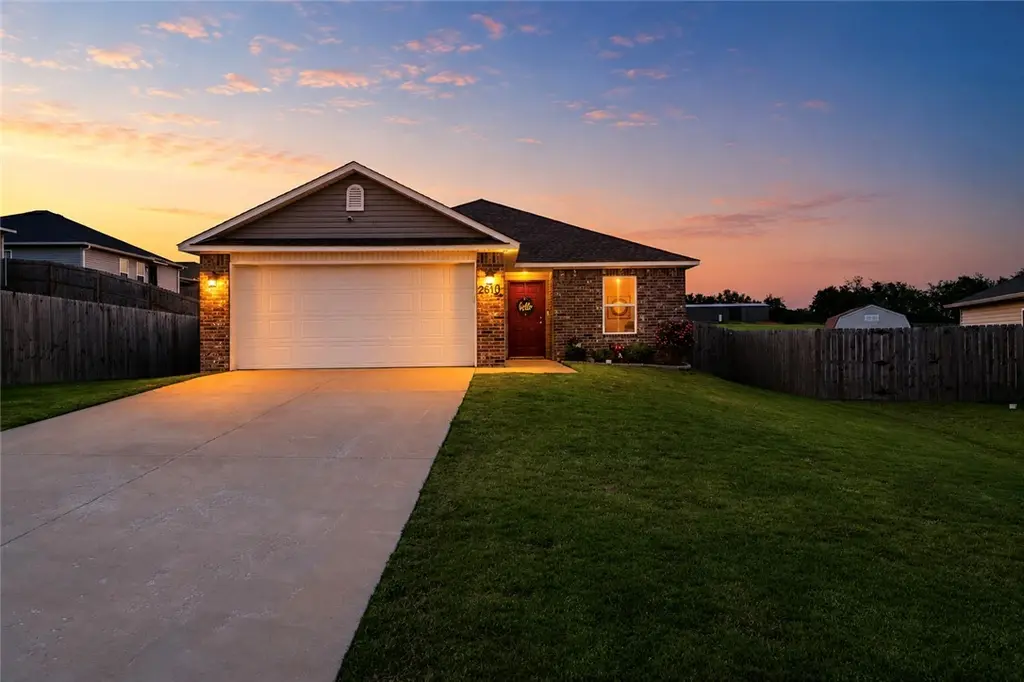
2610 Broken Spoke Ln · Prairie Grove, AR
Flood risk 1/10 · Minimal
- FEMA flood zone
- X (unshaded)
- Chance of flooding over 30 yrs
- 0.0%
- Est. flood insurance / yr
- $507 – $1,088
Fire risk 6/10 · Moderate
- Est. fire insurance / yr
- $1,499 – $2,785
Heat risk 5/10 · Moderate
- Hot days now (above 106°F)
- 7 days/yr
- Hot days in 30 yrs
- 19 days/yr
Wind risk 2/10 · Minimal
- Chance of severe wind over 30 yrs
- 2.0%
Air-quality risk 2/10 · Minimal
- Unhealthy air days now
- 1 days/yr
- Unhealthy air days in 30 yrs
- 1 days/yr
Risk factors via First Street. Map © Google.
Why this score? — see what drove the D- grade
The composite is a weighted blend of 9 inputs, each scored 0–100. Each bar is that input's sub-score; the figure is the points it added to the 100-point composite (weight × sub-score).
- Cash flow +12.0/30.0
- ARV discount +4.6/15.0
- Schools +3.6/10.0
- DSCR +3.5/10.0
- Livability +3.4/5.0
- Rent growth +2.9/5.0
- 1% rule +2.7/10.0
- Condition / age +2.5/5.0
- Appreciation +0.0/10.0
$255,000
🖨 Deal sheet (PDF) 📄 Offer letter ✓ Due diligence
Listing remarks
Welcome to 2610 Broken Spoke Lane in Farmington — a thoughtfully designed single-family home built in 2023, offering modern comfort in a peaceful cul-de-sac setting. This 1,216 square foot residence features three comfortable bedrooms and two full bathrooms, with tasteful upgrades throughout. The home showcases upgraded plumbing fixtures and modern lighting fixtures, adding both style and functionality to the interior spaces. Step outside to enjoy the large backyard and extended back patio — perfect for grilling, entertaining, or simply relaxing in a quiet neighborhood setting. With its combination of newer construction, quality upgrades, and inviting outdoor space, this home of
Key facts
- Large backyard
- Cul-de-sac setting
- Extended back patio
Tags
Property features AI
Finance
- HOA & community: Homeowners association (Casa OA) with annual fee of $295; HOA covers common areas, grounds maintenance, and structure maintenance; Community features: curbs, sidewalks, nearby shopping, park, near fire station and schools
Exterior
- Parking: Attached garage with garage door opener (1 covered space)
- Security: Security system; Smoke detectors
- Utilities: Public water; Public sewer; Electricity available; Cable available; Fiber optic available; Phone available
- Home design: Single-story; Faces south; Slab foundation
- Construction: Brick and vinyl siding exterior; Architectural shingle roof
- Exterior features: Concrete driveway; Covered patio; Partial wood privacy fencing in backyard; Landscaped lot; Located on a cul-de-sac; Near park; Sloped lot; City lot; Cleared
Interior
- Kitchen: Dishwasher; Electric range with self-cleaning oven; Microwave with hood fan; Disposal; Plumbed for ice maker; ENERGY STAR qualified appliances
- Flooring: Luxury vinyl plank
- Bathrooms: 2 full bathrooms
- Heating & cooling: Central heat and air; Electric heat; Heat pump; ENERGY STAR qualified equipment
- Interior features: Ceiling fans; Eat-in kitchen; Granite countertops; Pantry; Programmable thermostat; Window treatments (blinds, drapes)
- Laundry & utility: Electric water heater
Neighborhood map
What this means for you Summary
Snapshot
- This is a 3-bed/2.0-bath single-family listed at $255k.
Deal economics
- At list price, monthly cash flow is $-60 ($-723/yr) — negative.
- To cash-flow at today's rent, offer at most $244k (4.2% below list).
- To meet the 1% rule (rent ≥ 1% of price), the offer needs to be $195k (23.4% below list).
- Recommended offer: $195k (23.4% below list) — sets the bar for 1% rule.
- Cap rate 6.0% vs local median 3.6% in Prairie Grove — top-decile yield for the area; either an underpriced asset or a hidden risk that comps aren't pricing in. Stress-test before assuming the spread holds.
Location & tenants
- Location reads 67/100 on livability (#99 in AR) — a middle-class / working-renter tenant base. Strengths: crime A+, cost of living A+, housing A+; Watch: amenities F, commute F, health & safety F.
- Prairie Grove School District (town): math 43% / reading 39% proficiency, ranked #50 of 238 in AR (top 21%) — families likely to look elsewhere, expect single-tenant / working-renter base with shorter leases.
- Zoned schools: Prairie Grove Elem. School (math 52% / reading 38%, grade D-, #138 of 454 statewide, top 31%, 767 students, 37% FRL); Prairie Grove Middle School (math 53% / reading 36%, grade D, #61 of 201 statewide, top 32%, 512 students, 36% FRL); Prairie Grove High School (math 29% / reading 38%, grade F, #112 of 292 statewide, top 39%, 605 students, 33% FRL, charter) — zoned schools at 36% FRL track the district average.
- Market conditions: Rents rising (+1.8%/yr); 243 active listings in the ZIP; 4 comparable units currently listed for rent nearby; rentals lingering (median 46d on market — plan ~5-8 weeks vacancy on turnover, expect pricing pressure); 50% of comp listings sitting > 30 days — soft ceiling on asking rent; solid renter incomes; 3,494 units permitted in Washington County in 2024 (1,497 in 5+ unit buildings).
Forward outlook
- Local home prices are declining (-3.0%/yr); year-one equity from $2k of loan paydown is wiped out by about $8k of value loss. Plan a longer hold.
- Washington County population projected at +47% by 2050 — long-run rental-demand tailwind backs the buy-and-hold thesis.
Negotiation context
- Only 7 days on market — expect competitive offers; lowballing is unlikely to land.
Risks & watch-outs
- Climate carrying-cost: major wildfire risk; extreme-heat days projected 7→19/yr by 2055 (HVAC capex compounding) — expect insurance premiums to compound above CPI over the hold.
Questions for the listing agent
- What do current leases actually rent for vs. the listed asking? Can we see a recent rent roll and the last 12 months of T-12 income?
- What does the HOA fee cover, when was the last increase, and are there any pending special assessments or reserve-fund shortfalls?
- Is there a deadline driving the sale (1031 exchange, divorce, estate, relocation)? That informs how much negotiation room exists.
- The area grade is low — what's the realistic commute time and amenity access for the typical tenant pool here? Any planned neighborhood developments (good or bad) we should know about?
- What's the average days-on-market for RENTAL listings here right now (not sales)? A rising rental-DOM trend means longer vacancies and softer asking-rent achievability than the comps imply.
- What's the recent tenant-quality profile in this submarket — average credit score on applications, eviction rate, late-payment / NSF rate, and stable-employment percentage? A property-management company in the area should have these aggregated.
- How much new for-sale + rental construction is in the pipeline within 1–3 miles? Heavy new supply typically softens prices + rents 12–24 months out; constrained supply supports both.
Investment metrics
- 1% rule
- 0.77% ✗
- Cap rate
- 6.01%
- Cash-on-cash
- -1.01%
- DSCR
- 0.95
- GRM
- 10.9
CMA / ARV
- ARV (on-the-fly)
- $239,592
- Comps found
- 6
Show comp detail 6 sales within ~0.75 mi
| Address | Dist | Beds/Ba | Sqft | Sold | Price | $/sf | Match |
|---|---|---|---|---|---|---|---|
| 3440 Red Tail Way | 0.06mi | 3/2.0 | 1,209 (+1%) | 6mo | $245,000 | $203 | 90 |
| 3460 Red Tail Way | 0.07mi | 3/2.0 | 1,216 (+2%) | 4mo | $240,000 | $197 | 90 |
| 3451 Red Tail Way | 0.05mi | 3/2.0 | 1,242 (+4%) | 14mo | $250,000 | $201 | 79 |
| 3480 Red Tail | 0.09mi | 3/2.0 | 1,014 (-15%) | 2mo | $216,000 | $213 | 69 |
| 2890 Chip Shot Dr | 0.33mi | 3/2.0 | 1,323 (+11%) | 17mo | $262,700 | $199 | 52 |
| 2301 Bunker Ln | 0.43mi | 3/2.0 | 1,331 (+12%) | 22mo | $245,000 | $184 | 42 |
Match score weights: distance 35% · size 25% · config 20% · recency 20%. Top-matched comps best support the ARV.
Projected returns pro-forma
-3.0% appreciation · 1.75% rent growth · sell at horizon
- IRR
- -19.3%
- Equity multiple
- 0.33×
- Total profit
- $-47,651
- Equity at exit
- $38,021
- IRR
- -14.5%
- Equity multiple
- 0.21×
- Total profit
- $-56,420
- Equity at exit
- $22,048
Cash invested: $71,400 (down + closing). Projections, not guarantees.
Landlord ↔ Tenant lean methodology
- Overall (STATE)
- 92 Strongly Landlord-Friendly
- State Arkansas
- 92 Strongly Landlord-Friendly · R+14
- County
- — inherits STATE
- City
- — inherits STATE
ZIP-level market 72730
- Home prices YoY
- -13.1%
- Rents YoY
- 1.8%
- Active inventory
- 243
- Price-to-rent
- 10.9×
Monthly cashflow live
- Estimated rent
- $1,954 medium interval (Pro) →
- Mortgage (P&I)
- −$1,337
- Tax from tax record
- −$135 /mo · $1,622/yr
- Insurance
- −$106
- HOA
- −$25
- Lot rent
- −$0
- Vacancy / Maint / Mgmt
- −$410
- Net cashflow
- $-60
Break-even live
Sensitivity live
| Price | -10% $84 | -5% $12 | +0% $-60 | +5% $-132 | +10% $-205 |
|---|---|---|---|---|---|
| Rent | -10% $-215 | -5% $-137 | +0% $-60 | +5% $17 | +10% $94 |
| Rate | -1.0pp $68 | -0.5pp $5 | base $-60 | +0.5pp $-126 | +1.0pp $-194 |
UW: 25.0% down · 7.5% · 30yr · 1.5% tax · 5.0% vac · 8.0% maint · 8.0% mgmt
Financing live
Cash to close
- Down payment
- $63,750
- Closing costs
- $7,650
- Reserves months
- —
- Total cash needed
- —
Loan-product check · same deal, 3 products live
Conventional
25% down · 7.5% · 30yr
- Down + closing
- —
- Monthly P&I
- —
- Monthly cashflow
- —
- DSCR
- —
- Eligible?
- —
Personal DTI + credit; lowest rate.
DSCR
20% down · 8.5% · 30yr
- Down + closing
- —
- Monthly P&I
- —
- Monthly cashflow
- —
- DSCR
- —
- Eligible?
- —
No personal income docs; deal must DSCR.
Hard money
10% down · 12.0% · 12mo
- Down + closing
- —
- Monthly P&I
- —
- Monthly cashflow
- —
- DSCR
- —
- Eligible?
- —
Short-term bridge; refi at stabilization.
Rent comps 4 comps
| Address | Beds | Baths | Sqft | Rent | $/sqft | DOM | Units | Dist |
|---|---|---|---|---|---|---|---|---|
| 539 Colorado St Farmington, AR | 3.0 | 2.0 | 1470 | $1,890 | $1.29 | 46d | 1 | 0.87mi |
| 577 Nevada St Farmington, AR | 3.0 | 2.0 | 1470 | $1,750 | $1.19 | 26d | 1 | 0.88mi |
| 266 S Coventry Ave Farmington, AR | 3.0 | 2.0 | 1445 | $1,895 | $1.31 | 46d | 1 | 1.49mi |
| 266 S Coventry Ave Farmington, AR | 3.0 | 2.0 | 1404 | $1,895 | $1.35 | 16d | 1 | 1.49mi |
HOA detail
- Monthly dues
- $25 · $300/yr
Listing history 3 events
-
2026-05-31status $255,000 Pending 7 DOM
-
2026-05-31days on market $255,000 Active 7 DOM
-
2026-05-23$255,000 Active
ⓘ Source: listings_history table (triggers on properties + properties_extension) + one-shot
backfill from property_details.listing_events for pre-trigger history.
Tax reassessment forecast AR · Resets to sale price
- Current annual tax
- $1,622 · $135/mo
- Projected year-2 tax
- $1,632 · $136/mo
- Expected delta
- +$10/yr (+$1/mo · 0.6%)
ⓘ Screening estimate from a state-policy table — verify with the county assessor before closing.
Climate risk First Street
- Flood 1/10 Low FEMA zone X (unshaded) · 0% chance over 30 yrs
- Wildfire 6/10 Major
- Heat 5/10 Major 7 d/yr ≥106°F today · 19 d/yr by 30 yrs out
- Wind 2/10 Low 2% chance of damaging wind over 30 yrs
- Air quality 2/10 Low 1 unhealthy d/yr today · 1 by 30 yrs out
Nearby sold comps map
Loading sold comps map…
Walkable amenities ~0.75 mi
Loading nearby amenities…
Taxation est. · year 1
- Rental income
- $23,445
- − Mortgage interest
- −$14,284
- − Property taxes
- −$1,622
- − Insurance
- −$1,275
- − Repairs & maintenance
- −$1,876
- − Management
- −$1,876
- − HOA
- −$300
- − Depreciation
- −$7,418
- Taxable loss
- −$5,205
- Est. tax savings @ 24.0%
- +$1,249
- After-tax cash flow
- $527/yr
For passive investors: Depreciation is non-cash, so a rental often shows a tax loss while cash-flowing — sheltering income. Rental losses are passive: they offset passive income freely, and up to $25,000/yr can offset ordinary (W-2) income if you actively participate and your MAGI is under $100k (phasing out to $0 by $150k); unused losses carry forward. On sale, claimed depreciation is recaptured at up to 25%, and gains may owe capital-gains tax (a 1031 exchange can defer both). Figures are a year-1 estimate at your 24.0% rate — not tax advice; consult a CPA.
Schools (NCES district)
- District
- Prairie Grove School District
- NCES district ID
- 0511760
- Math proficiency
- 43% ▼ -13.00%
- Reading proficiency
- 39% ▼ -10.00%
- Median HH income
- $55,896
- Composite
- 35.91/100
- National rank
- #4808
- State rank
- #50 of 238 in AR
Livability — Prairie Grove
- Score
- 67/100
- State rank
- #99
- US rank
- #10475
Category grades
Schools grade is shown separately in the Schools card above.
Census & demographics
- Census place
- Prairie Grove, AR
- County
- Washington County · 252,056 people
- City population
- 10,744
- Metro
- Fayetteville-Springdale-Rogers, AR
- Population (ZIP)
- 11,570
- Household income
- $91,731
- Rent vs Own
- Severe rent burden
- 96.0
Population outlook (Washington County) Hauer SSP2
- Today (2025)
- 271,748 people
- By 2030
- 296,414 · +9.1%
- By 2040
- 346,874 · +27.6%
- By 2050
- 398,552 · +46.7%
- By 2075
- 523,309 · +92.6%
- By 2100
- 615,280 · +126.4%
Race, ethnicity, and origin ACS 2023
- Neighborhood character
- Predominantly White (77%)
- Race & ethnicity
- White 77% Two or more races 12% Hispanic / Latino 10% Black 2% Asian 1%
- Hispanic origin (detail)
- Mexican 8%
- Common ancestry
- Slovak 5% Italian 2% Lithuanian 2%
- Foreign-born
- 3% · Canada
- Languages at home
- 89% English-only · Spanish 11%
Political lean MEDSL · Washington
- 2024 margin
- Lean R (+6.7) · D 45.1% · R 51.7% · Other 3.2%
- 2008→2024 swing
- +6.4pp toward D · 2008: -13.1pp · 2024: -6.7pp
- All cycles
- 2024: R+6.7 2020: R+3.9 2016: R+10.4 2012: R+16.3 2008: R+13.1
Not yet ingested
- Civics
- —
Market trends
- HPI YoY
- ▼ -46.82%
- Current HPI
- 311.6229
- Rent YoY
- ▲ 1.75%
- Metro
- Fayetteville-Springdale-Rogers, AR
- State GDP YoY
- ▲ 3.80%
- F500 in state
- 10
Industry mix (Fortune 500 HQ in AR)
| Industry | F500 HQs | Revenue |
|---|---|---|
| Retail | 1 | $681B |
|
||
| Food / Agriculture | 1 | $53B |
|
||
| Retail / Energy | 1 | $22B |
|
||
| Transportation / Logistics | 1 | $12B |
|
||
| Energy | 1 | $4B |
|
||
Price history
1 event — show timeline
- 2026-05-23 Listed $255,000 NWARMLS
Property tax history
+97.5%/yrLatest (2025): $1,622 · -4.1% YoY. Source: county tax records.
Cash-flow waterfall
monthlySold comps — $/sqft
last 12 mo · ≤1 miLoading sold comps…