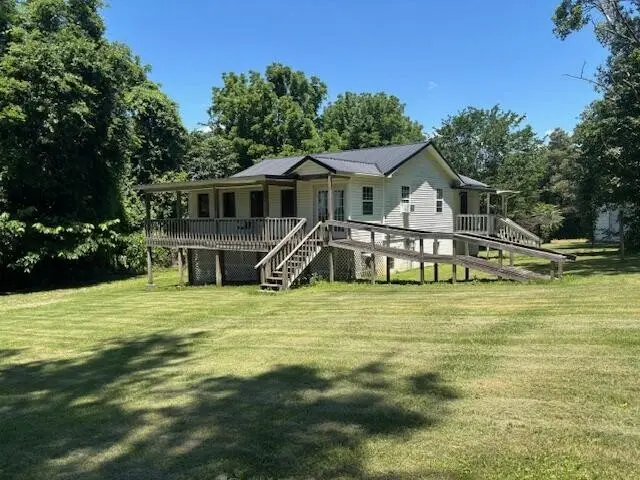
194 Patton Rd · Pikeville, TN
Flood risk 1/10 · Minimal
- FEMA flood zone
- X (unshaded)
- Chance of flooding over 30 yrs
- 0.0%
- Est. flood insurance / yr
- $507 – $1,088
Fire risk 5/10 · Moderate
- Est. fire insurance / yr
- $949 – $1,763
Heat risk 6/10 · Moderate
- Hot days now (above 103°F)
- 7 days/yr
- Hot days in 30 yrs
- 19 days/yr
Wind risk 4/10 · Minor
- Chance of severe wind over 30 yrs
- 9.0%
Air-quality risk 3/10 · Minor
- Unhealthy air days now
- 2 days/yr
- Unhealthy air days in 30 yrs
- 2 days/yr
Risk factors via First Street. Map © Google.
Why this score? — see what drove the C grade
The composite is a weighted blend of 9 inputs, each scored 0–100. Each bar is that input's sub-score; the figure is the points it added to the 100-point composite (weight × sub-score).
- Cash flow +25.2/30.0
- Appreciation +10.0/10.0
- DSCR +8.3/10.0
- 1% rule +5.3/10.0
- Livability +3.0/5.0
- Rent growth +2.5/5.0
- Condition / age +2.5/5.0
- Schools +1.9/10.0
- ARV discount +0.0/15.0
$229,000
🖨 Deal sheet 📄 Offer letter ✓ Due diligence
Listing remarks MLS
Country Living with Mountain Views, Yes sir we have it for you! Sit on your Big Covered Front Porch and enjoy the sound of the country living- You will probably see deer in your own back yard! We have 2 bedrooms with a additional room for office- Enclosed finished sun room in front of house- Central heat and air- New stove and refrigerator- 2 Car carport-You can make a two car garage in the basement if you wanted to or make a man cave/workshop. As it has utility water in the basement ''Approx. 750 Sq. Ft. Basement'' You have a detached garage ''Approx. 18x30'' with concrete floor. Area for storage- Older shed for storage-The house and the detached garage/shop has plenty of storage also! All this sits on Approx. 1.91 acres. We are pricing this property to Sell! ''Buyer to verify all information and measurements before making an informed offer''.
Key facts
- New stove and fridge
- Central heat and air
- Mountain views
Tags
Property features AI
Finance
- Financial info: $550 annual tax (provided)
Exterior
- Parking: 2 covered parking spaces; 2-car garage with garage door opener (garage faces side); Driveway
- Utilities: Public water; Septic tank; Electricity available; Water available
- Home design: Residential property; Three or more levels; Has view
- Construction: Frame construction with vinyl siding; Metal roof; Block foundation; Existing (year built details)
- Exterior features: Partial fencing; Storage structure; Level, cleared lot with views; Approximately 1.91 acres (agent calculated)
Interior
- Kitchen: Refrigerator; Cooktop
- Bedrooms: 2 bedrooms
- Flooring: Vinyl
- Bathrooms: 1 full bathroom
- Heating & cooling: Central heating (Electric and Propane); Central air (Electric)
- Interior features: Ceiling fan(s); Unfinished basement; Accessible approach with ramp; Windows with energy-efficient features
- Laundry & utility: Washer hookup; Electric dryer hookup; Block foundation
Neighborhood map
What this means for you Summary
Snapshot
- This is a 2-bed/1.0-bath single-family listed at $229k.
Deal economics
- At list price, monthly cash flow is $514 ($6k/yr) — positive.
- The deal already cash-flows at list — no discount required.
- Meets the 1% rule at list price ($2k rent vs $229k).
- Cap rate 9.0% vs local median 4.8% in Pikeville — top-decile yield for the area; either an underpriced asset or a hidden risk that comps aren't pricing in. Stress-test before assuming the spread holds.
Location & tenants
- Location reads 59/100 on livability (#296 in TN) — a working-class tenant base; expect higher turnover. Strengths: cost of living A+, crime A, housing B+; Watch: health & safety C-, amenities F, commute F.
- Bledsoe County (rural): math 19% / reading 27% proficiency, ranked #104 of 139 in TN (top 75%) — low school quality limits family demand, transient renter base, plan for 1-2y turnover; 69% free/reduced lunch — lower-income household profile, screen leases tightly.
- Zoned schools: Pikeville Elementary (math 27% / reading 32%, grade F, #423 of 952 statewide, top 48%, 415 students, 0% FRL); Bledsoe County High School (math 2% / reading 32%, grade F, #215 of 332 statewide, top 67%, 483 students, 0% FRL) — zoned schools average 0% FRL vs 69% district-wide (69 pts lower); this property's tenant base skews higher-income than the district average.
- Market conditions: 155 active listings in the ZIP.
- At $2,350/mo this rent would consume 52% of the median local household income ($55k/yr) — very limited rent-growth headroom before tenants either downsize or default.
Forward outlook
- In year one you build about $24k of equity ($2k loan paydown + $23k appreciation (10.0% local appreciation)).
- Bledsoe County population projected at +36% by 2050 — long-run rental-demand tailwind backs the buy-and-hold thesis.
- At projected returns (10.0% appreciation + 3.0% rent growth), your $64k cash investment doubles in ~2 years — after that, you're playing with house money.
- By year 2, paydown + projected appreciation supports a ~$39k cash-out refi (75% LTV) — recoverable capital for the next deal without selling this one.
Negotiation context
- Only 13 days on market — expect competitive offers; lowballing is unlikely to land.
- 4 sale attempts with the ask held roughly flat each time — persistent listings suggest the price (not the market) is what's stuck; bring a comps-based counter.
Risks & watch-outs
- Climate carrying-cost: moderate wildfire risk; extreme-heat days projected 7→19/yr by 2055 (HVAC capex compounding) — expect insurance premiums to compound above CPI over the hold.
Questions for the listing agent
- Is there a deadline driving the sale (1031 exchange, divorce, estate, relocation)? That informs how much negotiation room exists.
- Schools are F-rated, which usually means shorter tenancies and higher turnover. Who's the typical renter profile here, and what's been the actual vacancy rate?
- What's the average days-on-market for RENTAL listings here right now (not sales)? A rising rental-DOM trend means longer vacancies and softer asking-rent achievability than the comps imply.
- What's the recent tenant-quality profile in this submarket — average credit score on applications, eviction rate, late-payment / NSF rate, and stable-employment percentage? A property-management company in the area should have these aggregated.
- How much new for-sale + rental construction is in the pipeline within 1–3 miles? Heavy new supply typically softens prices + rents 12–24 months out; constrained supply supports both.
Investment metrics
- 1% rule
- 1.03% ✓
- Cap rate
- 8.99%
- Cash-on-cash
- 9.63%
- DSCR
- 1.43
- GRM
- 8.1
CMA / ARV
- ARV (on-the-fly)
- $186,496
- Comps found
- 1
Show comp detail 1 sale within ~0.75 mi
| Address | Dist | Beds/Ba | Sqft | Sold | Price | $/sf | Match |
|---|---|---|---|---|---|---|---|
| 164 Patton Ln | 0.04mi | 2/1.0 | 916 (-8%) | 14mo | $172,500 | $188 | 74 |
Match score weights: distance 35% · size 25% · config 20% · recency 20%. Top-matched comps best support the ARV.
Projected returns pro-forma
10.0% appreciation · 3.0% rent growth · sell at horizon
- IRR
- 31.3%
- Equity multiple
- 3.45×
- Total profit
- $157,375
- Equity at exit
- $206,301
- IRR
- 27.0%
- Equity multiple
- 7.82×
- Total profit
- $437,452
- Equity at exit
- $444,897
Cash invested: $64,120 (down + closing). Projections, not guarantees.
Landlord ↔ Tenant lean methodology
- Overall (STATE)
- 87 Strongly Landlord-Friendly
- State Tennessee
- 87 Strongly Landlord-Friendly · R+13
- County
- — inherits STATE
- City
- — inherits STATE
ZIP-level market 37367
- Home prices YoY
- 34.5%
- Active inventory
- 155
- Price-to-rent
- 8.1×
Monthly cashflow live
- Estimated rent
- $2,350 medium interval (Pro) →
- Mortgage (P&I)
- −$1,201
- Tax from tax record
- −$46 /mo · $550/yr
- Insurance
- −$95
- HOA
- −$0
- Vacancy / Maint / Mgmt
- −$494
- Net cashflow
- $514
Break-even live
UW: 25.0% down · 7.5% · 30yr · 1.5% tax · 5.0% vac · 8.0% maint · 8.0% mgmt
Financing live
Cash to close
- Down payment
- $57,250
- Closing costs
- $6,870
- Reserves months
- —
- Total cash needed
- —
Loan-product check · same deal, 3 products live
Conventional
25% down · 7.5% · 30yr
- Down + closing
- —
- Monthly P&I
- —
- Monthly cashflow
- —
- DSCR
- —
- Eligible?
- —
Personal DTI + credit; lowest rate.
DSCR
20% down · 8.5% · 30yr
- Down + closing
- —
- Monthly P&I
- —
- Monthly cashflow
- —
- DSCR
- —
- Eligible?
- —
No personal income docs; deal must DSCR.
Hard money
10% down · 12.0% · 12mo
- Down + closing
- —
- Monthly P&I
- —
- Monthly cashflow
- —
- DSCR
- —
- Eligible?
- —
Short-term bridge; refi at stabilization.
Listing history 10 events
-
2026-06-18days on market $229,000 Active 13 DOM
-
2026-06-17days on market $229,000 Active 12 DOM
-
2026-06-16days on market $229,000 Active 11 DOM
-
2026-06-15days on market $229,000 Active 10 DOM
-
2026-06-14days on market $229,000 Active 8 DOM
-
2026-06-10days on market $229,000 Active 5 DOM
-
2026-06-09days on market $229,000 Active 4 DOM
-
2026-06-08days on market $229,000 Active 3 DOM
-
2026-06-07remarks 699-char remark
-
2026-06-07$229,000 Active 2 DOM
ⓘ Source: listings_history table (triggers on properties + properties_extension) + one-shot
backfill from property_details.listing_events for pre-trigger history.
Tax reassessment forecast TN · Resets to sale price
- Current annual tax
- $550 · $46/mo
- Projected year-2 tax
- $1,626 · $135/mo
- Expected delta
- +$1,076/yr (+$90/mo · 195.6%)
ⓘ Screening estimate from a state-policy table — verify with the county assessor before closing.
Climate risk First Street
- Flood 1/10 Low FEMA zone X (unshaded) · 0% chance over 30 yrs
- Wildfire 5/10 Major
- Heat 6/10 Major 7 d/yr ≥103°F today · 19 d/yr by 30 yrs out
- Wind 4/10 Moderate 9% chance of damaging wind over 30 yrs
- Air quality 3/10 Moderate 2 unhealthy d/yr today · 2 by 30 yrs out
Nearby sold comps map
Loading sold comps map…
Walkable amenities ~0.75 mi
Loading nearby amenities…
Taxation est. · year 1
- Rental income
- $28,202
- − Mortgage interest
- −$12,828
- − Property taxes
- −$550
- − Insurance
- −$1,145
- − Repairs & maintenance
- −$2,256
- − Management
- −$2,256
- − Depreciation
- −$6,662
- Taxable income
- $2,505
- Est. tax owed @ 24.0%
- −$601
- After-tax cash flow
- $5,573/yr
For passive investors: Depreciation is non-cash, so a rental often shows a tax loss while cash-flowing — sheltering income. Rental losses are passive: they offset passive income freely, and up to $25,000/yr can offset ordinary (W-2) income if you actively participate and your MAGI is under $100k (phasing out to $0 by $150k); unused losses carry forward. On sale, claimed depreciation is recaptured at up to 25%, and gains may owe capital-gains tax (a 1031 exchange can defer both). Figures are a year-1 estimate at your 24.0% rate — not tax advice; consult a CPA.
Schools (NCES district)
- District
- Bledsoe County
- NCES district ID
- 4700270
- Math proficiency
- 19% ▼ -13.00%
- Reading proficiency
- 27% ▼ -1.00%
- Median HH income
- $35,901
- Composite
- 19.02/100
- National rank
- #8845
- State rank
- #104 of 139 in TN
Livability — Pikeville
- Score
- 59/100
- State rank
- #296
- US rank
- #20539
Category grades
Schools grade is shown separately in the Schools card above.
Census & demographics
- County
- Bledsoe · 11,736 people
- Population (ZIP)
- 11,736
- Household income
- $54,696
- Rent vs Own
- Severe rent burden
- 2.1
Population outlook (Bledsoe County) Hauer SSP2
- Today (2025)
- 18,085 people
- By 2030
- 19,649 · +8.6%
- By 2040
- 22,438 · +24.1%
- By 2050
- 24,582 · +35.9%
- By 2075
- 26,769 · +48.0%
- By 2100
- 25,033 · +38.4%
Race, ethnicity, and origin ACS 2023
- Neighborhood character
- Predominantly White (86%)
- Race & ethnicity
- White 86% Black 7% Two or more races 6% Hispanic / Latino 2%
- Common ancestry
- Italian 1% Slovak 1% Lithuanian 1%
- Foreign-born
- 2% · Canada
- Languages at home
- 97% English-only · German/W. Germanic 1% Spanish 1%
Political lean MEDSL · Bledsoe
- 2024 margin
- Solid R (+70.5) · D 14.4% · R 84.9%
- 2008→2024 swing
- -36.0pp toward R · 2008: -34.5pp · 2024: -70.5pp
- All cycles
- 2024: R+70.5 2020: R+65.2 2016: R+58.6 2012: R+40.3 2008: R+34.5
Not yet ingested
- Civics
- —
Market trends
- HPI YoY
- ▲ 106.44%
- Current HPI
- 415.344
- Rent YoY
- —
- Metro
- —
- State GDP YoY
- ▲ 2.78%
- F500 in state
- 22
Industry mix (Fortune 500 HQ in TN)
| Industry | F500 HQs | Revenue |
|---|---|---|
| Healthcare | 3 | $91B |
|
||
| Retail | 3 | $72B |
|
||
| Transportation / Logistics | 1 | $88B |
|
||
| Paper / Packaging | 1 | $19B |
|
||
| Insurance | 1 | $13B |
|
||
| Energy | 1 | $12B |
|
||
Price history
+0.0% since first listed4 events — show timeline
- 2026-06-05 Listed $229,000 REALTRACS as Distributed by MLS Grid
- 2026-06-05 Listed $229,000 REALTRACS as Distributed by MLS Grid
- 2026-06-05 Listed $229,000 GCAR
- 2026-06-05 Listed $229,000 Knoxville MLS
Property tax history
-1.7%/yrLatest (2025): $550 · +0.0% YoY. Source: county tax records.
Cash-flow waterfall
monthlySold comps — $/sqft
last 12 mo · ≤1 miLoading sold comps…