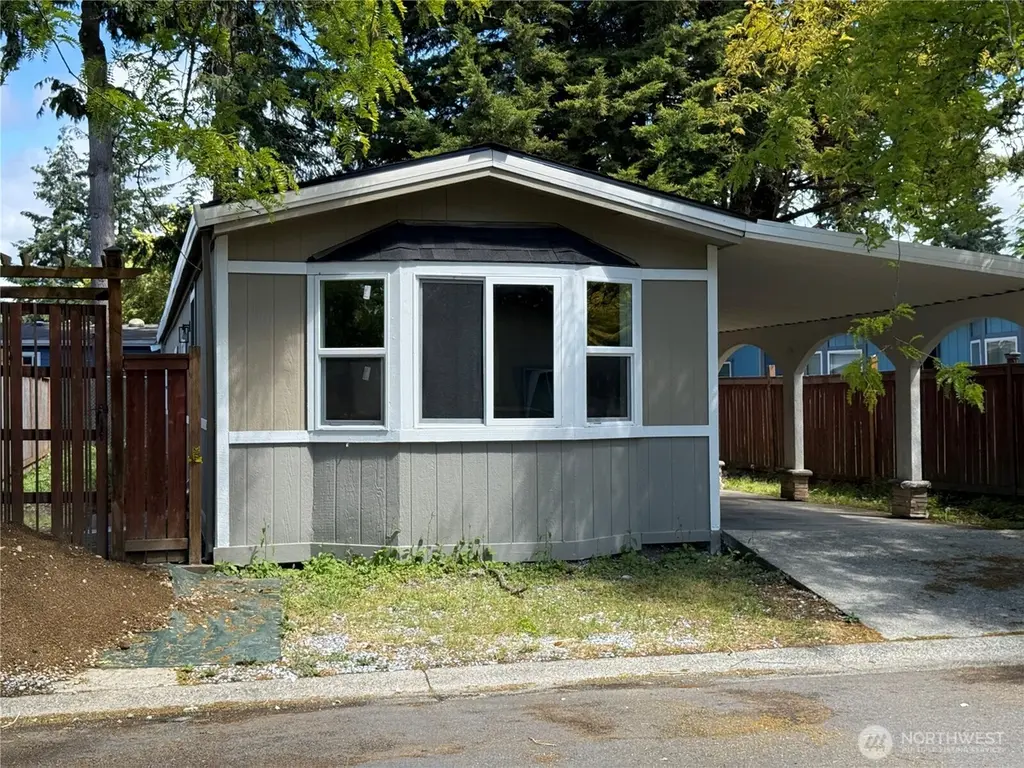
375 Union Ave SE #20 · Renton, WA
Flood risk 1/10 · Minimal
- FEMA flood zone
- X (unshaded)
- Chance of flooding over 30 yrs
- 0.0%
- Est. flood insurance / yr
- $507 – $1,088
Fire risk 1/10 · Minimal
- Est. fire insurance / yr
- $604 – $1,122
Heat risk 3/10 · Minor
- Hot days now (above 86°F)
- 7 days/yr
- Hot days in 30 yrs
- 15 days/yr
Wind risk 1/10 · Minimal
- Chance of severe wind over 30 yrs
- —
Air-quality risk 7/10 · Major
- Unhealthy air days now
- 10 days/yr
- Unhealthy air days in 30 yrs
- 11 days/yr
Risk factors via First Street. Map © Google.
Why this score? — see what drove the B- grade
The composite is a weighted blend of 9 inputs, each scored 0–100. Each bar is that input's sub-score; the figure is the points it added to the 100-point composite (weight × sub-score).
- Cash flow +30.0/30.0
- 1% rule +10.0/10.0
- DSCR +10.0/10.0
- Schools +4.7/10.0
- Livability +4.2/5.0
- Condition / age +4.0/5.0
- Rent growth +2.6/5.0
- ARV discount +0.0/15.0
- Appreciation +0.0/10.0
$162,000
🖨 Deal sheet 📄 Offer letter ✓ Due diligence
Listing remarks
Welcome to Sunnydale Mobile Home Park, a desirable all-ages community conveniently located in Renton. This beautifully updated, move-in ready manufactured home offers 3 bedrooms and 1 full bathroom, featuring extensive recent improvements including a new roof, fresh interior and exterior paint, new flooring throughout, and a fully remodeled bathroom. The open-concept layout maximizes space and functionality, creating a comfortable and inviting living environment. Additional features include covered parking for two vehicles and low-maintenance living. Space rent is $1,225.00/ Month. Conveniently located near shopping, dining, schools, and major commuter routes. Park approval is required for
Key facts
- New flooring
- Fresh interior paint
- Fresh exterior paint
Tags
Property features AI
Finance
- Other: Calculated living area: 924 square feet; Structure type: Manufactured house; One level
- Financial info: Listing terms: Cash; Annual tax information available (taxes not included per instructions)
- HOA & community: Park-approved sale in Sunnydale; Land lease: $1,225
Exterior
- Parking: Carport
- Utilities: Electric energy source; Public water; Public sewer (not explicitly listed but typical for park — excluded if you prefer only explicit entries)
- Home design: Manufactured home (single wide); Single story
- Construction: Manufactured after 06/15/1976; Manufacturer: CASMB, Model 6614; Mobile home remains on site
- Exterior features: Located in Sunnydale mobile home park with about 188 homes; Public water
Interior
- Bedrooms: 3 bedrooms
- Flooring: Laminate flooring
- Bathrooms: 1 full bathroom; 1 shower
- Heating & cooling: Heating present (see remarks); No cooling
- Interior features: Tankless water heater; Water heater located in hallway
Neighborhood map
What this means for you Summary
Snapshot
- This is a 3-bed/1.0-bath manufactured listed at $162k. Condition is rated good.
Deal economics
- At list price, monthly cash flow is $906 ($11k/yr) — positive.
- The deal already cash-flows at list — no discount required.
- Meets the 1% rule at list price ($3k rent vs $162k).
- Cap rate 13.0% vs local median 2.3% in Renton — top-decile yield for the area; either an underpriced asset or a hidden risk that comps aren't pricing in. Stress-test before assuming the spread holds.
Location & tenants
- Location reads 83/100 on livability (#52 in WA, #949 nationally) — a professional / high-income tenant draw. Strengths: amenities A+, commute A+, employment A+; Watch: crime D-, cost of living F.
- Renton School District (urban): math 47% / reading 55% proficiency, ranked #119 of 291 in WA (top 41%) — acceptable for families but not a draw, mixed tenant base, ~2y average lease.
- Market conditions: Rents flat; 255 active listings in the ZIP; 22 comparable units currently listed for rent nearby; rentals leasing fast (median 11d on market — plan ~1-2 weeks tenant-placement turnaround); high-income renter base; 10,555 units permitted in King County in 2024 (7,119 in 5+ unit buildings).
Forward outlook
- Local home prices are declining (-3.0%/yr); year-one equity from $1k of loan paydown is wiped out by about $5k of value loss. Plan a longer hold.
- King County population projected at +44% by 2050 — long-run rental-demand tailwind backs the buy-and-hold thesis.
- At projected returns (-3.0% appreciation + 0.3% rent growth), your $45k cash investment doubles in ~6 years — after that, you're playing with house money.
Negotiation context
- Only 7 days on market — expect competitive offers; lowballing is unlikely to land.
- 2 sale attempts since 26y ago with the ask held roughly flat each time — persistent listings suggest the price (not the market) is what's stuck; bring a comps-based counter.
- Current owner paid $31k; list at $162k implies a 423% gain — meaningful room to come down on a strong offer.
Questions for the listing agent
- Is there a deadline driving the sale (1031 exchange, divorce, estate, relocation)? That informs how much negotiation room exists.
- Schools are B-rated — typically a magnet for longer-tenancy family renters. What's the average tenant stay here, and is there a school-zone premium baked into asking?
- Crime grade is D in this area — have there been break-ins, vandalism, or insurance claims at this property in the last 3 years? What carrier currently insures it and at what premium?
- What's the average days-on-market for RENTAL listings here right now (not sales)? A rising rental-DOM trend means longer vacancies and softer asking-rent achievability than the comps imply.
- What's the recent tenant-quality profile in this submarket — average credit score on applications, eviction rate, late-payment / NSF rate, and stable-employment percentage? A property-management company in the area should have these aggregated.
- How much new for-sale + rental construction is in the pipeline within 1–3 miles? Heavy new supply typically softens prices + rents 12–24 months out; constrained supply supports both.
Investment metrics
- 1% rule
- 1.58% ✓
- Cap rate
- 13.00%
- Cash-on-cash
- 23.96%
- DSCR
- 2.07
- GRM
- 5.3
CMA / ARV
- ARV (on-the-fly)
- $115,500
- Comps found
- 6
Show comp detail 6 sales within ~0.75 mi
| Address | Dist | Beds/Ba | Sqft | Sold | Price | $/sf | Match |
|---|---|---|---|---|---|---|---|
| 375 Union Ave SE #46 | 0.01mi | 2/2.0 (-1) | 924 (0%) | 4mo | $120,000 | $130 | 88 |
| 375 Union Ave SE #60 | 0.01mi | 2/2.0 (-1) | 924 (0%) | 16mo | $149,000 | $161 | 77 |
| 201 Union Ave SE #43 | 0.25mi | 2/1.5 (-1) | 960 (+4%) | 1mo | $105,000 | $109 | 74 |
| 201 union Ave SE #46 | 0.25mi | 2/2.0 (-1) | 960 (+4%) | 4mo | $120,000 | $125 | 69 |
| 375 Union Ave SE #31 | 0.09mi | 2/2.0 (-1) | 924 (0%) | 22mo | $75,000 | $81 | 68 |
| 3612 NE 4th #18 | 0.65mi | 3/1.0 | 785 (-15%) | 22mo | $71,500 | $91 | 26 |
Match score weights: distance 35% · size 25% · config 20% · recency 20%. Top-matched comps best support the ARV.
Projected returns pro-forma
-3.0% appreciation · 0.29% rent growth · sell at horizon
- IRR
- 14.1%
- Equity multiple
- 1.54×
- Total profit
- $24,661
- Equity at exit
- $24,155
- IRR
- 20.7%
- Equity multiple
- 2.53×
- Total profit
- $69,450
- Equity at exit
- $14,007
Cash invested: $45,360 (down + closing). Projections, not guarantees.
Landlord ↔ Tenant lean methodology
- Overall (STATE)
- 28 Tenant-Leaning
- State Washington
- 28 Tenant-Leaning · D+8
- County
- — inherits STATE
- City
- — inherits STATE
ZIP-level market 98059
- Rents YoY
- 0.3%
- Active inventory
- 255
- Price-to-rent
- 5.3×
Monthly cashflow live
- Estimated rent
- $2,563 high interval (Pro) →
- Mortgage (P&I)
- −$850
- Tax est. 1.5%
- −$202 /mo · $2,430/yr
- Insurance
- −$68
- HOA
- −$0
- Vacancy / Maint / Mgmt
- −$538
- Net cashflow
- $906
Break-even live
UW: 25.0% down · 7.5% · 30yr · 1.5% tax · 5.0% vac · 8.0% maint · 8.0% mgmt
Financing live
Cash to close
- Down payment
- $40,500
- Closing costs
- $4,860
- Reserves months
- —
- Total cash needed
- —
Loan-product check · same deal, 3 products live
Conventional
25% down · 7.5% · 30yr
- Down + closing
- —
- Monthly P&I
- —
- Monthly cashflow
- —
- DSCR
- —
- Eligible?
- —
Personal DTI + credit; lowest rate.
DSCR
20% down · 8.5% · 30yr
- Down + closing
- —
- Monthly P&I
- —
- Monthly cashflow
- —
- DSCR
- —
- Eligible?
- —
No personal income docs; deal must DSCR.
Hard money
10% down · 12.0% · 12mo
- Down + closing
- —
- Monthly P&I
- —
- Monthly cashflow
- —
- DSCR
- —
- Eligible?
- —
Short-term bridge; refi at stabilization.
Rent comps 22 comps
| Address | Beds | Baths | Sqft | Rent | $/sqft | DOM | Units | Dist |
|---|---|---|---|---|---|---|---|---|
| 4214 SE 1st Pl Renton, WA | 3.0 | 1.0 | 950 | $2,950 | $3.11 | 24d | 1 | 0.29mi |
| 3815 NE 4th St Renton, WA | 2.0 | 1.0 | 666 | $2,199 | $3.30 | 2d | 22 | 0.53mi |
| 3788 NE 4th St Renton, WA | 1.0–2.0 | 1.0–2.0 | 701 | $1,904 | $2.72 | 1d | 8 | 0.71mi |
| 4231 NE 5th St Unit D203 Renton, WA | 2.0 | 2.0 | 1025 | $2,200 | $2.15 | 11d | 1 | 0.75mi |
| 2904 SE 8th St #2128 Renton, WA | 2.0 | 2.0 | 1046 | $2,450 | $2.34 | 43d | 1 | 0.80mi |
| 4415 NE 5th St Renton, WA | 1.0–3.0 | 1.0–2.0 | 923 | $3,044 | $3.30 | 1d | 10 | 0.85mi |
| 15205 140th Way SE Renton, WA | 1.0–3.0 | 1.0–2.0 | 1121 | $3,665 | $3.27 | 1d | 10 | 0.94mi |
| 650 Duvall Ave NE Renton, WA | 1.0–2.0 | 1.0–2.0 | 849 | $2,427 | $2.86 | 3d | 12 | 1.03mi |
| 2511 NE 4th St Renton, WA | 2.0 | 1.5 | 1008 | $1,900 | $1.88 | 2d | 1 | 1.05mi |
| 2307 NE 4th St Renton, WA | 1.0–2.0 | 1.0–2.0 | 740 | $2,259 | $3.05 | 1d | 14 | 1.08mi |
| 653 Index Pl NE Renton, WA | 2.0 | 1.0 | 720 | $2,395 | $3.33 | 24d | 1 | 1.11mi |
| 3507 NE 8th St Renton, WA | 3.0 | 1.0 | 960 | $2,650 | $2.76 | 18d | 1 | 1.14mi |
| 802 Harrington Ave NE Renton, WA | 2.0 | 1.0 | 828 | $1,750 | $2.11 | 3d | 1 | 1.26mi |
| 270 Bronson Way NE Unit The Hampton H22 Renton, WA | 2.0 | 1.0 | 1000 | $2,250 | $2.25 | 43d | 1 | 1.27mi |
| 330 Vuemont Pl NE Renton, WA | 2.0 | 1.0 | 791 | $1,962 | $2.48 | 5d | 7 | 1.31mi |
| 351 Vuemont Pl NE Renton, WA | 1.0–2.0 | 1.0–1.5 | 755 | $1,750 | $2.32 | 12d | 3 | 1.35mi |
| 950 Harrington Ave NE Renton, WA | 1.0–2.0 | 1.0–2.0 | 868 | $2,853 | $3.29 | 1d | 11 | 1.41mi |
| 913 Harrington Ave NE Renton, WA | 2.0 | 1.0 | 751 | $1,895 | $2.52 | 3d | 3 | 1.43mi |
| 913 Harrington Ave NE Apt 3 Renton, WA | 2.0 | 1.0 | 800 | $1,930 | $2.41 | 11d | 1 | 1.43mi |
| 913 Harrington Ave NE Unit 6 Renton, WA | 2.0 | 1.0 | 770 | $1,860 | $2.42 | 11d | 1 | 1.43mi |
| 906 Glennwood Ave NE Renton, WA | 2.0 | 1.0 | 850 | $1,595 | $1.88 | 24d | 1 | 1.44mi |
| 1013 Kirkland Ave NE Unit 3 Renton, WA | 2.0 | 1.5 | 700 | $1,750 | $2.50 | 24d | 1 | 1.46mi |
Listing history 7 events
-
2026-06-17status $162,000 Pending 7 DOM
-
2026-06-16days on market $162,000 Active 7 DOM
-
2026-06-15days on market $162,000 Active 6 DOM
-
2026-06-13days on market $162,000 Active 4 DOM
-
2026-06-13days on market $162,000 Active 3 DOM
-
2026-06-10remarks 699-char remark
-
2026-06-10$162,000 Active 1 DOM
ⓘ Source: listings_history table (triggers on properties + properties_extension) + one-shot
backfill from property_details.listing_events for pre-trigger history.
Climate risk First Street
- Flood 1/10 Low FEMA zone X (unshaded) · 0% chance over 30 yrs
- Wildfire 1/10 Low
- Heat 3/10 Moderate 7 d/yr ≥86°F today · 15 d/yr by 30 yrs out
- Wind 1/10 Low
- Air quality 7/10 Severe 10 unhealthy d/yr today · 11 by 30 yrs out
Nearby sold comps map
Loading sold comps map…
Walkable amenities ~0.75 mi
Loading nearby amenities…
Taxation est. · year 1
- Rental income
- $30,762
- − Mortgage interest
- −$9,075
- − Property taxes
- −$2,430
- − Insurance
- −$810
- − Repairs & maintenance
- −$2,461
- − Management
- −$2,461
- − Depreciation
- −$4,713
- Taxable income
- $8,813
- Est. tax owed @ 24.0%
- −$2,115
- After-tax cash flow
- $8,752/yr
For passive investors: Depreciation is non-cash, so a rental often shows a tax loss while cash-flowing — sheltering income. Rental losses are passive: they offset passive income freely, and up to $25,000/yr can offset ordinary (W-2) income if you actively participate and your MAGI is under $100k (phasing out to $0 by $150k); unused losses carry forward. On sale, claimed depreciation is recaptured at up to 25%, and gains may owe capital-gains tax (a 1031 exchange can defer both). Figures are a year-1 estimate at your 24.0% rate — not tax advice; consult a CPA.
Condition & rehab AI · 5 photos
This move-in ready manufactured home in Sunnydale Mobile Home Park is in excellent condition with recent updates, including a new roof, fresh paint, and new flooring. It offers a good investment opportunity with potential for further curb appeal improvements.
Value-add opportunities
- Both Landscaping improvements — Enhances curb appeal and property value
- Both Add a small garden bed near the front door — Improves curb appeal and adds aesthetic value
- Both Install a small outdoor light fixture — Enhances safety and curb appeal
Renovation cost estimate screening
Value-add ROI direction
- Both Landscaping improvements — Enhances curb appeal and property value ↑
- Both Add a small garden bed near the front door — Improves curb appeal and adds aesthetic value ↑
- Both Install a small outdoor light fixture — Enhances safety and curb appeal ↑
ⓘ Cost ranges are severity-bucket heuristics (US national rule-of-thumb). Get contractor quotes + a written scope before underwriting a rehab budget.
Schools (NCES district)
- District
- Renton School District
- NCES district ID
- 5307230
- Math proficiency
- 47% ▼ -1.00%
- Reading proficiency
- 55% ▼ -1.00%
- Median HH income
- $66,354
- Composite
- 47.13/100
- National rank
- #5108
- State rank
- #119 of 291 in WA
Livability — Renton
- Score
- 83/100
- State rank
- #52
- US rank
- #949
Category grades
Schools grade is shown separately in the Schools card above.
Census & demographics
- Census place
- Renton, WA
- County
- King County · 2,251,916 people
- City population
- 158,600
- Metro
- Seattle-Tacoma-Bellevue, WA
- Population (ZIP)
- 42,406
- Household income
- $138,654
- Rent vs Own
- Severe rent burden
- 908.0
Population outlook (King County) Hauer SSP2
- Today (2025)
- 2,576,485 people
- By 2030
- 2,803,316 · +8.8%
- By 2040
- 3,255,921 · +26.4%
- By 2050
- 3,706,444 · +43.9%
- By 2075
- 4,746,063 · +84.2%
- By 2100
- 5,407,730 · +109.9%
Race, ethnicity, and origin ACS 2023
- Neighborhood character
- Diverse neighborhood (Simpson 0.68)
- Race & ethnicity
- White 48% Asian 29% Two or more races 15% Hispanic / Latino 9% Black 2%
- Hispanic origin (detail)
- Mexican 5%
- Common ancestry
- Portuguese 3% Italian 3% Slovak 2%
- Foreign-born
- 23% · China, Vietnam, Canada
- Languages at home
- 67% English-only · Chinese 9% Vietnamese 6% Spanish 5%
Political lean MEDSL · King
- 2024 margin
- Solid D (+51.7) · D 74.2% · R 22.5% · Other 3.4%
- 2008→2024 swing
- +9.6pp toward D · 2008: 42.1pp · 2024: 51.7pp
- All cycles
- 2024: D+51.7 2020: D+52.7 2016: D+50.4 2012: D+39.9 2008: D+42.1
Not yet ingested
- Civics
- —
Market trends
- HPI YoY
- ▼ -920.66%
- Current HPI
- 338.4495
- Rent YoY
- ▲ 0.29%
- Metro
- Seattle-Tacoma-Bellevue, WA
- State GDP YoY
- ▲ 4.65%
- F500 in state
- 22
Industry mix (Fortune 500 HQ in WA)
| Industry | F500 HQs | Revenue |
|---|---|---|
| Retail | 2 | $269B |
|
||
| Technology / Retail | 1 | $638B |
|
||
| Technology | 1 | $245B |
|
||
| Telecommunications | 1 | $38B |
|
||
| Food / Beverage | 1 | $36B |
|
||
| Automotive / Trucks | 1 | $34B |
|
||
Price history
+414.3% since first listed3 events — show timeline
- 2026-06-09 Listed $162,000 NWMLS as Distributed by MLS Grid
- 2000-06-30 Sold (MLS) $31,000 NWMLS as Distributed by MLS Grid
- 2000-05-22 Listed $31,500 NWMLS as Distributed by MLS Grid
Cash-flow waterfall
monthlySold comps — $/sqft
last 12 mo · ≤1 miLoading sold comps…