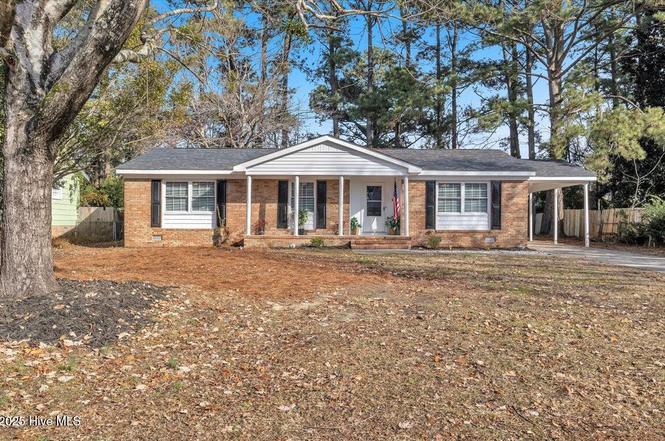
122 Carolina Cir · Jacksonville, NC
Flood risk 1/10 · Minimal
- FEMA flood zone
- X (unshaded)
- Chance of flooding over 30 yrs
- 0.0%
- Est. flood insurance / yr
- $507 – $1,088
Fire risk 3/10 · Minor
- Est. fire insurance / yr
- $906 – $1,684
Heat risk 9/10 · Severe
- Hot days now (above 106°F)
- 7 days/yr
- Hot days in 30 yrs
- 18 days/yr
Wind risk 8/10 · Major
- Chance of severe wind over 30 yrs
- 99.0%
Air-quality risk 3/10 · Minor
- Unhealthy air days now
- 2 days/yr
- Unhealthy air days in 30 yrs
- 4 days/yr
Risk factors via First Street. Map © Google.
Why this score? — see what drove the C- grade
The composite is a weighted blend of 9 inputs, each scored 0–100. Each bar is that input's sub-score; the figure is the points it added to the 100-point composite (weight × sub-score).
- ARV discount +14.9/15.0
- Cash flow +14.4/30.0
- DSCR +4.4/10.0
- Schools +3.9/10.0
- Livability +3.6/5.0
- Rent growth +3.5/5.0
- 1% rule +3.2/10.0
- Condition / age +2.5/5.0
- Appreciation +0.0/10.0
$264,000
🖨 Deal sheet (PDF) 📄 Offer letter ✓ Due diligence
Listing remarks
* * * SELLER NOW OFFERING $10,000 Closing Cost Assistance and a home warranty! * * * Welcome to 122 Carolina Circle in Jacksonville, NC, where modern updates meet peace of mind. This gorgeous 4 Bedroom home has been thoughtfully refreshed and is truly move-in ready for its new owners. Step inside to discover new LVP (Luxury Vinyl Plank) flooring throughout paired with a fresh, modern paint palette that creates a bright and inviting atmosphere. The updated kitchen shines with new stainless steel appliances, offering both style and functionality, while the renovated bathrooms feature tasteful finishes that add comfort and appeal. Major system upgrades provide exceptional value, including
Key facts
- Renovated bathrooms
- Updated kitchen
- New roof
Tags
Property features AI
Finance
- Other: Zoned RSF-7; Lot dimensions approximately 75 x 121 x 104 x 127 (0.23 acres); Subdivision: Brynn Marr
Exterior
- Parking: Covered carport (1 space)
- Utilities: Public water; Public sewer; Water and sewer connected
- Home design: Single-family residence; One story; Entry level: 1
- Construction: Brick veneer and frame construction
- Exterior features: Porch; Shingle roof; Has a view; Road frontage on city street and state road
Interior
- Kitchen: Refrigerator; Range; Dishwasher
- Bedrooms: Total rooms: 7
- Bathrooms: 2 full bathrooms
- Heating & cooling: Central air conditioning; Electric heating with heat pump
- Interior features: Window coverings; Crawl space basement
Neighborhood map
What this means for you Summary
Snapshot
- This is a 4-bed/2.0-bath single-family listed at $264k.
Deal economics
- At list price, monthly cash flow is $55 ($666/yr) — positive.
- The deal already cash-flows at list — no discount required.
- To meet the 1% rule (rent ≥ 1% of price), the offer needs to be $216k (18.1% below list).
- Recommended offer: $216k (18.1% below list) — sets the bar for 1% rule.
- Cap rate 6.5% vs local median 4.4% in Jacksonville — top-decile yield for the area; either an underpriced asset or a hidden risk that comps aren't pricing in. Stress-test before assuming the spread holds.
Location & tenants
- Location reads 71/100 on livability (#111 in NC) — a middle-class / working-renter tenant base. Strengths: cost of living A+, housing A+, health & safety A+; Watch: employment D, crime F, amenities F.
- Onslow County Schools (other): math 42% / reading 49% proficiency, ranked #84 of 178 in NC (top 47%) — families likely to look elsewhere, expect single-tenant / working-renter base with shorter leases.
- Zoned schools: Bell Fork Elementary (math 47% / reading 37%, grade F, #633 of 1,410 statewide, top 48%, 553 students, 71% FRL); Jacksonville Commons Middle (math 39% / reading 47%, grade D-, #191 of 475 statewide, top 41%, 1,011 students, 64% FRL); Jacksonville High (math 52% / reading 66%, grade C+, #233 of 535 statewide, top 44%, 1,423 students, 44% FRL) — zoned schools average 60% FRL vs 37% district-wide (23 pts higher); higher-poverty schools than district average — tighter screening recommended.
- Market conditions: Rents rising (+3.9%/yr); 612 active listings in the ZIP; 6 comparable units currently listed for rent nearby; rentals at typical pace (median 23d on market — plan ~3-4 weeks tenant-placement turnaround); 1,246 units permitted in Onslow County in 2024 (0 in 5+ unit buildings).
- This rent runs 41% of the median local income ($64k/yr) — at the standard rent-burdened threshold; future hikes will face affordability resistance.
Forward outlook
- Local home prices are declining (-3.0%/yr); year-one equity from $2k of loan paydown is wiped out by about $8k of value loss. Plan a longer hold.
Negotiation context
- It's been on market 93 days — a 9% lower offer ($240k) is reasonable based on typical stale-listing flexibility.
- 5 sale attempts since 14y ago; this cycle's ask has dropped $21k (7%) from the opening price — seller is motivated, your offer sets the floor, not the list.
- Current owner paid $140k; list at $264k implies a 89% gain — meaningful room to come down on a strong offer.
Risks & watch-outs
- Climate carrying-cost: severe wind risk, 99% chance of damaging wind over 30y; extreme-heat days projected 7→18/yr by 2055 (HVAC capex compounding) — expect insurance premiums to compound above CPI over the hold.
Questions for the listing agent
- It's been on market 93 days. Have you received any prior offers? Is the seller open to a 18% concession, seller financing, or rate buy-down credit?
- Built in 1974 — when were the roof, HVAC, electrical panel, plumbing, and water heater last replaced?
- Why hasn't it sold? Are there any deal-killer items the seller is aware of (foundation, flood, title, zoning, code violations)?
- Is there a deadline driving the sale (1031 exchange, divorce, estate, relocation)? That informs how much negotiation room exists.
- Crime grade is F in this area — have there been break-ins, vandalism, or insurance claims at this property in the last 3 years? What carrier currently insures it and at what premium?
- What's the average days-on-market for RENTAL listings here right now (not sales)? A rising rental-DOM trend means longer vacancies and softer asking-rent achievability than the comps imply.
- What's the recent tenant-quality profile in this submarket — average credit score on applications, eviction rate, late-payment / NSF rate, and stable-employment percentage? A property-management company in the area should have these aggregated.
- How much new for-sale + rental construction is in the pipeline within 1–3 miles? Heavy new supply typically softens prices + rents 12–24 months out; constrained supply supports both.
Investment metrics
- 1% rule
- 0.82% ✗
- Cap rate
- 6.55%
- Cash-on-cash
- 0.90%
- DSCR
- 1.04
- GRM
- 10.2
CMA / ARV
- ARV (on-the-fly)
- $315,756
- Comps found
- 12
Show comp detail 12 sales within ~0.75 mi
| Address | Dist | Beds/Ba | Sqft | Sold | Price | $/sf | Match |
|---|---|---|---|---|---|---|---|
| 111 Summercreek Dr | 0.48mi | 4/2.5 | 2,082 (-3%) | 5mo | $319,900 | $154 | 66 |
| 105 Ridgewood Ct | 0.40mi | 4/2.5 | 2,244 (+4%) | 12mo | $305,000 | $136 | 62 |
| 876 Pine Valley Rd | 0.61mi | 4/2.5 | 2,157 (+0%) | 10mo | $325,000 | $151 | 61 |
| 106 Baldwin Ct | 0.52mi | 4/3.0 | 2,180 (+2%) | 11mo | $320,000 | $147 | 60 |
| 407 Thomas Dr | 0.54mi | 4/2.5 | 2,225 (+4%) | 9mo | $316,500 | $142 | 60 |
| 502 Southbridge Dr | 0.43mi | 4/2.5 | 2,251 (+5%) | 12mo | $320,000 | $142 | 60 |
| 1101 Corbin St | 0.42mi | 4/2.5 | 1,980 (-8%) | 14mo | $305,000 | $154 | 54 |
| 102 Ridgewood Ct | 0.39mi | 4/2.5 | 1,967 (-8%) | 16mo | $300,000 | $153 | 52 |
| 108 Ridgewood Ct | 0.43mi | 4/2.5 | 1,973 (-8%) | 17mo | $319,500 | $162 | 51 |
| 506 Pine Valley Rd | 0.26mi | 3/2.0 (-1) | 1,884 (-12%) | 19mo | $275,000 | $146 | 47 |
| 106 Caswell Ct | 0.53mi | 3/2.5 (-1) | 1,926 (-10%) | 17mo | $255,000 | $132 | 37 |
| 400 Winchester Rd | 0.60mi | 3/2.0 (-1) | 1,829 (-15%) | 8mo | $257,000 | $141 | 35 |
Match score weights: distance 35% · size 25% · config 20% · recency 20%. Top-matched comps best support the ARV.
Projected returns pro-forma
-3.0% appreciation · 3.86% rent growth · sell at horizon
- IRR
- -14.0%
- Equity multiple
- 0.49×
- Total profit
- $-37,430
- Equity at exit
- $39,363
- IRR
- -4.0%
- Equity multiple
- 0.72×
- Total profit
- $-20,453
- Equity at exit
- $22,826
Cash invested: $73,920 (down + closing). Projections, not guarantees.
Landlord ↔ Tenant lean methodology
- Overall (STATE)
- 85 Strongly Landlord-Friendly
- State North Carolina
- 85 Strongly Landlord-Friendly · R+3
- County
- — inherits STATE
- City
- — inherits STATE
ZIP-level market 28546
- Home prices YoY
- -19.3%
- Rents YoY
- 3.9%
- Active inventory
- 612
- Price-to-rent
- 10.2×
Monthly cashflow live
- Estimated rent
- $2,163 high interval (Pro) →
- Mortgage (P&I)
- −$1,384
- Tax from tax record
- −$159 /mo · $1,910/yr
- Insurance
- −$110
- HOA
- −$0
- Vacancy / Maint / Mgmt
- −$454
- Net cashflow
- $55
Break-even live
Sensitivity live
| Price | -10% $205 | -5% $130 | +0% $55 | +5% $-19 | +10% $-94 |
|---|---|---|---|---|---|
| Rent | -10% $-115 | -5% $-30 | +0% $55 | +5% $141 | +10% $226 |
| Rate | -1.0pp $188 | -0.5pp $123 | base $55 | +0.5pp $-13 | +1.0pp $-83 |
UW: 25.0% down · 7.5% · 30yr · 1.5% tax · 5.0% vac · 8.0% maint · 8.0% mgmt
Financing live
Cash to close
- Down payment
- $66,000
- Closing costs
- $7,920
- Reserves months
- —
- Total cash needed
- —
Loan-product check · same deal, 3 products live
Conventional
25% down · 7.5% · 30yr
- Down + closing
- —
- Monthly P&I
- —
- Monthly cashflow
- —
- DSCR
- —
- Eligible?
- —
Personal DTI + credit; lowest rate.
DSCR
20% down · 8.5% · 30yr
- Down + closing
- —
- Monthly P&I
- —
- Monthly cashflow
- —
- DSCR
- —
- Eligible?
- —
No personal income docs; deal must DSCR.
Hard money
10% down · 12.0% · 12mo
- Down + closing
- —
- Monthly P&I
- —
- Monthly cashflow
- —
- DSCR
- —
- Eligible?
- —
Short-term bridge; refi at stabilization.
Rent comps 6 comps
| Address | Beds | Baths | Sqft | Rent | $/sqft | DOM | Units | Dist |
|---|---|---|---|---|---|---|---|---|
| 821 Shadowridge Rd Jacksonville, NC | 3.0 | 2.0 | 1488 | $750 | $0.50 | 23d | 1 | 0.72mi |
| 204 Grandford Pl Jacksonville, NC | 5.0 | 2.5 | 2403 | $2,200 | $0.92 | 23d | 1 | 0.85mi |
| 111 Old Post Ct Jacksonville, NC | 4.0 | 3.0 | 2482 | $2,100 | $0.85 | 23d | 1 | 0.91mi |
| 102 Riverbirch Pl Jacksonville, NC | 3.0 | 2.5 | 1520 | $2,400 | $1.58 | 23d | 1 | 0.95mi |
| 939 Eton Dr Jacksonville, NC | 4.0 | 2.5 | 2472 | $2,500 | $1.01 | 15d | 1 | 1.00mi |
| 110 Sycamore Dr Jacksonville, NC | 3.0 | 2.0 | 1433 | $1,750 | $1.22 | 23d | 1 | 1.16mi |
Listing history 33 events
-
2026-06-21days on market $264,000 Active 93 DOM
-
2026-06-19days on market $264,000 Active 91 DOM
-
2026-06-18days on market $264,000 Active 90 DOM
-
2026-06-17pricedays on market $264,000 Active 89 DOM
-
2026-06-16days on market $265,000 Active 88 DOM
-
2026-06-15days on market $265,000 Active 87 DOM
-
2026-06-14days on market $265,000 Active 85 DOM
-
2026-06-13days on market $265,000 Active 84 DOM
-
2026-06-10days on market $265,000 Active 82 DOM
-
2026-06-09days on market $265,000 Active 81 DOM
-
2026-06-09days on market $265,000 Active 80 DOM
-
2026-06-07days on market $265,000 Active 79 DOM
-
2026-06-03days on market $265,000 Active 75 DOM
-
2026-06-02days on market $265,000 Active 74 DOM
-
2026-06-01days on market $265,000 Active 73 DOM
-
2026-05-31days on market $265,000 Active 72 DOM
-
2026-05-30days on market $265,000 Active 71 DOM
-
2026-05-23status Active
-
2026-05-07historical Active Under Contract
-
2026-05-02price $268,900
-
2026-04-21status Active
-
2026-03-19historical Active Under Contract
-
2026-03-14price $269,900
-
2026-02-26price $273,900
-
2026-02-11price $274,900
-
2026-01-31status Active
-
2026-01-19historical Active Under Contract
-
2026-01-06price $279,900
-
2025-12-18$285,000 Active
-
2025-07-17soldstatus $139,500
-
2013-11-18historical
-
2012-12-19$118,900
-
2000-06-19soldstatus $87,500
ⓘ Source: listings_history table (triggers on properties + properties_extension) + one-shot
backfill from property_details.listing_events for pre-trigger history.
Tax reassessment forecast NC · Resets to sale price
- Current annual tax
- $1,910 · $159/mo
- Projected year-2 tax
- $2,165 · $180/mo
- Expected delta
- +$255/yr (+$21/mo · 13.3%)
ⓘ Screening estimate from a state-policy table — verify with the county assessor before closing.
Climate risk First Street
- Flood 1/10 Low FEMA zone X (unshaded) · 0% chance over 30 yrs
- Wildfire 3/10 Moderate
- Heat 9/10 Extreme 7 d/yr ≥106°F today · 18 d/yr by 30 yrs out
- Wind 8/10 Severe 99% chance of damaging wind over 30 yrs
- Air quality 3/10 Moderate 2 unhealthy d/yr today · 4 by 30 yrs out
Nearby sold comps map
Loading sold comps map…
Walkable amenities ~0.75 mi
Loading nearby amenities…
Taxation est. · year 1
- Rental income
- $25,961
- − Mortgage interest
- −$14,788
- − Property taxes
- −$1,910
- − Insurance
- −$1,320
- − Repairs & maintenance
- −$2,077
- − Management
- −$2,077
- − Depreciation
- −$7,680
- Taxable loss
- −$3,891
- Est. tax savings @ 24.0%
- +$934
- After-tax cash flow
- $1,600/yr
For passive investors: Depreciation is non-cash, so a rental often shows a tax loss while cash-flowing — sheltering income. Rental losses are passive: they offset passive income freely, and up to $25,000/yr can offset ordinary (W-2) income if you actively participate and your MAGI is under $100k (phasing out to $0 by $150k); unused losses carry forward. On sale, claimed depreciation is recaptured at up to 25%, and gains may owe capital-gains tax (a 1031 exchange can defer both). Figures are a year-1 estimate at your 24.0% rate — not tax advice; consult a CPA.
Schools (NCES district)
- District
- Onslow County Schools
- NCES district ID
- 3703450
- Math proficiency
- 42% ▲ 6.00%
- Reading proficiency
- 49% ▲ 5.00%
- Median HH income
- $46,076
- Composite
- 38.66/100
- National rank
- #4148
- State rank
- #84 of 178 in NC
Livability — Jacksonville
- Score
- 71/100
- State rank
- #111
- US rank
- #6991
Category grades
Schools grade is shown separately in the Schools card above.
Census & demographics
- Census place
- Jacksonville, NC
- County
- Onslow County · 164,453 people
- City population
- 96,397
- Metro
- Jacksonville, NC
- Population (ZIP)
- 47,256
- Household income
- $63,561
- Rent vs Own
- Severe rent burden
- 1830.0
Population outlook (Onslow County) Hauer SSP2
- Today (2025)
- 189,789 people
- By 2030
- 194,463 · +2.5%
- By 2040
- 193,629 · +2.0%
- By 2050
- 193,248 · +1.8%
- By 2075
- 196,995 · +3.8%
- By 2100
- 201,513 · +6.2%
Race, ethnicity, and origin ACS 2023
- Neighborhood character
- Diverse neighborhood (Simpson 0.62)
- Race & ethnicity
- White 57% Black 18% Hispanic / Latino 16% Two or more races 13% Asian 2%
- Hispanic origin (detail)
- Mexican 5% Puerto Rican 5% Dominican 1%
- Common ancestry
- Romanian 1% Serbian 1% Slovak 1%
- Foreign-born
- 5% · Canada, South Korea
- Languages at home
- 89% English-only · Spanish 8% German/W. Germanic 1% Tagalog/Filipino 1%
Political lean MEDSL · Onslow
- 2024 margin
- Solid R (+35.9) · D 31.5% · R 67.5% · Other 1.0%
- 2008→2024 swing
- -14.5pp toward R · 2008: -21.5pp · 2024: -35.9pp
- All cycles
- 2024: R+35.9 2020: R+30.2 2016: R+34.6 2012: R+27.0 2008: R+21.5
Not yet ingested
- Civics
- —
Market trends
- HPI YoY
- ▼ -50.75%
- Current HPI
- 211.9993
- Rent YoY
- ▲ 3.86%
- Metro
- Jacksonville, NC
- State GDP YoY
- ▲ 3.28%
- F500 in state
- 26
Industry mix (Fortune 500 HQ in NC)
| Industry | F500 HQs | Revenue |
|---|---|---|
| Financial Services | 2 | $213B |
|
||
| Retail | 2 | $95B |
|
||
| Industrial Conglomerate | 1 | $38B |
|
||
| Metals / Steel | 1 | $35B |
|
||
| Utilities | 1 | $30B |
|
||
| Industrial Machinery | 1 | $19B |
|
||
Price history
+207.3% since first listed16 events — show timeline
- 2026-05-23 Relisted — Hive MLS
- 2026-05-07 Contingent — Hive MLS
- 2026-05-02 Price Changed $268,900 Hive MLS
- 2026-04-21 Relisted — Hive MLS
- 2026-03-19 Contingent — Hive MLS
- 2026-03-14 Price Changed $269,900 Hive MLS
- 2026-02-26 Price Changed $273,900 Hive MLS
- 2026-02-11 Price Changed $274,900 Hive MLS
- 2026-01-31 Relisted — Hive MLS
- 2026-01-19 Contingent — Hive MLS
- 2026-01-06 Price Changed $279,900 Hive MLS
- 2025-12-18 Listed $285,000 Hive MLS
- 2025-07-17 Sold (Public Records) $139,500 Public Records
- 2013-11-18 Listing Removed — Hive MLS
- 2012-12-19 Listed $118,900 Hive MLS
- 2000-06-19 Sold (Public Records) $87,500 Public Records
Property tax history
+1.1%/yrLatest (2025): $1,910 · +0.0% YoY. Source: county tax records.
Cash-flow waterfall
monthlySold comps — $/sqft
last 12 mo · ≤1 miLoading sold comps…