1333 S Dixie Hwy #202 · Deerfield Beach, FL
Flood risk No data
- FEMA flood zone
- —
- Chance of flooding over 30 yrs
- —
- Est. flood insurance / yr
- —
Fire risk No data
- Est. fire insurance / yr
- —
Heat risk No data
- Hot days now (above threshold)
- —
- Hot days in 30 yrs
- —
Wind risk No data
- Chance of severe wind over 30 yrs
- —
Air-quality risk No data
- Unhealthy air days now
- —
- Unhealthy air days in 30 yrs
- —
Risk factors via First Street. Map © Google.
Why this score? — see what drove the C+ grade
The composite is a weighted blend of 9 inputs, each scored 0–100. Each bar is that input's sub-score; the figure is the points it added to the 100-point composite (weight × sub-score).
- Cash flow +24.6/30.0
- DSCR +7.9/10.0
- 1% rule +7.6/10.0
- ARV discount +7.5/15.0
- Schools +4.1/10.0
- Livability +3.8/5.0
- Rent growth +3.0/5.0
- Condition / age +2.5/5.0
- Appreciation +0.0/10.0
$158,900
🖨 Deal sheet 📄 Offer letter ✓ Due diligence
Listing remarks
GOOD FOR FIRST TIME HOME BUYER
Key facts
- $326 HOA
- Built 1974
- Listed 98 days
Property features AI
Finance
- HOA & community: Monthly association fee; Association pays for grounds maintenance; Association amenities: Other; Senior community; Pets allowed with no restrictions
Exterior
- Home design: Condominium; Resale; 2-story building; Entry level: 1
- Construction: CBS construction
- Exterior features: First-floor entry; Not waterfront
Interior
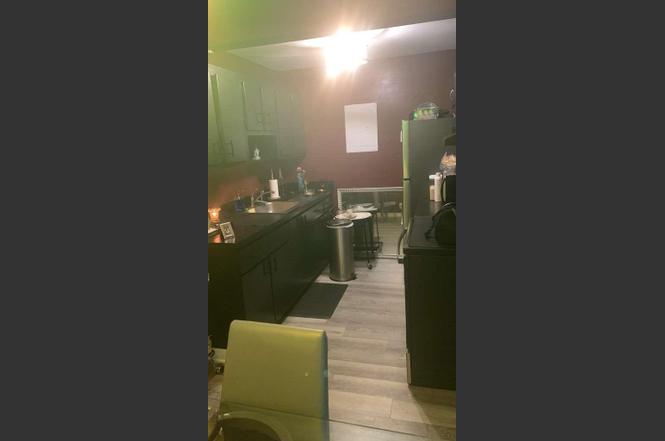
- Kitchen: Microwave; Refrigerator
- Bedrooms: No main-level bedrooms
- Flooring: Wood flooring
- Bathrooms: 1 full bathroom
- Heating & cooling: Central heating; Central air conditioning
- Interior features: Microwave; Refrigerator
Neighborhood map
What this means for you Summary
Snapshot
- This is a 2-bed/1.0-bath condo listed at $159k.
Deal economics
- At list price, monthly cash flow is $327 ($4k/yr) — positive.
- The deal already cash-flows at list — no discount required.
- Meets the 1% rule at list price ($2k rent vs $159k).
- Recommended offer: $145k (9.0% below list) — sets the bar for market timing.
- Cap rate 8.8% vs local median 4.2% in Deerfield Beach — top-decile yield for the area; either an underpriced asset or a hidden risk that comps aren't pricing in. Stress-test before assuming the spread holds.
Location & tenants
- Location reads 75/100 on livability (#250 in FL, #3,970 nationally) — a middle-class / working-renter tenant base. Strengths: housing A+, health & safety A+, cost of living A; Watch: amenities D-, employment D-.
- Broward (suburban): math 42% / reading 53% proficiency, ranked #46 of 73 in FL (top 63%) — families likely to look elsewhere, expect single-tenant / working-renter base with shorter leases.
- Zoned schools: Park Ridge Elementary School (math 26% / reading 24%, grade F, #2,030 of 2,144 statewide, top 95%, 577 students, 79% FRL); Deerfield Beach Middle School (math 30% / reading 39%, grade F, #421 of 571 statewide, top 74%, 1,140 students, 72% FRL); Deerfield Beach High School (math 12% / reading 37%, grade F, #505 of 667 statewide, top 79%, 2,251 students, 69% FRL) — zoned schools average 73% FRL vs 51% district-wide (22 pts higher); higher-poverty schools than district average — tighter screening recommended.
- Zoned-school proficiency averages 28% at this address vs 48% district-wide (-20 pts) — the specific schools serving this property underperform the Broward average; the district grade overstates school quality for this exact location.
- Market conditions: Rents rising (+2.2%/yr); 297 active listings in the ZIP; 19 comparable units currently listed for rent nearby; rentals leasing fast (median 14d on market — plan ~1-2 weeks tenant-placement turnaround); 2,111 units permitted in Broward County in 2024 (1,265 in 5+ unit buildings).
- This rent runs 41% of the median local income ($59k/yr) — at the standard rent-burdened threshold; future hikes will face affordability resistance.
Forward outlook
- Local home prices are declining (-3.0%/yr); year-one equity from $1k of loan paydown is wiped out by about $5k of value loss. Plan a longer hold.
- Broward County population projected at +34% by 2050 — long-run rental-demand tailwind backs the buy-and-hold thesis.
Negotiation context
- It's been on market 99 days — a 9% lower offer ($145k) is reasonable based on typical stale-listing flexibility.
Questions for the listing agent
- It's been on market 99 days. Have you received any prior offers? Is the seller open to a 9% concession, seller financing, or rate buy-down credit?
- Built in 1974 — when were the roof, HVAC, electrical panel, plumbing, and water heater last replaced?
- What does the HOA fee cover, when was the last increase, and are there any pending special assessments or reserve-fund shortfalls?
- Any open or pending special assessments — roof, HVAC, plumbing, elevator, façade? What's the per-unit balance and payoff schedule, and is the seller paying it off at close or rolling it to the buyer?
- Why hasn't it sold? Are there any deal-killer items the seller is aware of (foundation, flood, title, zoning, code violations)?
- Is there a deadline driving the sale (1031 exchange, divorce, estate, relocation)? That informs how much negotiation room exists.
- Schools are D-rated, which usually means shorter tenancies and higher turnover. Who's the typical renter profile here, and what's been the actual vacancy rate?
- What's the average days-on-market for RENTAL listings here right now (not sales)? A rising rental-DOM trend means longer vacancies and softer asking-rent achievability than the comps imply.
- What's the recent tenant-quality profile in this submarket — average credit score on applications, eviction rate, late-payment / NSF rate, and stable-employment percentage? A property-management company in the area should have these aggregated.
- How much new apartment / multifamily construction is in the pipeline within 1–3 miles? Heavy new supply (>2% of stock underway) typically softens rents 12–24 months out; light construction supports rent growth.
Investment metrics
- 1% rule
- 1.26% ✓
- Cap rate
- 8.76%
- Cash-on-cash
- 8.83%
- DSCR
- 1.39
- GRM
- 6.6
CMA / ARV
No comps found within radius.
Projected returns pro-forma
-3.0% appreciation · 2.17% rent growth · sell at horizon
- IRR
- -3.9%
- Equity multiple
- 0.86×
- Total profit
- $-6,435
- Equity at exit
- $23,693
- IRR
- 4.8%
- Equity multiple
- 1.34×
- Total profit
- $15,057
- Equity at exit
- $13,739
Cash invested: $44,492 (down + closing). Projections, not guarantees.
Landlord ↔ Tenant lean methodology
- Overall (STATE)
- 87 Strongly Landlord-Friendly
- State Florida
- 87 Strongly Landlord-Friendly · R+3
- County
- — inherits STATE
- City
- — inherits STATE
ZIP-level market 33441
- Rents YoY
- 2.2%
- Active inventory
- 297
- Price-to-rent
- 6.6×
Monthly cashflow live
- Estimated rent
- $2,006 high interval (Pro) →
- Mortgage (P&I)
- −$833
- Tax from tax record
- −$32 /mo · $380/yr
- Insurance
- −$66
- HOA
- −$326
- Vacancy / Maint / Mgmt
- −$421
- Net cashflow
- $327
Break-even live
UW: 25.0% down · 7.5% · 30yr · 1.5% tax · 5.0% vac · 8.0% maint · 8.0% mgmt
Financing live
Cash to close
- Down payment
- $39,725
- Closing costs
- $4,767
- Reserves months
- —
- Total cash needed
- —
Loan-product check · same deal, 3 products live
Conventional
25% down · 7.5% · 30yr
- Down + closing
- —
- Monthly P&I
- —
- Monthly cashflow
- —
- DSCR
- —
- Eligible?
- —
Personal DTI + credit; lowest rate.
DSCR
20% down · 8.5% · 30yr
- Down + closing
- —
- Monthly P&I
- —
- Monthly cashflow
- —
- DSCR
- —
- Eligible?
- —
No personal income docs; deal must DSCR.
Hard money
10% down · 12.0% · 12mo
- Down + closing
- —
- Monthly P&I
- —
- Monthly cashflow
- —
- DSCR
- —
- Eligible?
- —
Short-term bridge; refi at stabilization.
Rent comps 19 comps
| Address | Beds | Baths | Sqft | Rent | $/sqft | DOM | Units | Dist |
|---|---|---|---|---|---|---|---|---|
| 401 SW 13th Pl Deerfield Beach, FL | 2.0 | 1.0 | 709 | $1,695 | $2.39 | 16d | 1 | 0.14mi |
| 737 SE 1st Way Deerfield Beach, FL | 1.0–2.0 | 1.5–2.0 | 885 | $2,100 | $2.37 | 7d | 2 | 0.54mi |
| 1417 SE 3rd Ter Deerfield Beach, FL | 1.0 | 1.0 | 570 | $1,300 | $2.28 | 10d | 1 | 0.64mi |
| 770 SE 2nd Ave Deerfield Beach, FL | 1.0–2.0 | 1.5–2.0 | 855 | $2,350 | $2.75 | 4d | 3 | 0.65mi |
| 770 SE 2nd Ave Deerfield Beach, FL | 1.0–2.0 | 1.5–2.0 | 855 | $2,350 | $2.75 | 7d | 3 | 0.65mi |
| 770 SE 2nd Ave Deerfield Beach, FL | 1.0–2.0 | 1.5–2.0 | 855 | $2,350 | $2.75 | 10d | 2 | 0.65mi |
| 550 SE 2nd Ave Unit G3 Deerfield Beach, FL | 1.0 | 1.0 | 650 | $1,550 | $2.38 | 7d | 1 | 0.79mi |
| 540 SE 2nd Ave Unit J4 Deerfield Beach, FL | 1.0 | 1.0 | 650 | $1,500 | $2.31 | 7d | 1 | 0.80mi |
| 1325 SE 8th Ave Deerfield Beach, FL | 2.0 | 1.0 | 800 | $1,900 | $2.38 | 24d | 4 | 0.95mi |
| 1850 NE 48th St Pompano Beach, FL | 1.0–3.0 | 1.0–1.5 | 827 | $1,975 | $2.39 | 24d | 1 | 1.05mi |
| 1960 NE 48th St Unit 9 Pompano Beach, FL | 1.0 | 1.0 | 700 | $1,500 | $2.14 | 22d | 1 | 1.10mi |
| 4611 N Federal Hwy Pompano Beach, FL | 1.0–3.0 | 1.0–2.0 | 969 | $2,616 | $2.70 | 1d | 9 | 1.17mi |
| 329 Farnham P #329 Deerfield Beach, FL | 1.0 | 1.5 | 700 | $1,450 | $2.07 | 24d | 1 | 1.36mi |
| 236 SE 9th Ave Deerfield Beach, FL | 1.0 | 1.0 | 650 | $1,645 | $2.53 | 13d | 1 | 1.36mi |
| 224 SE 9th Ave Deerfield Beach, FL | 1.0 | 1.0 | 650 | $1,645 | $2.53 | 24d | 1 | 1.37mi |
| 1330 NE 41st Dr #2 Pompano Beach, FL | 1.0 | 1.0 | 400 | $1,750 | $4.38 | 10d | 1 | 1.39mi |
| 137 Farnham F Deerfield Beach, FL | 1.0 | 1.5 | 708 | $2,000 | $2.82 | 24d | 1 | 1.45mi |
| 137 Farnham F #137 Deerfield Beach, FL | 1.0 | 1.5 | 700 | $2,500 | $3.57 | 24d | 1 | 1.45mi |
| 2115 NE 42nd Ct Unit 206N Lighthouse Point, FL | 1.0 | 1.0 | 560 | $1,600 | $2.86 | 24d | 1 | 1.46mi |
HOA detail condo
- Monthly dues
- $326 · $3,912/yr
- Assessments
- None detected in remarks — confirm with the listing agent.
Listing history 13 events
-
2026-06-18days on market $158,900 Active 99 DOM
-
2026-06-17days on market $158,900 Active 98 DOM
-
2026-06-16days on market $158,900 Active 97 DOM
-
2026-06-15days on market $158,900 Active 96 DOM
-
2026-06-13days on market $158,900 Active 94 DOM
-
2026-06-09days on market $158,900 Active 90 DOM
-
2026-06-07days on market $158,900 Active 88 DOM
-
2026-06-04days on market $158,900 Active 85 DOM
-
2026-06-03days on market $158,900 Active 84 DOM
-
2026-06-02days on market $158,900 Active 83 DOM
-
2026-06-01days on market $158,900 Active 82 DOM
-
2026-05-31days on market $158,900 Active 81 DOM
-
2026-01-10$158,900 Active
ⓘ Source: listings_history table (triggers on properties + properties_extension) + one-shot
backfill from property_details.listing_events for pre-trigger history.
Tax reassessment forecast FL · Resets to sale price
- Current annual tax
- $380 · $32/mo
- Projected year-2 tax
- $1,319 · $110/mo
- Expected delta
- +$939/yr (+$78/mo · 247.2%)
ⓘ Screening estimate from a state-policy table — verify with the county assessor before closing.
Nearby sold comps map
Loading sold comps map…
Walkable amenities ~0.75 mi
Loading nearby amenities…
Taxation est. · year 1
- Rental income
- $24,068
- − Mortgage interest
- −$8,901
- − Property taxes
- −$380
- − Insurance
- −$794
- − Repairs & maintenance
- −$1,925
- − Management
- −$1,925
- − HOA
- −$3,912
- − Depreciation
- −$4,623
- Taxable income
- $1,607
- Est. tax owed @ 24.0%
- −$386
- After-tax cash flow
- $3,542/yr
For passive investors: Depreciation is non-cash, so a rental often shows a tax loss while cash-flowing — sheltering income. Rental losses are passive: they offset passive income freely, and up to $25,000/yr can offset ordinary (W-2) income if you actively participate and your MAGI is under $100k (phasing out to $0 by $150k); unused losses carry forward. On sale, claimed depreciation is recaptured at up to 25%, and gains may owe capital-gains tax (a 1031 exchange can defer both). Figures are a year-1 estimate at your 24.0% rate — not tax advice; consult a CPA.
Schools (NCES district)
- District
- Broward
- NCES district ID
- 1200180
- Math proficiency
- 42% ▼ -18.00%
- Reading proficiency
- 53% ▼ -5.00%
- Median HH income
- $52,139
- Composite
- 40.88/100
- National rank
- #3621
- State rank
- #46 of 73 in FL
Livability — Deerfield Beach
- Score
- 75/100
- State rank
- #250
- US rank
- #3970
Category grades
Schools grade is shown separately in the Schools card above.
Census & demographics
- Census place
- Deerfield Beach, FL
- County
- Broward County · 1,963,430 people
- City population
- 61,449
- Metro
- Miami-Fort Lauderdale-Pompano Beach, FL
- Population (ZIP)
- 30,153
- Household income
- $58,594
- Rent vs Own
- Severe rent burden
- 2148.0
Population outlook (Broward County) Hauer SSP2
- Today (2025)
- 2,207,033 people
- By 2030
- 2,360,704 · +7.0%
- By 2040
- 2,661,208 · +20.6%
- By 2050
- 2,946,698 · +33.5%
- By 2075
- 3,602,273 · +63.2%
- By 2100
- 3,970,984 · +79.9%
Race, ethnicity, and origin ACS 2023
- Neighborhood character
- Highly diverse neighborhood (Simpson 0.71)
- Race & ethnicity
- White 39% Black 33% Hispanic / Latino 17% Two or more races 15% Asian 2%
- Hispanic origin (detail)
- Mexican 2% Puerto Rican 1% Cuban 3% Dominican 1%
- Common ancestry
- Hispanic 11% Estonian 5% Romanian 3%
- Foreign-born
- 29% · Canada, Jamaica, Guatemala
- Languages at home
- 65% English-only · Spanish 13% French/Haitian/Cajun 11% Other Indo-European 9%
Political lean MEDSL · Broward
- 2024 margin
- D (+17.0) · D 58.0% · R 41.0%
- 2008→2024 swing
- -17.8pp toward R · 2008: 34.7pp · 2024: 17.0pp
- All cycles
- 2024: D+17.0 2020: D+29.8 2016: D+35.0 2012: D+34.9 2008: D+34.7
Not yet ingested
- Civics
- —
Market trends
- HPI YoY
- ▼ -353.25%
- Current HPI
- 404.3829
- Rent YoY
- ▲ 2.17%
- Metro
- Miami-Fort Lauderdale-Pompano Beach, FL
- State GDP YoY
- ▲ 3.28%
- F500 in state
- 36
Industry mix (Fortune 500 HQ in FL)
| Industry | F500 HQs | Revenue |
|---|---|---|
| Industrial Technology | 2 | $29B |
|
||
| Insurance | 2 | $17B |
|
||
| Retail | 1 | $60B |
|
||
| Technology Distribution | 1 | $58B |
|
||
| Homebuilding | 1 | $35B |
|
||
| Technology Manufacturing | 1 | $35B |
|
||
Price history
1 event — show timeline
- 2026-01-10 Listed $158,900 Beaches MLS
Property tax history
+7.7%/yrLatest (2025): $380 · +11.6% YoY. Source: county tax records.
Cash-flow waterfall
monthlySold comps — $/sqft
last 12 mo · ≤1 miLoading sold comps…