133 Forrest View Ln · Coeburn, VA
Flood risk 1/10 · Minimal
- FEMA flood zone
- X (unshaded)
- Chance of flooding over 30 yrs
- 0.0%
- Est. flood insurance / yr
- $507 – $1,088
Fire risk 7/10 · Major
- Est. fire insurance / yr
- $666 – $1,236
Heat risk 2/10 · Minimal
- Hot days now (above 93°F)
- 7 days/yr
- Hot days in 30 yrs
- 19 days/yr
Wind risk 2/10 · Minimal
- Chance of severe wind over 30 yrs
- —
Air-quality risk 1/10 · Minimal
- Unhealthy air days now
- 0 days/yr
- Unhealthy air days in 30 yrs
- 0 days/yr
Risk factors via First Street. Map © Google.
Why this score? — see what drove the C- grade
The composite is a weighted blend of 9 inputs, each scored 0–100. Each bar is that input's sub-score; the figure is the points it added to the 100-point composite (weight × sub-score).
- Cash flow +18.9/30.0
- DSCR +5.9/10.0
- Schools +5.1/10.0
- 1% rule +5.0/10.0
- Appreciation +5.0/10.0
- ARV discount +4.5/15.0
- Livability +3.2/5.0
- Rent growth +2.5/5.0
- Condition / age +2.2/5.0
$144,000
🖨 Deal sheet 📄 Offer letter ✓ Due diligence
Listing remarks
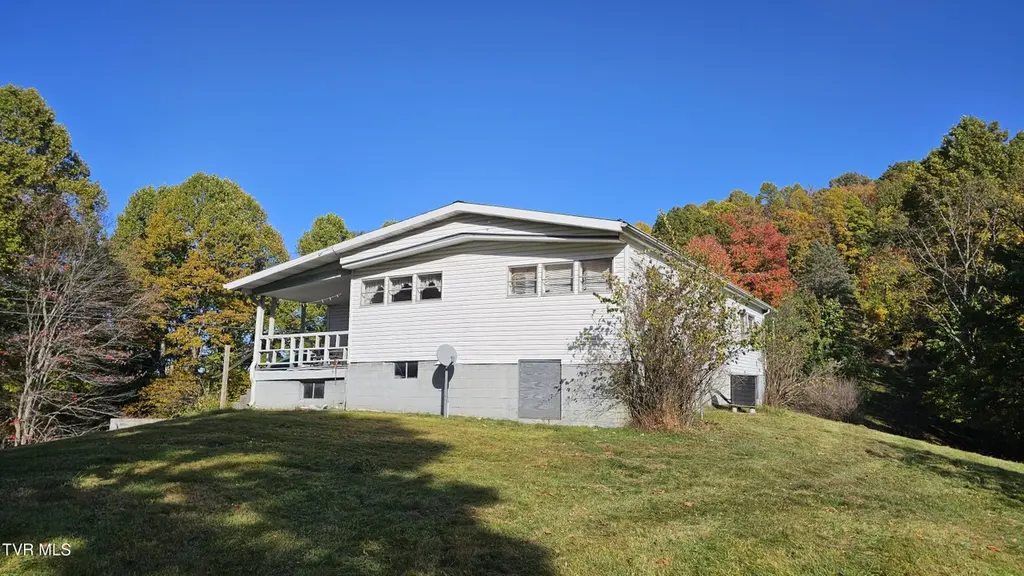
Mountain Living with Endless Potential in Coeburn! Almost -6 Acres:| Beds: 3 | Baths: 1.5 Escape the hustle and bustle without sacrificing convenience! This charming, move-in-ready home offers the perfect blend of peaceful mountain living and town accessibility. Situated on nearly 6 sprawling acres, this property is a nature lover's dream with breathtaking mountain views and mature floral landscaping already in place. The Home Inside, you'll find a comfortable and clean layout featuring three bedrooms, a full bath, and a convenient half bath. Whether you want to move right in or bring your DIY vision to add a personal touch, this home is a solid canvas. Shared Driveway. Green Thumb's
Key facts
- Carport
- Nearly 6 acres
- Detached garage
Tags
Property features AI
Finance
- HOA & community: Landscaping (association amenity)
Exterior
- Parking: Driveway; Carport; Gravel parking; Shared driveway
- Utilities: Public water; Septic tank; Electricity connected; Sewer connected; Phone available; Water connected
- Home design: Manufactured house (double wide); Single-story
- Construction: Vinyl siding; Metal roof; Block foundation; Built as a double wide manufactured home
- Exterior features: Front porch; Side porch; Back yard fencing; Garage(s) on property; Has view; Level, part wooded, sloped terrain
Interior
- Kitchen: Electric range; Microwave; Refrigerator
- Flooring: Carpet; Laminate; Vinyl
- Bathrooms: 1 full bathroom; 1 half bathroom
- Heating & cooling: Heat pump; Propane heating option; Has cooling
- Interior features: Laminate counters; Window treatments; Basement with exterior entry; Gas log fireplace in the living room
- Laundry & utility: Washer hookup; Electric dryer hookup; Dryer
Neighborhood map
What this means for you Summary
Snapshot
- This is a 3-bed/1.5-bath single-family listed at $144k. Condition is rated fair.
Deal economics
- At list price, monthly cash flow is $147 ($2k/yr) — positive.
- The deal already cash-flows at list — no discount required.
- Meets the 1% rule at list price ($1k rent vs $144k).
- Recommended offer: $140k (3.0% below list) — sets the bar for market timing.
- Cap rate 7.5% vs local median 5.4% in Coeburn — top-decile yield for the area; either an underpriced asset or a hidden risk that comps aren't pricing in. Stress-test before assuming the spread holds.
Location & tenants
- Location reads 63/100 on livability (#383 in VA) — a middle-class / working-renter tenant base. Strengths: cost of living A+, crime B+, housing B; Watch: amenities F, commute F, employment F.
- Dickenson County Public School District (rural): math 59% / reading 66% proficiency, ranked #58 of 131 in VA (top 44%) — acceptable for families but not a draw, mixed tenant base, ~2y average lease.
- Zoned schools: Clintwood Elementary (math 67% / reading 62%, grade B, #416 of 1,108 statewide, top 41%, 425 students, 90% FRL); Ridgeview High (math 62% / reading 72%, grade B, #185 of 319 statewide, top 61%, 592 students, 89% FRL) — zoned schools average 89% FRL vs 52% district-wide (37 pts higher); higher-poverty schools than district average — tighter screening recommended.
- Market conditions: 46 active listings in the ZIP; 11 units permitted in Dickenson County in 2024 (0 in 5+ unit buildings).
Forward outlook
- In year one you build about $1k of equity ($996 loan paydown + $98 appreciation (0.1% local appreciation)).
- Dickenson County population projected at -30% by 2050 — secular population decline; favor cash flow + early exit over multi-decade hold.
- At projected returns (0.1% appreciation + 3.0% rent growth), your $40k cash investment doubles in ~9 years — after that, you're playing with house money.
Negotiation context
- It's been on market 49 days — a 3% lower offer ($140k) is reasonable based on typical stale-listing flexibility.
- 2 sale attempts with the ask held roughly flat each time — persistent listings suggest the price (not the market) is what's stuck; bring a comps-based counter.
Risks & watch-outs
- Climate carrying-cost: major wildfire risk — expect insurance premiums to compound above CPI over the hold.
Questions for the listing agent
- It's been on market 49 days. Have you received any prior offers? Is the seller open to a 3% concession, seller financing, or rate buy-down credit?
- Have any recent inspections been done? Can we get a copy of the seller's disclosures and any deferred-maintenance estimates?
- Built in 1972 — when were the roof, HVAC, electrical panel, plumbing, and water heater last replaced?
- Is there a deadline driving the sale (1031 exchange, divorce, estate, relocation)? That informs how much negotiation room exists.
- Schools are A-rated — typically a magnet for longer-tenancy family renters. What's the average tenant stay here, and is there a school-zone premium baked into asking?
- What's the average days-on-market for RENTAL listings here right now (not sales)? A rising rental-DOM trend means longer vacancies and softer asking-rent achievability than the comps imply.
- What's the recent tenant-quality profile in this submarket — average credit score on applications, eviction rate, late-payment / NSF rate, and stable-employment percentage? A property-management company in the area should have these aggregated.
- How much new for-sale + rental construction is in the pipeline within 1–3 miles? Heavy new supply typically softens prices + rents 12–24 months out; constrained supply supports both.
Investment metrics
- 1% rule
- 1.00% ✓
- Cap rate
- 7.52%
- Cash-on-cash
- 4.37%
- DSCR
- 1.19
- GRM
- 8.3
CMA / ARV
- ARV (median comp)
- $134,935
- List price
- $144,000
- Delta
- 6.72%
- Verdict
- FAIR
- Comps
- 1 within 2.0 mi
Projected returns pro-forma
0.07% appreciation · 3.0% rent growth · sell at horizon
- IRR
- 2.9%
- Equity multiple
- 1.14×
- Total profit
- $5,626
- Equity at exit
- $42,304
- IRR
- 8.2%
- Equity multiple
- 1.90×
- Total profit
- $36,447
- Equity at exit
- $51,245
Cash invested: $40,320 (down + closing). Projections, not guarantees.
Landlord ↔ Tenant lean methodology
- Overall (STATE)
- 55 Moderately Landlord-Leaning
- State Virginia
- 55 Moderately Landlord-Leaning · D+2
- County
- — inherits STATE
- City
- — inherits STATE
ZIP-level market 24230
- Home prices YoY
- 0.1%
- Active inventory
- 46
- Price-to-rent
- 8.3×
Monthly cashflow live
- Estimated rent
- $1,446 medium interval (Pro) →
- Mortgage (P&I)
- −$755
- Tax est. 1.5%
- −$180 /mo · $2,160/yr
- Insurance
- −$60
- HOA
- −$0
- Vacancy / Maint / Mgmt
- −$304
- Net cashflow
- $147
Break-even live
UW: 25.0% down · 7.5% · 30yr · 1.5% tax · 5.0% vac · 8.0% maint · 8.0% mgmt
Financing live
Cash to close
- Down payment
- $36,000
- Closing costs
- $4,320
- Reserves months
- —
- Total cash needed
- —
Loan-product check · same deal, 3 products live
Conventional
25% down · 7.5% · 30yr
- Down + closing
- —
- Monthly P&I
- —
- Monthly cashflow
- —
- DSCR
- —
- Eligible?
- —
Personal DTI + credit; lowest rate.
DSCR
20% down · 8.5% · 30yr
- Down + closing
- —
- Monthly P&I
- —
- Monthly cashflow
- —
- DSCR
- —
- Eligible?
- —
No personal income docs; deal must DSCR.
Hard money
10% down · 12.0% · 12mo
- Down + closing
- —
- Monthly P&I
- —
- Monthly cashflow
- —
- DSCR
- —
- Eligible?
- —
Short-term bridge; refi at stabilization.
Listing history 13 events
-
2026-06-18days on market $144,000 Active 49 DOM
-
2026-06-17days on market $144,000 Active 48 DOM
-
2026-06-16pricedays on market $144,000 Active 47 DOM
-
2026-06-15days on market $150,000 Active 46 DOM
-
2026-06-15days on market $150,000 Active 45 DOM
-
2026-06-13days on market $150,000 Active 44 DOM
-
2026-06-12statusdays on market $150,000 Active 43 DOM
-
2026-06-08statusdays on market $150,000 Pending 42 DOM
-
2026-06-03days on market $150,000 Active 40 DOM
-
2026-06-02days on market $150,000 Active 39 DOM
-
2026-06-01days on market $150,000 Active 38 DOM
-
2026-05-31days on market $150,000 Active 37 DOM
-
2026-04-24$150,000 Active 1369-char remark
ⓘ Source: listings_history table (triggers on properties + properties_extension) + one-shot
backfill from property_details.listing_events for pre-trigger history.
Climate risk First Street
- Flood 1/10 Low FEMA zone X (unshaded) · 0% chance over 30 yrs
- Wildfire 7/10 Severe
- Heat 2/10 Low 7 d/yr ≥93°F today · 19 d/yr by 30 yrs out
- Wind 2/10 Low
- Air quality 1/10 Low 0 unhealthy d/yr today · 0 by 30 yrs out
Nearby sold comps map
Loading sold comps map…
Walkable amenities ~0.75 mi
Loading nearby amenities…
Taxation est. · year 1
- Rental income
- $17,347
- − Mortgage interest
- −$8,066
- − Property taxes
- −$2,160
- − Insurance
- −$720
- − Repairs & maintenance
- −$1,388
- − Management
- −$1,388
- − Depreciation
- −$4,189
- Taxable loss
- −$564
- Est. tax savings @ 24.0%
- +$135
- After-tax cash flow
- $1,898/yr
For passive investors: Depreciation is non-cash, so a rental often shows a tax loss while cash-flowing — sheltering income. Rental losses are passive: they offset passive income freely, and up to $25,000/yr can offset ordinary (W-2) income if you actively participate and your MAGI is under $100k (phasing out to $0 by $150k); unused losses carry forward. On sale, claimed depreciation is recaptured at up to 25%, and gains may owe capital-gains tax (a 1031 exchange can defer both). Figures are a year-1 estimate at your 24.0% rate — not tax advice; consult a CPA.
Condition & rehab AI · 13 photos
This home requires extensive repairs and maintenance, including roof replacement, exterior updates, and landscaping. However, with these improvements, it has the potential to significantly increase its resale value.
Repairs flagged
- Major roof — The roof appears to be in poor condition, with visible signs of wear and tear.
- Major exterior siding — The exterior siding shows signs of wear and discoloration, and the paint appears faded.
- Major flooring — The flooring in the interior appears to be in poor condition, with visible wear and tear.
- Major interior walls — The interior walls show signs of wear and discoloration, and the paint appears faded.
- Major landscaping — The landscaping appears to be in poor condition, with overgrown vegetation and a lack of maintenance.
- Major fencing — The fencing appears to be in poor condition, with visible wear and tear.
Value-add opportunities
- Resale roof replacement — A new roof will significantly improve the home's curb appeal and increase its resale value.
- Resale exterior siding and paint — Updating the exterior siding and repainting will improve the home's curb appeal and increase its resale value.
- Resale flooring — Replacing the flooring will improve the home's interior appearance and increase its resale value.
- Resale interior walls and paint — Repainting the interior walls will improve the home's interior appearance and increase its resale value.
- Resale landscaping — Landscaping the property will improve the home's curb appeal and increase its resale value.
- Resale fencing — Repairing or replacing the fencing will improve the home's curb appeal and increase its resale value.
Renovation cost estimate screening
| Repair item | Severity | Est. cost |
|---|---|---|
| roof · The roof appears to be in poor condition, with visible signs of wear and tear. | Major | $15,000–50,000 |
| exterior siding · The exterior siding shows signs of wear and discoloration, and the paint appears faded. | Major | $15,000–50,000 |
| flooring · The flooring in the interior appears to be in poor condition, with visible wear and tear. | Major | $15,000–50,000 |
| interior walls · The interior walls show signs of wear and discoloration, and the paint appears faded. | Major | $15,000–50,000 |
| landscaping · The landscaping appears to be in poor condition, with overgrown vegetation and a lack of maintenance. | Major | $15,000–50,000 |
| fencing · The fencing appears to be in poor condition, with visible wear and tear. | Major | $15,000–50,000 |
| Total estimated repair cost · 6 items | $90,000–300,000 |
Value-add ROI direction
- Resale roof replacement — A new roof will significantly improve the home's curb appeal and increase its resale value. ↑
- Resale exterior siding and paint — Updating the exterior siding and repainting will improve the home's curb appeal and increase its resale value. ↑
- Resale flooring — Replacing the flooring will improve the home's interior appearance and increase its resale value. ↑
- Resale interior walls and paint — Repainting the interior walls will improve the home's interior appearance and increase its resale value. ↑
- Resale landscaping — Landscaping the property will improve the home's curb appeal and increase its resale value. ↑
- Resale fencing — Repairing or replacing the fencing will improve the home's curb appeal and increase its resale value. ↑
ⓘ Cost ranges are severity-bucket heuristics (US national rule-of-thumb). Get contractor quotes + a written scope before underwriting a rehab budget.
Schools (NCES district)
- District
- Dickenson County Public School District
- NCES district ID
- 5101140
- Math proficiency
- 59% ▼ -31.00%
- Reading proficiency
- 66% ▼ -17.00%
- Median HH income
- $30,649
- Composite
- 51.28/100
- National rank
- #1749
- State rank
- #58 of 131 in VA
Livability — Coeburn
- Score
- 63/100
- State rank
- #383
- US rank
- #15422
Category grades
Schools grade is shown separately in the Schools card above.
Census & demographics
- Population (ZIP)
- 7,057
Population outlook (Dickenson County) Hauer SSP2
- Today (2025)
- 13,554 people
- By 2030
- 12,680 · -6.4%
- By 2040
- 11,016 · -18.7%
- By 2050
- 9,562 · -29.5%
- By 2075
- 6,712 · -50.5%
- By 2100
- 4,554 · -66.4%
Race, ethnicity, and origin ACS 2023
- Neighborhood character
- Predominantly White (93%)
- Race & ethnicity
- White 93% Black 3% Hispanic / Latino 1%
- Common ancestry
- Slovak 2% Italian 2% Serbian 1%
- Foreign-born
- 2% · Canada
- Languages at home
- 98% English-only · Spanish 1%
Political lean MEDSL · Dickenson
- 2024 margin
- Solid R (+62.2) · D 18.7% · R 80.9%
- 2008→2024 swing
- -61.5pp toward R · 2008: -0.7pp · 2024: -62.2pp
- All cycles
- 2024: R+62.2 2020: R+58.1 2016: R+56.2 2012: R+26.2 2008: R+0.7
Not yet ingested
- Civics
- —
Market trends
- HPI YoY
- ▲ 0.07%
- Current HPI
- 135.5947
- Rent YoY
- —
- Metro
- —
- State GDP YoY
- ▲ 2.40%
- F500 in state
- 50
Industry mix (Fortune 500 HQ in VA)
| Industry | F500 HQs | Revenue |
|---|---|---|
| Aerospace / Defense | 4 | $236B |
|
||
| Technology / Defense | 3 | $32B |
|
||
| Financial Services | 2 | $176B |
|
||
| Utilities | 2 | $27B |
|
||
| Insurance | 2 | $25B |
|
||
| Technology | 2 | $15B |
|
||
Price history
-4.0% since first listed4 events — show timeline
- 2026-06-15 Price Changed $144,000 TVRMLS
- 2026-06-12 Relisted — TVRMLS
- 2026-06-05 Pending — TVRMLS
- 2026-04-24 Listed $150,000 TVRMLS
Cash-flow waterfall
monthlySold comps — $/sqft
last 12 mo · ≤1 miLoading sold comps…