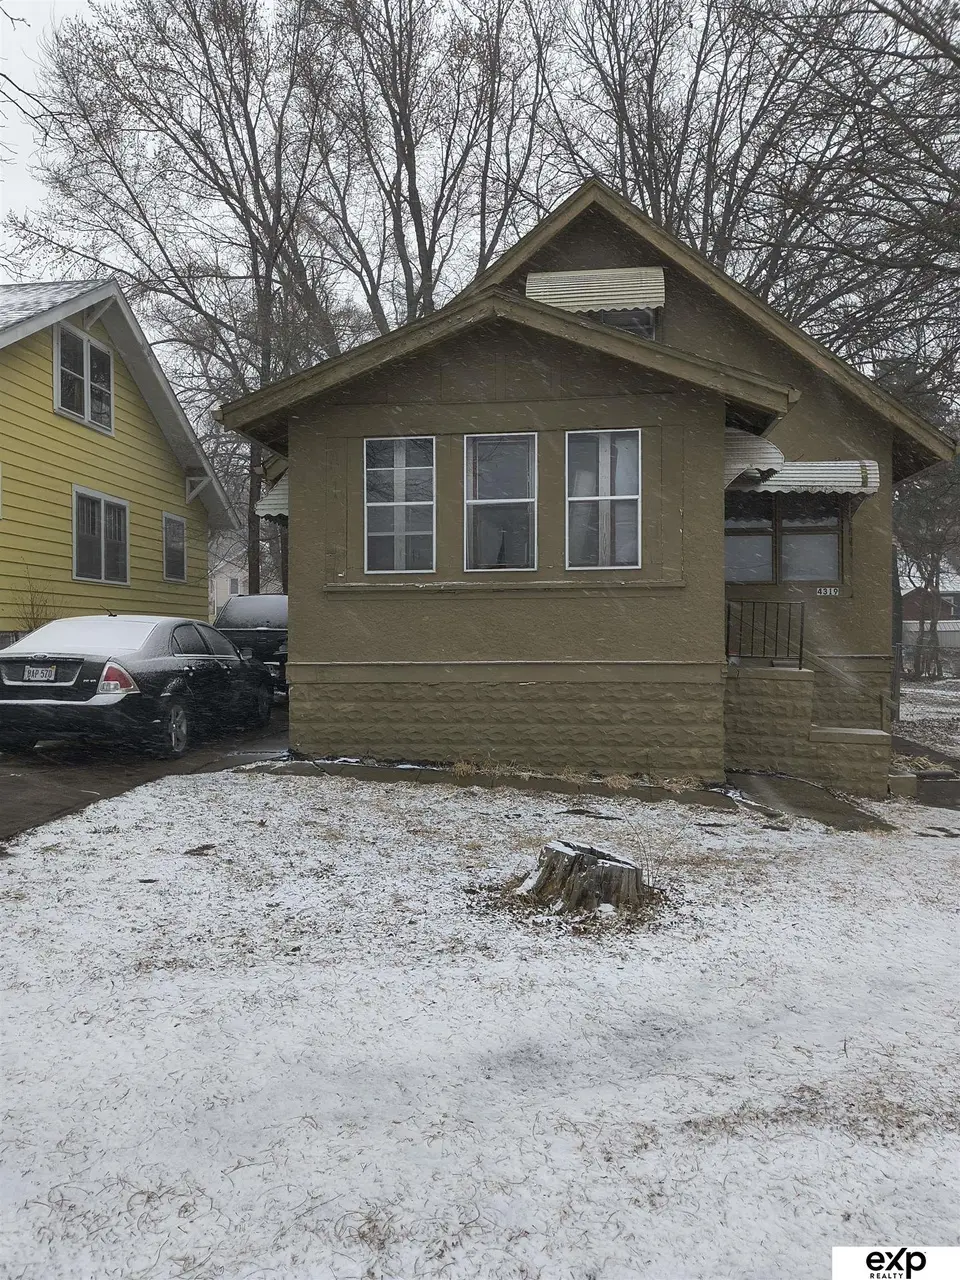
4319 N 40 St · Omaha, NE
Flood risk 1/10 · Minimal
- FEMA flood zone
- X (unshaded)
- Chance of flooding over 30 yrs
- 0.0%
- Est. flood insurance / yr
- $473 – $860
Fire risk 1/10 · Minimal
- Est. fire insurance / yr
- $1,161 – $2,155
Heat risk 3/10 · Minor
- Hot days now (above 105°F)
- 7 days/yr
- Hot days in 30 yrs
- 15 days/yr
Wind risk 2/10 · Minimal
- Chance of severe wind over 30 yrs
- —
Air-quality risk 2/10 · Minimal
- Unhealthy air days now
- 0 days/yr
- Unhealthy air days in 30 yrs
- 1 days/yr
Risk factors via First Street. Map © Google.
Why this score? — see what drove the A grade
The composite is a weighted blend of 9 inputs, each scored 0–100. Each bar is that input's sub-score; the figure is the points it added to the 100-point composite (weight × sub-score).
- Cash flow +30.0/30.0
- ARV discount +15.0/15.0
- 1% rule +10.0/10.0
- DSCR +10.0/10.0
- Appreciation +10.0/10.0
- Livability +4.2/5.0
- Rent growth +3.3/5.0
- Condition / age +2.5/5.0
- Schools +2.1/10.0
$99,900
🖨 Deal sheet (PDF) 📄 Offer letter ✓ Due diligence
Listing remarks MLS
AGENT HAS NEVER BEEN INSIDE PROPERTY. Outside showings only currently occupied and bank owned All information from assessor site
Key facts
- 0.24 acre lot
- Garage
- Built 1916
Neighborhood map
What this means for you Summary
Snapshot
- This is a 4-bed/2.0-bath other listed at $100k.
Deal economics
- At list price, monthly cash flow is $712 ($9k/yr) — positive.
- The deal already cash-flows at list — no discount required.
- Meets the 1% rule at list price ($2k rent vs $100k).
- Recommended offer: $98k (1.5% below list) — sets the bar for market timing.
- Cap rate 14.8% vs local median 3.6% in Omaha — top-decile yield for the area; either an underpriced asset or a hidden risk that comps aren't pricing in. Stress-test before assuming the spread holds.
Location & tenants
- Location reads 84/100 on livability (#7 in NE, #663 nationally) — a professional / high-income tenant draw. Strengths: amenities A+, commute A+, cost of living A+; Watch: crime F.
- Omaha Public Schools (urban): math 20% / reading 28% proficiency, ranked #110 of 111 in NE (top 99%) — low school quality limits family demand, transient renter base, plan for 1-2y turnover; 62% free/reduced lunch — lower-income household profile, screen leases tightly.
- Market conditions: Rents rising (+3.2%/yr); 139 active listings in the ZIP; 19 comparable units currently listed for rent nearby; rentals at typical pace (median 25d on market — plan ~3-4 weeks tenant-placement turnaround); 47% of comp listings sitting > 30 days — soft ceiling on asking rent; lower-income renter base — watch delinquency; 4,539 units permitted in Douglas County in 2024 (2,583 in 5+ unit buildings).
- At $1,790/mo this rent would consume 51% of the median local household income ($42k/yr) (locally 1913% of renters already pay >50% of income on rent) — very limited rent-growth headroom before tenants either downsize or default.
Forward outlook
- In year one you build about $11k of equity ($691 loan paydown + $10k appreciation (10.0% local appreciation)).
- Douglas County population projected at +28% by 2050 — long-run rental-demand tailwind backs the buy-and-hold thesis.
- At projected returns (10.0% appreciation + 3.2% rent growth), your $28k cash investment doubles in ~2 years — after that, you're playing with house money.
- By year 4, paydown + projected appreciation supports a ~$38k cash-out refi (75% LTV) — recoverable capital for the next deal without selling this one.
Negotiation context
- It's been on market 28 days — a 2% lower offer ($98k) is reasonable based on typical stale-listing flexibility.
- 8 sale attempts since 12y ago with the ask held roughly flat each time — persistent listings suggest the price (not the market) is what's stuck; bring a comps-based counter.
Risks & watch-outs
- Watch-outs: built in 1916 — expect roof / HVAC / electrical / plumbing capex.
Questions for the listing agent
- Built in 1916 — when were the roof, HVAC, electrical panel, plumbing, and water heater last replaced?
- Is there a deadline driving the sale (1031 exchange, divorce, estate, relocation)? That informs how much negotiation room exists.
- Crime grade is F in this area — have there been break-ins, vandalism, or insurance claims at this property in the last 3 years? What carrier currently insures it and at what premium?
- What's the average days-on-market for RENTAL listings here right now (not sales)? A rising rental-DOM trend means longer vacancies and softer asking-rent achievability than the comps imply.
- What's the recent tenant-quality profile in this submarket — average credit score on applications, eviction rate, late-payment / NSF rate, and stable-employment percentage? A property-management company in the area should have these aggregated.
- How much new for-sale + rental construction is in the pipeline within 1–3 miles? Heavy new supply typically softens prices + rents 12–24 months out; constrained supply supports both.
Investment metrics
- 1% rule
- 1.79% ✓
- Cap rate
- 14.85%
- Cash-on-cash
- 30.55%
- DSCR
- 2.36
- GRM
- 4.7
CMA / ARV
- ARV (median comp)
- $175,176
- List price
- $99,900
- Delta
- -42.97%
- Verdict
- UNDERPRICED
- Comps
- 20 within 1.0 mi
Projected returns pro-forma
10.0% appreciation · 3.22% rent growth · sell at horizon
- IRR
- 47.7%
- Equity multiple
- 4.58×
- Total profit
- $100,194
- Equity at exit
- $89,998
- IRR
- 41.6%
- Equity multiple
- 10.30×
- Total profit
- $260,270
- Equity at exit
- $194,084
Cash invested: $27,972 (down + closing). Projections, not guarantees.
Landlord ↔ Tenant lean methodology
- Overall (STATE)
- 83 Strongly Landlord-Friendly
- State Nebraska
- 83 Strongly Landlord-Friendly · R+13
- County
- — inherits STATE
- City
- — inherits STATE
ZIP-level market 68111
- Home prices YoY
- 4.0%
- Rents YoY
- 3.2%
- Active inventory
- 139
- Price-to-rent
- 4.7×
Monthly cashflow live
- Estimated rent
- $1,790 high interval (Pro) →
- Mortgage (P&I)
- −$524
- Tax from tax record
- −$137 /mo · $1,639/yr
- Insurance
- −$42
- HOA
- −$0
- Vacancy / Maint / Mgmt
- −$376
- Net cashflow
- $712
Break-even live
Sensitivity live
| Price | -10% $769 | -5% $740 | +0% $712 | +5% $684 | +10% $656 |
|---|---|---|---|---|---|
| Rent | -10% $571 | -5% $641 | +0% $712 | +5% $783 | +10% $854 |
| Rate | -1.0pp $762 | -0.5pp $738 | base $712 | +0.5pp $686 | +1.0pp $660 |
UW: 25.0% down · 7.5% · 30yr · 1.5% tax · 5.0% vac · 8.0% maint · 8.0% mgmt
Financing live
Cash to close
- Down payment
- $24,975
- Closing costs
- $2,997
- Reserves months
- —
- Total cash needed
- —
Loan-product check · same deal, 3 products live
Conventional
25% down · 7.5% · 30yr
- Down + closing
- —
- Monthly P&I
- —
- Monthly cashflow
- —
- DSCR
- —
- Eligible?
- —
Personal DTI + credit; lowest rate.
DSCR
20% down · 8.5% · 30yr
- Down + closing
- —
- Monthly P&I
- —
- Monthly cashflow
- —
- DSCR
- —
- Eligible?
- —
No personal income docs; deal must DSCR.
Hard money
10% down · 12.0% · 12mo
- Down + closing
- —
- Monthly P&I
- —
- Monthly cashflow
- —
- DSCR
- —
- Eligible?
- —
Short-term bridge; refi at stabilization.
Rent comps 19 comps
| Address | Beds | Baths | Sqft | Rent | $/sqft | DOM | Units | Dist |
|---|---|---|---|---|---|---|---|---|
| 4707 N 40th Ave Omaha, NE | 3.0 | 1.0 | 1337 | $1,500 | $1.12 | 22d | 1 | 0.27mi |
| 4240 Fowler Ave Omaha, NE | 4.0 | 2.0 | 1956 | $1,895 | $0.97 | 24d | 1 | 0.38mi |
| 3535 N 45th Ave Omaha, NE | 3.0 | 1.0 | 1325 | $1,800 | $1.36 | 44d | 1 | 0.66mi |
| 3808 N 48th St Omaha, NE | 3.0 | 2.0 | 1400 | $2,000 | $1.43 | 3d | 1 | 0.78mi |
| 3508 N 47th Ave Omaha, NE | 3.0 | 1.0 | 1425 | $1,600 | $1.12 | 20d | 1 | 0.83mi |
| 4657 Camden Ave Omaha, NE | 3.0 | 1.0 | 1250 | $1,500 | $1.20 | 44d | 1 | 0.86mi |
| 4276 Binney St Omaha, NE | 4.0 | 1.0 | 1358 | $1,495 | $1.10 | 44d | 1 | 0.92mi |
| 3002 N 48th Ave Omaha, NE | 4.0 | 2.0 | 1205 | $1,550 | $1.29 | 24d | 1 | 1.13mi |
| 4874 Maple St Omaha, NE | 3.0 | 1.0 | 1098 | $1,545 | $1.41 | 44d | 1 | 1.20mi |
| 2914 N 49th Ave Omaha, NE | 3.0 | 1.0 | 1375 | $1,615 | $1.17 | 24d | 1 | 1.24mi |
| 2416 Fowler Ave Omaha, NE | 4.0 | 2.0 | 2169 | $1,950 | $0.90 | 15d | 1 | 1.25mi |
| 4706 Kansas Ave Omaha, NE | 5.0 | 2.0 | 1412 | $1,750 | $1.24 | 15d | 1 | 1.29mi |
| 4114 N 54th St Omaha, NE | 3.0 | 2.0 | 1683 | $1,745 | $1.04 | 3d | 1 | 1.34mi |
| 4655 Curtis Ave Omaha, NE | 3.0 | 2.0 | 2000 | $1,900 | $0.95 | 44d | 1 | 1.34mi |
| 2873 Kansas Ave Omaha, NE | 3.0 | 2.0 | 1112 | $1,450 | $1.30 | 24d | 1 | 1.39mi |
| 4026 Bauman Ave Omaha, NE | 4.0 | 1.0 | 1350 | $1,695 | $1.26 | 44d | 1 | 1.42mi |
| 5348 N 25th St Omaha, NE | 4.0 | 1.0 | 1446 | $1,600 | $1.11 | 44d | 1 | 1.42mi |
| 5011 Miami St Omaha, NE | 3.0 | 3.0 | 2180 | $2,200 | $1.01 | 44d | 1 | 1.42mi |
| 4201 N 22nd St Omaha, NE | 3.0 | 1.0 | 1380 | $1,545 | $1.12 | 44d | 1 | 1.44mi |
Listing history 22 events
-
2026-05-08status Pending 129-char remark
Show marketing remark (129 chars)
AGENT HAS NEVER BEEN INSIDE PROPERTY. Outside showings only currently occupied and bank owned All information from assessor site
-
2026-04-06$99,900 New 129-char remark
Show marketing remark (129 chars)
AGENT HAS NEVER BEEN INSIDE PROPERTY. Outside showings only currently occupied and bank owned All information from assessor site
-
2023-04-14soldstatus $1,375,000
-
2021-06-05historical
-
2020-12-31price $89,900
-
2020-12-08$79,900 Active - New
-
2020-06-20historical
-
2020-01-17$70,000 Active - New
-
2020-01-04historical
-
2019-07-06price $70,000
-
2019-07-03$65,000 Active - New
-
2019-07-01historical
-
2019-03-31price $70,000
-
2018-12-30$65,000 Active - New
-
2018-12-05historical
-
2018-07-04$65,000 Active - New
-
2018-06-07historical
-
2017-12-16$65,000 Active - New
-
2015-04-01historical
-
2014-10-08$59,800 Active
-
2008-02-19soldstatus $375,000
-
2006-09-15soldstatus $937,333
ⓘ Source: listings_history table (triggers on properties + properties_extension) + one-shot
backfill from property_details.listing_events for pre-trigger history.
Tax reassessment forecast NE · Resets to sale price
- Current annual tax
- $1,639 · $137/mo
- Projected year-2 tax
- $1,728 · $144/mo
- Expected delta
- +$90/yr (+$7/mo · 5.5%)
ⓘ Screening estimate from a state-policy table — verify with the county assessor before closing.
Climate risk First Street
- Flood 1/10 Low FEMA zone X (unshaded) · 0% chance over 30 yrs
- Wildfire 1/10 Low
- Heat 3/10 Moderate 7 d/yr ≥105°F today · 15 d/yr by 30 yrs out
- Wind 2/10 Low
- Air quality 2/10 Low 0 unhealthy d/yr today · 1 by 30 yrs out
Nearby sold comps map
Loading sold comps map…
Walkable amenities ~0.75 mi
Loading nearby amenities…
Taxation est. · year 1
- Rental income
- $21,481
- − Mortgage interest
- −$5,596
- − Property taxes
- −$1,639
- − Insurance
- −$500
- − Repairs & maintenance
- −$1,718
- − Management
- −$1,718
- − Depreciation
- −$2,906
- Taxable income
- $7,404
- Est. tax owed @ 24.0%
- −$1,777
- After-tax cash flow
- $6,768/yr
For passive investors: Depreciation is non-cash, so a rental often shows a tax loss while cash-flowing — sheltering income. Rental losses are passive: they offset passive income freely, and up to $25,000/yr can offset ordinary (W-2) income if you actively participate and your MAGI is under $100k (phasing out to $0 by $150k); unused losses carry forward. On sale, claimed depreciation is recaptured at up to 25%, and gains may owe capital-gains tax (a 1031 exchange can defer both). Figures are a year-1 estimate at your 24.0% rate — not tax advice; consult a CPA.
Schools (NCES district)
- District
- Omaha Public Schools
- NCES district ID
- 3174820
- Math proficiency
- 20% ▼ -10.00%
- Reading proficiency
- 28% ▼ -5.00%
- Median HH income
- $46,039
- Composite
- 20.83/100
- National rank
- #8502
- State rank
- #110 of 111 in NE
Livability — Omaha
- Score
- 84/100
- State rank
- #7
- US rank
- #663
Category grades
Schools grade is shown separately in the Schools card above.
Census & demographics
- Census place
- Omaha, NE
- County
- Douglas County · 538,646 people
- City population
- 552,986
- Metro
- Omaha-Council Bluffs, NE-IA
- Population (ZIP)
- 24,210
- Household income
- $42,185
- Rent vs Own
- Severe rent burden
- 1913.0
Population outlook (Douglas County) Hauer SSP2
- Today (2025)
- 625,245 people
- By 2030
- 661,613 · +5.8%
- By 2040
- 732,395 · +17.1%
- By 2050
- 801,988 · +28.3%
- By 2075
- 968,637 · +54.9%
- By 2100
- 1,101,871 · +76.2%
Race, ethnicity, and origin ACS 2023
- Neighborhood character
- Diverse neighborhood (Simpson 0.65)
- Race & ethnicity
- Black 52% Hispanic / Latino 21% White 17% Two or more races 15% Asian 3% Native American 1%
- Hispanic origin (detail)
- Mexican 14%
- Common ancestry
- Ukrainian 3% Lithuanian 0%
- Foreign-born
- 14% · Canada, Philippines
- Languages at home
- 75% English-only · Spanish 16% Other Asian/Pacific 3% French/Haitian/Cajun 1%
Political lean MEDSL · Douglas
- 2024 margin
- D (+10.2) · D 54.4% · R 44.2% · Other 1.4%
- 2008→2024 swing
- +5.5pp toward D · 2008: 4.6pp · 2024: 10.2pp
- All cycles
- 2024: D+10.2 2020: D+11.3 2016: D+1.4 2012: R+4.3 2008: D+4.6
Not yet ingested
- Civics
- —
Market trends
- HPI YoY
- ▲ 13.82%
- Current HPI
- 358.7174
- Rent YoY
- ▲ 3.22%
- Metro
- Omaha-Council Bluffs, NE-IA
- State GDP YoY
- ▲ 0.68%
- F500 in state
- 2
Industry mix (Fortune 500 HQ in NE)
| Industry | F500 HQs | Revenue |
|---|---|---|
| Conglomerate | 1 | $371B |
|
||
Price history
-89.3% since first listed22 events — show timeline
- 2026-05-08 Pending — GPRMLS
- 2026-04-06 Listed $99,900 GPRMLS
- 2023-04-14 Sold (Public Records) $1,375,000 Public Records
- 2021-06-05 Listing Removed — GPRMLS
- 2020-12-31 Price Changed $89,900 GPRMLS
- 2020-12-08 Listed $79,900 GPRMLS
- 2020-06-20 Listing Removed — GPRMLS
- 2020-01-17 Listed $70,000 GPRMLS
- 2020-01-04 Listing Removed — GPRMLS
- 2019-07-06 Price Changed $70,000 GPRMLS
- 2019-07-03 Listed $65,000 GPRMLS
- 2019-07-01 Listing Removed — GPRMLS
- 2019-03-31 Price Changed $70,000 GPRMLS
- 2018-12-30 Listed $65,000 GPRMLS
- 2018-12-05 Listing Removed — GPRMLS
- 2018-07-04 Listed $65,000 GPRMLS
- 2018-06-07 Listing Removed — GPRMLS
- 2017-12-16 Listed $65,000 GPRMLS
- 2015-04-01 Listing Removed — GPRMLS
- 2014-10-08 Listed $59,800 GPRMLS
- 2008-02-19 Sold (Public Records) $375,000 Public Records
- 2006-09-15 Sold (Public Records) $937,333 Public Records
Property tax history
+4.5%/yrLatest (2025): $1,639 · +0.8% YoY. Source: county tax records.
Cash-flow waterfall
monthlySold comps — $/sqft
last 12 mo · ≤1 miLoading sold comps…