2535 Madison St · Altamont, OR
Flood risk 1/10 · Minimal
- FEMA flood zone
- X
- Chance of flooding over 30 yrs
- 0.0%
- Est. flood insurance / yr
- $507 – $1,088
Fire risk 6/10 · Moderate
- Est. fire insurance / yr
- $498 – $926
Heat risk 3/10 · Minor
- Hot days now (above 90°F)
- 7 days/yr
- Hot days in 30 yrs
- 17 days/yr
Wind risk 1/10 · Minimal
- Chance of severe wind over 30 yrs
- —
Air-quality risk 10/10 · Severe
- Unhealthy air days now
- 38 days/yr
- Unhealthy air days in 30 yrs
- 39 days/yr
Risk factors via First Street. Map © Google.
Why this score? — see what drove the C grade
The composite is a weighted blend of 9 inputs, each scored 0–100. Each bar is that input's sub-score; the figure is the points it added to the 100-point composite (weight × sub-score).
- Cash flow +25.1/30.0
- DSCR +8.2/10.0
- ARV discount +7.5/15.0
- 1% rule +6.7/10.0
- Rent growth +3.5/5.0
- Livability +3.2/5.0
- Schools +2.5/10.0
- Condition / age +2.5/5.0
- Appreciation +0.0/10.0
$120,000
🖨 Deal sheet (PDF) 📄 Offer letter ✓ Due diligence
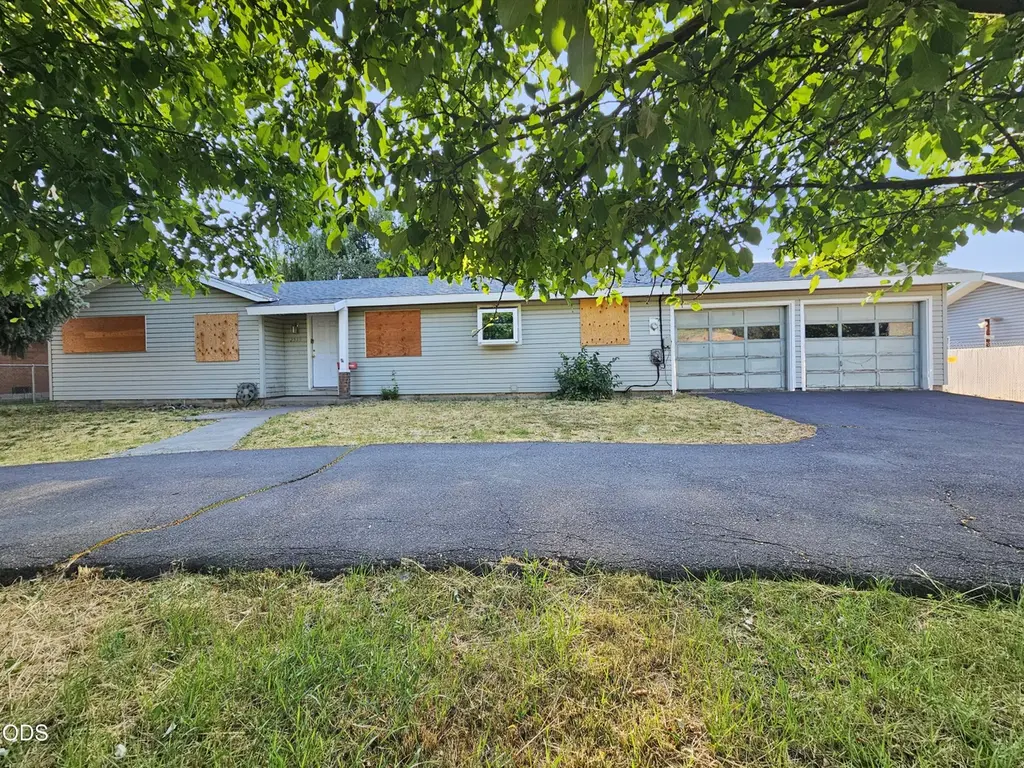
Listing remarks
This 3 bedroom home with shop is located in the suburbs on large . 46 acre lot! Attached 2 car garage plus it has a 30x48 shop with 2 tall doors. There is a fireplace in the living room and it has built in cabinets on the wall.
Key facts
- Attached garage
- Large lot
- 30x48 shop
Tags
Property features AI
Finance
- Financial info: Property is not rented
- HOA & community: No CCRs
Exterior
- Parking: 2-car garage; Driveway parking
- Security: No audio or video surveillance on premises
- Utilities: Public water; Public sewer
- Home design: Single family residence; One story; Built in 1969; No accessory dwelling unit; No common walls
- Construction: Concrete perimeter foundation; Composition roofing; Built in 1969
- Exterior features: Composition roof; Workshop on property; Lot is approximately 0.46 acres; Zoned RS
Interior
- Kitchen: Kitchen (appliances not specified)
- Bedrooms: 3 bedrooms
- Flooring: Carpet; Vinyl
- Bathrooms: 1 full bathroom
- Heating & cooling: Forced air heating; No cooling system
- Interior features: Carpet and vinyl flooring; Living room; Kitchen; Laundry room
- Laundry & utility: Laundry room (washer/dryer not specified)
Neighborhood map
What this means for you Summary
Snapshot
- This is a 3-bed/1.5-bath single-family listed at $120k.
Deal economics
- At list price, monthly cash flow is $264 ($3k/yr) — positive.
- The deal already cash-flows at list — no discount required.
- Meets the 1% rule at list price ($1k rent vs $120k).
- Cap rate 8.9% vs local median 3.7% in Altamont — top-decile yield for the area; either an underpriced asset or a hidden risk that comps aren't pricing in. Stress-test before assuming the spread holds.
Location & tenants
- Location reads 65/100 on livability (#195 in OR) — a middle-class / working-renter tenant base. Strengths: cost of living A+, housing A+; Watch: health & safety C-, employment D, crime F.
- Klamath County SD (rural): math 21% / reading 37% proficiency, ranked #46 of 58 in OR (top 79%) — low school quality limits family demand, transient renter base, plan for 1-2y turnover.
- Zoned schools: Ferguson Elementary School (math 27% / reading 37%, grade F, #246 of 412 statewide, top 60%, 539 students, 74% FRL); Henley Middle School (math 22% / reading 47%, grade F, #61 of 128 statewide, top 54%, 419 students, 72% FRL); Henley High School (693 students, 73% FRL).
- Market conditions: Rents rising (+3.8%/yr); 264 active listings in the ZIP; 10 comparable units currently listed for rent nearby; rentals lingering (median 46d on market — plan ~5-8 weeks vacancy on turnover, expect pricing pressure); 100% of comp listings sitting > 30 days — soft ceiling on asking rent; 232 units permitted in Klamath County in 2024 (72 in 5+ unit buildings).
Forward outlook
- Local home prices are declining (-3.0%/yr); year-one equity from $830 of loan paydown is wiped out by about $4k of value loss. Plan a longer hold.
- Klamath County population projected at -12% by 2050 — secular population decline; favor cash flow + early exit over multi-decade hold.
- At projected returns (-3.0% appreciation + 3.8% rent growth), your $34k cash investment doubles in ~10 years — after that, you're playing with house money.
Negotiation context
- Only 14 days on market — expect competitive offers; lowballing is unlikely to land.
- 2 sale attempts since 10y ago with the ask held roughly flat each time — persistent listings suggest the price (not the market) is what's stuck; bring a comps-based counter.
Risks & watch-outs
- Climate carrying-cost: major wildfire risk — expect insurance premiums to compound above CPI over the hold.
Questions for the listing agent
- Built in 1969 — when were the roof, HVAC, electrical panel, plumbing, and water heater last replaced?
- Is there a deadline driving the sale (1031 exchange, divorce, estate, relocation)? That informs how much negotiation room exists.
- Crime grade is F in this area — have there been break-ins, vandalism, or insurance claims at this property in the last 3 years? What carrier currently insures it and at what premium?
- What's the average days-on-market for RENTAL listings here right now (not sales)? A rising rental-DOM trend means longer vacancies and softer asking-rent achievability than the comps imply.
- What's the recent tenant-quality profile in this submarket — average credit score on applications, eviction rate, late-payment / NSF rate, and stable-employment percentage? A property-management company in the area should have these aggregated.
- How much new for-sale + rental construction is in the pipeline within 1–3 miles? Heavy new supply typically softens prices + rents 12–24 months out; constrained supply supports both.
Investment metrics
- 1% rule
- 1.17% ✓
- Cap rate
- 8.93%
- Cash-on-cash
- 9.41%
- DSCR
- 1.42
- GRM
- 7.1
CMA / ARV
- ARV (on-the-fly)
- $290,334
- Comps found
- 12
Show comp detail 12 sales within ~0.75 mi
| Address | Dist | Beds/Ba | Sqft | Sold | Price | $/sf | Match |
|---|---|---|---|---|---|---|---|
| 5700 Schiesel Ave | 0.15mi | 3/1.0 | 1,066 (-9%) | 5mo | $167,000 | $157 | 73 |
| 2780 Windsor Ave | 0.40mi | 3/1.5 | 1,100 (-6%) | 3mo | $290,000 | $264 | 69 |
| 6160 Delaware Ave | 0.30mi | 3/1.0 | 1,095 (-6%) | 6mo | $300,000 | $274 | 69 |
| 5638 Bel Aire Dr | 0.11mi | 3/1.0 | 1,064 (-9%) | 13mo | $189,500 | $178 | 67 |
| 6208 Hilyard Ave | 0.44mi | 3/1.0 | 1,267 (+9%) | 1mo | $315,000 | $249 | 62 |
| 1920 Homedale Rd | 0.52mi | 3/2.0 | 1,186 (+2%) | 13mo | $300,000 | $253 | 60 |
| 3219 Homedale Rd | 0.51mi | 3/1.0 | 1,076 (-8%) | 4mo | $263,168 | $245 | 58 |
| 2783 Diane Dr | 0.34mi | 3/2.0 | 1,308 (+12%) | 5mo | $320,000 | $245 | 58 |
| 3345 Madison St | 0.62mi | 3/2.0 | 1,252 (+7%) | 0mo | $285,000 | $228 | 56 |
| 6225 Maryland Ave | 0.38mi | 3/1.5 | 1,298 (+11%) | 10mo | $339,000 | $261 | 55 |
| 5440 Cottage Ave | 0.40mi | 3/1.5 | 1,290 (+11%) | 15mo | $230,000 | $178 | 51 |
| 5705 Casa Way | 0.65mi | 3/1.0 | 1,069 (-8%) | 7mo | $270,000 | $253 | 48 |
Match score weights: distance 35% · size 25% · config 20% · recency 20%. Top-matched comps best support the ARV.
Projected returns pro-forma
-3.0% appreciation · 3.8% rent growth · sell at horizon
- IRR
- -1.2%
- Equity multiple
- 0.96×
- Total profit
- $-1,490
- Equity at exit
- $17,892
- IRR
- 9.4%
- Equity multiple
- 1.75×
- Total profit
- $25,181
- Equity at exit
- $10,375
Cash invested: $33,600 (down + closing). Projections, not guarantees.
Landlord ↔ Tenant lean methodology
- Overall (STATE)
- 28 Tenant-Leaning
- State Oregon
- 28 Tenant-Leaning · D+6
- County
- — inherits STATE
- City
- — inherits STATE
ZIP-level market 97603
- Rents YoY
- 3.8%
- Active inventory
- 264
- Price-to-rent
- 7.1×
Monthly cashflow live
- Estimated rent
- $1,400 high interval (Pro) →
- Mortgage (P&I)
- −$629
- Tax from tax record
- −$163 /mo · $1,961/yr
- Insurance
- −$50
- HOA
- −$0
- Vacancy / Maint / Mgmt
- −$294
- Net cashflow
- $264
Break-even live
Sensitivity live
| Price | -10% $332 | -5% $298 | +0% $264 | +5% $230 | +10% $196 |
|---|---|---|---|---|---|
| Rent | -10% $153 | -5% $208 | +0% $264 | +5% $319 | +10% $374 |
| Rate | -1.0pp $324 | -0.5pp $294 | base $264 | +0.5pp $233 | +1.0pp $201 |
UW: 25.0% down · 7.5% · 30yr · 1.5% tax · 5.0% vac · 8.0% maint · 8.0% mgmt
Financing live
Cash to close
- Down payment
- $30,000
- Closing costs
- $3,600
- Reserves months
- —
- Total cash needed
- —
Loan-product check · same deal, 3 products live
Conventional
25% down · 7.5% · 30yr
- Down + closing
- —
- Monthly P&I
- —
- Monthly cashflow
- —
- DSCR
- —
- Eligible?
- —
Personal DTI + credit; lowest rate.
DSCR
20% down · 8.5% · 30yr
- Down + closing
- —
- Monthly P&I
- —
- Monthly cashflow
- —
- DSCR
- —
- Eligible?
- —
No personal income docs; deal must DSCR.
Hard money
10% down · 12.0% · 12mo
- Down + closing
- —
- Monthly P&I
- —
- Monthly cashflow
- —
- DSCR
- —
- Eligible?
- —
Short-term bridge; refi at stabilization.
Rent comps 10 comps
| Address | Beds | Baths | Sqft | Rent | $/sqft | DOM | Units | Dist |
|---|---|---|---|---|---|---|---|---|
| 2439 Homedale Rd Klamath Falls, OR | 3.0 | 1.0 | 1320 | $1,400 | $1.06 | 45d | 1 | 0.28mi |
| 3039 Kane St Klamath Falls, OR | 3.0 | 2.0 | 988 | $1,395 | $1.41 | 45d | 1 | 0.56mi |
| 1912 Dawn Ct Unit B Klamath Falls, OR | 2.0 | 1.0 | 1027 | $1,150 | $1.12 | 45d | 1 | 0.82mi |
| 4519 Cannon Ave Apt 2 Klamath Falls, OR | 2.0 | 1.0 | 850 | $1,050 | $1.24 | 45d | 1 | 0.85mi |
| 4519 Cannon Ave Unit 22 Klamath Falls, OR | 2.0 | 1.0 | 850 | $1,000 | $1.18 | 45d | 1 | 0.85mi |
| 4507 Cannon Ave Apt 52 Klamath Falls, OR | 2.0 | 1.0 | 850 | $1,000 | $1.18 | 45d | 1 | 0.89mi |
| 4195 Bristol Ct Klamath Falls, OR | 2.0 | 1.0 | 1080 | $1,350 | $1.25 | 45d | 1 | 1.30mi |
| 1616 Dayton St Klamath Falls, OR | 2.0 | 1.0 | 732 | $1,400 | $1.91 | 45d | 1 | 1.47mi |
| 1222 Summers Ln Unit 1222 Klamath Falls, OR | 2.0 | 1.0 | 950 | $1,450 | $1.53 | 45d | 1 | 1.48mi |
| 4170 Adelaide Ave Klamath Falls, OR | 2.0 | 1.5 | 1268 | $1,500 | $1.18 | 45d | 1 | 1.48mi |
Listing history 10 events
-
2026-06-22days on market $120,000 Active 14 DOM
-
2026-06-19days on market $120,000 Active 11 DOM
-
2026-06-18days on market $120,000 Active 10 DOM
-
2026-06-17days on market $120,000 Active 9 DOM
-
2026-06-16days on market $120,000 Active 8 DOM
-
2026-06-15days on market $120,000 Active 7 DOM
-
2026-06-14days on market $120,000 Active 5 DOM
-
2026-06-12days on market $120,000 Active 4 DOM
-
2026-06-09remarks 227-char remark
-
2026-06-09$120,000 Active 1 DOM
ⓘ Source: listings_history table (triggers on properties + properties_extension) + one-shot
backfill from property_details.listing_events for pre-trigger history.
Tax reassessment forecast OR · Resets to sale price
- Current annual tax
- $1,961 · $163/mo
- Projected year-2 tax
- $1,961 · $163/mo
- Expected delta
- $0/yr ($0/mo · -0.0%)
ⓘ Screening estimate from a state-policy table — verify with the county assessor before closing.
Climate risk First Street
- Flood 1/10 Low FEMA zone X · 0% chance over 30 yrs
- Wildfire 6/10 Major
- Heat 3/10 Moderate 7 d/yr ≥90°F today · 17 d/yr by 30 yrs out
- Wind 1/10 Low
- Air quality 10/10 Extreme 38 unhealthy d/yr today · 39 by 30 yrs out
Nearby sold comps map
Loading sold comps map…
Walkable amenities ~0.75 mi
Loading nearby amenities…
Taxation est. · year 1
- Rental income
- $16,805
- − Mortgage interest
- −$6,722
- − Property taxes
- −$1,961
- − Insurance
- −$600
- − Repairs & maintenance
- −$1,344
- − Management
- −$1,344
- − Depreciation
- −$3,491
- Taxable income
- $1,342
- Est. tax owed @ 24.0%
- −$322
- After-tax cash flow
- $2,841/yr
For passive investors: Depreciation is non-cash, so a rental often shows a tax loss while cash-flowing — sheltering income. Rental losses are passive: they offset passive income freely, and up to $25,000/yr can offset ordinary (W-2) income if you actively participate and your MAGI is under $100k (phasing out to $0 by $150k); unused losses carry forward. On sale, claimed depreciation is recaptured at up to 25%, and gains may owe capital-gains tax (a 1031 exchange can defer both). Figures are a year-1 estimate at your 24.0% rate — not tax advice; consult a CPA.
Schools (NCES district)
- District
- Klamath County SD
- NCES district ID
- 4107020
- Math proficiency
- 21% ▼ -17.00%
- Reading proficiency
- 37% ▼ -16.00%
- Median HH income
- $44,906
- Composite
- 24.83/100
- National rank
- #7593
- State rank
- #46 of 58 in OR
Livability — Altamont
- Score
- 65/100
- State rank
- #195
- US rank
- #12638
Category grades
Schools grade is shown separately in the Schools card above.
Census & demographics
- Census place
- Altamont, OR
- County
- Klamath County · 56,186 people
- Metro
- Klamath Falls, OR
- Population (ZIP)
- 33,222
- Household income
- $66,937
- Rent vs Own
- Severe rent burden
- 1147.0
Population outlook (Klamath County) Hauer SSP2
- Today (2025)
- 63,870 people
- By 2030
- 62,279 · -2.5%
- By 2040
- 58,891 · -7.8%
- By 2050
- 56,207 · -12.0%
- By 2075
- 51,239 · -19.8%
- By 2100
- 46,526 · -27.2%
Race, ethnicity, and origin ACS 2023
- Neighborhood character
- Predominantly White (73%)
- Race & ethnicity
- White 73% Hispanic / Latino 15% Two or more races 13% Native American 2%
- Hispanic origin (detail)
- Mexican 13%
- Common ancestry
- Portuguese 5% Italian 4% Lithuanian 3%
- Foreign-born
- 4% · Canada, China
- Languages at home
- 91% English-only · Spanish 7%
Political lean MEDSL · Klamath
- 2024 margin
- Solid R (+41.9) · D 27.9% · R 69.8% · Other 2.4%
- 2008→2024 swing
- -8.8pp toward R · 2008: -33.1pp · 2024: -41.9pp
- All cycles
- 2024: R+41.9 2020: R+40.6 2016: R+44.8 2012: R+38.2 2008: R+33.1
Not yet ingested
- Civics
- —
Market trends
- HPI YoY
- ▼ -122.75%
- Current HPI
- 198.1814
- Rent YoY
- ▲ 3.80%
- Metro
- Klamath Falls, OR
- State GDP YoY
- ▲ 2.05%
- F500 in state
- 2
Industry mix (Fortune 500 HQ in OR)
| Industry | F500 HQs | Revenue |
|---|---|---|
| Consumer Goods | 1 | $51B |
|
||
Price history
-11.0% since first listed3 events — show timeline
- 2026-06-08 Listed $120,000 MLSCO
- 2020-04-26 Listing Removed — MLSCO
- 2016-04-05 Listed $134,900 MLSCO
Property tax history
+3.0%/yrLatest (2025): $1,961 · -23.3% YoY. Source: county tax records.
Cash-flow waterfall
monthlySold comps — $/sqft
last 12 mo · ≤1 miLoading sold comps…