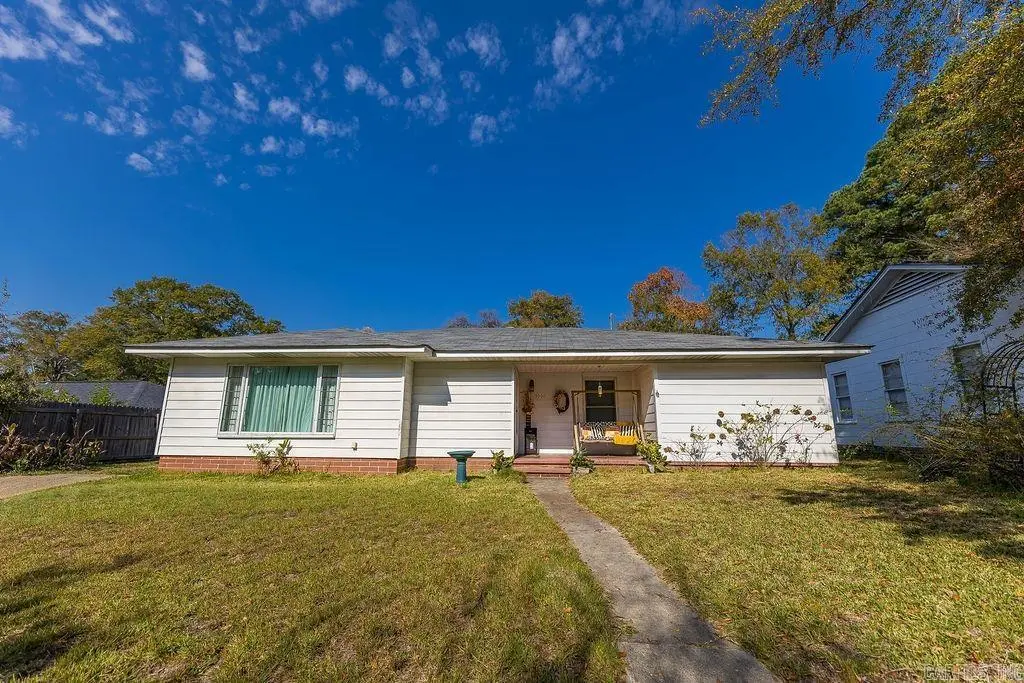
1306 W Main St · El Dorado, AR
Flood risk 1/10 · Minimal
- FEMA flood zone
- X (unshaded)
- Chance of flooding over 30 yrs
- 0.0%
- Est. flood insurance / yr
- $507 – $1,088
Fire risk 2/10 · Minimal
- Est. fire insurance / yr
- $1,499 – $2,785
Heat risk 7/10 · Major
- Hot days now (above 111°F)
- 7 days/yr
- Hot days in 30 yrs
- 21 days/yr
Wind risk 6/10 · Moderate
- Chance of severe wind over 30 yrs
- 40.0%
Air-quality risk 1/10 · Minimal
- Unhealthy air days now
- 0 days/yr
- Unhealthy air days in 30 yrs
- 0 days/yr
Risk factors via First Street. Map © Google.
Why this score? — see what drove the D+ grade
The composite is a weighted blend of 9 inputs, each scored 0–100. Each bar is that input's sub-score; the figure is the points it added to the 100-point composite (weight × sub-score).
- ARV discount +15.0/15.0
- Cash flow +14.8/30.0
- DSCR +4.5/10.0
- Livability +3.5/5.0
- 1% rule +3.0/10.0
- Schools +2.7/10.0
- Rent growth +2.5/5.0
- Condition / age +2.5/5.0
- Appreciation +0.0/10.0
$152,800
🖨 Deal sheet 📄 Offer letter ✓ Due diligence
Listing remarks
Well maintained home with 3 bedrooms, 2 bathrooms, plus bonus room overlooking fenced backyard. Perfect for pets, gardening and play. Enjoy a brand new dishwasher and faucets; a gas range stove and HVAC system that are only 4 years old. Glassed in bonus room not pictured.
Key facts
- Brand new dishwasher
- Fenced backyard
- Hvac system
Tags
Property features AI
Finance
- Other: Approx. 2,300 square feet (per appraisal); Approx. 0.22 acre lot (per appraisal)
Exterior
- Parking: Carport for 1 car
- Utilities: Public sewer; Public water; Municipal electric (including Entergy); Natural gas
- Home design: Metal/Vinyl siding and Masonite exterior
- Construction: Slab foundation; Composition roof
- Exterior features: Paved road access; Located inside city limits; Up slope lot; In subdivision
Interior
- Kitchen: Gas range; Dishwasher; Disposal; Pantry; Ice maker connection
- Flooring: Laminate flooring; Natural stone tile flooring
- Bathrooms: Two full bathrooms
- Heating & cooling: Central heating (gas); Central electric cooling; Zoned HVAC
- Interior features: Laminate and natural stone tile floors; Gas-log fireplace with gas starter; Bonus room; Laundry room
- Laundry & utility: Laundry room
Neighborhood map
What this means for you Summary
Snapshot
- This is a 3-bed/2.0-bath single-family listed at $153k.
Deal economics
- At list price, monthly cash flow is $43 ($518/yr) — positive.
- The deal already cash-flows at list — no discount required.
- To meet the 1% rule (rent ≥ 1% of price), the offer needs to be $122k (20.2% below list).
- Recommended offer: $122k (20.2% below list) — sets the bar for 1% rule.
- Cap rate 6.6% vs local median 4.1% in El Dorado — top-decile yield for the area; either an underpriced asset or a hidden risk that comps aren't pricing in. Stress-test before assuming the spread holds.
Location & tenants
- Location reads 69/100 on livability (#65 in AR) — a middle-class / working-renter tenant base. Strengths: cost of living A+, housing A+, health & safety A+; Watch: commute C-, schools D, employment D.
- El Dorado School District (town): math 32% / reading 34% proficiency, ranked #134 of 238 in AR (top 56%) — families likely to look elsewhere, expect single-tenant / working-renter base with shorter leases; 61% free/reduced lunch — lower-income household profile, screen leases tightly.
- Market conditions: 125 active listings in the ZIP; 20 units permitted in Union County in 2024 (0 in 5+ unit buildings).
Forward outlook
- Local home prices are declining (-3.0%/yr); year-one equity from $1k of loan paydown is wiped out by about $5k of value loss. Plan a longer hold.
- Union County population projected at -21% by 2050 — secular population decline; favor cash flow + early exit over multi-decade hold.
Negotiation context
- It's been on market 163 days — a 12% lower offer ($134k) is reasonable based on typical stale-listing flexibility.
- Current owner paid $88k; list at $153k implies a 75% gain — meaningful room to come down on a strong offer.
Risks & watch-outs
- Watch-outs: built in 1950 — expect roof / HVAC / electrical / plumbing capex.
- Climate carrying-cost: major wind risk, 40% chance of damaging wind over 30y; extreme-heat days projected 7→21/yr by 2055 (HVAC capex compounding) — expect insurance premiums to compound above CPI over the hold.
Questions for the listing agent
- It's been on market 163 days. Have you received any prior offers? Is the seller open to a 20% concession, seller financing, or rate buy-down credit?
- Built in 1950 — when were the roof, HVAC, electrical panel, plumbing, and water heater last replaced?
- Why hasn't it sold? Are there any deal-killer items the seller is aware of (foundation, flood, title, zoning, code violations)?
- Is there a deadline driving the sale (1031 exchange, divorce, estate, relocation)? That informs how much negotiation room exists.
- Schools are D-rated, which usually means shorter tenancies and higher turnover. Who's the typical renter profile here, and what's been the actual vacancy rate?
- Crime grade is F in this area — have there been break-ins, vandalism, or insurance claims at this property in the last 3 years? What carrier currently insures it and at what premium?
- The area grade is low — what's the realistic commute time and amenity access for the typical tenant pool here? Any planned neighborhood developments (good or bad) we should know about?
- What's the average days-on-market for RENTAL listings here right now (not sales)? A rising rental-DOM trend means longer vacancies and softer asking-rent achievability than the comps imply.
- What's the recent tenant-quality profile in this submarket — average credit score on applications, eviction rate, late-payment / NSF rate, and stable-employment percentage? A property-management company in the area should have these aggregated.
- How much new for-sale + rental construction is in the pipeline within 1–3 miles? Heavy new supply typically softens prices + rents 12–24 months out; constrained supply supports both.
Investment metrics
- 1% rule
- 0.80% ✗
- Cap rate
- 6.63%
- Cash-on-cash
- 1.21%
- DSCR
- 1.05
- GRM
- 10.4
CMA / ARV
- ARV (on-the-fly)
- $226,452
- Comps found
- 12
Show comp detail 12 sales within ~0.75 mi
| Address | Dist | Beds/Ba | Sqft | Sold | Price | $/sf | Match |
|---|---|---|---|---|---|---|---|
| 1609 W Cedar St | 0.18mi | 4/2.0 (+1) | 1,975 (-1%) | 1mo | $195,000 | $99 | 83 |
| 1114 W Oak St | 0.24mi | 3/2.0 | 2,050 (+2%) | 6mo | $212,000 | $103 | 80 |
| 1306 W Main St | 0.00mi | 3/2.0 | 2,277 (+14%) | 1mo | $149,000 | $65 | 77 |
| 1605 W Cedar | 0.17mi | 3/2.0 | 1,818 (-9%) | 2mo | $202,000 | $111 | 75 |
| 820 W Oak St | 0.40mi | 4/2.0 (+1) | 2,053 (+2%) | 1mo | $175,000 | $85 | 72 |
| 1315 Mount Holly Rd | 0.42mi | 3/2.0 | 2,100 (+5%) | 3mo | $350,000 | $167 | 70 |
| 1909 W Oak St | 0.46mi | 3/2.5 | 2,132 (+6%) | 5mo | $275,000 | $129 | 62 |
| 2009 Ridgewood Dr | 0.60mi | 3/2.0 | 2,175 (+8%) | 5mo | $288,500 | $133 | 54 |
| 2207 W Main St | 0.71mi | 4/2.0 (+1) | 2,064 (+3%) | 5mo | $269,500 | $131 | 53 |
| 501 Woodview Dr | 0.62mi | 3/2.5 | 2,173 (+8%) | 4mo | $285,000 | $131 | 52 |
| 708 Liberty | 0.57mi | 3/2.0 | 1,793 (-10%) | 6mo | $78,000 | $44 | 51 |
| 1114 W 4th St | 0.64mi | 4/2.0 (+1) | 1,760 (-12%) | 1mo | $199,000 | $113 | 44 |
Match score weights: distance 35% · size 25% · config 20% · recency 20%. Top-matched comps best support the ARV.
Projected returns pro-forma
-3.0% appreciation · 3.0% rent growth · sell at horizon
- IRR
- -14.4%
- Equity multiple
- 0.48×
- Total profit
- $-22,078
- Equity at exit
- $22,783
- IRR
- -5.8%
- Equity multiple
- 0.63×
- Total profit
- $-15,953
- Equity at exit
- $13,211
Cash invested: $42,784 (down + closing). Projections, not guarantees.
Landlord ↔ Tenant lean methodology
- Overall (STATE)
- 92 Strongly Landlord-Friendly
- State Arkansas
- 92 Strongly Landlord-Friendly · R+14
- County
- — inherits STATE
- City
- — inherits STATE
ZIP-level market 71730
- Home prices YoY
- -18.5%
- Active inventory
- 125
- Price-to-rent
- 10.4×
Monthly cashflow live
- Estimated rent
- $1,219 medium interval (Pro) →
- Mortgage (P&I)
- −$801
- Tax from tax record
- −$55 /mo · $656/yr
- Insurance
- −$64
- HOA
- −$0
- Vacancy / Maint / Mgmt
- −$256
- Net cashflow
- $43
Break-even live
UW: 25.0% down · 7.5% · 30yr · 1.5% tax · 5.0% vac · 8.0% maint · 8.0% mgmt
Financing live
Cash to close
- Down payment
- $38,200
- Closing costs
- $4,584
- Reserves months
- —
- Total cash needed
- —
Loan-product check · same deal, 3 products live
Conventional
25% down · 7.5% · 30yr
- Down + closing
- —
- Monthly P&I
- —
- Monthly cashflow
- —
- DSCR
- —
- Eligible?
- —
Personal DTI + credit; lowest rate.
DSCR
20% down · 8.5% · 30yr
- Down + closing
- —
- Monthly P&I
- —
- Monthly cashflow
- —
- DSCR
- —
- Eligible?
- —
No personal income docs; deal must DSCR.
Hard money
10% down · 12.0% · 12mo
- Down + closing
- —
- Monthly P&I
- —
- Monthly cashflow
- —
- DSCR
- —
- Eligible?
- —
Short-term bridge; refi at stabilization.
Listing history 5 events
-
2026-04-30status Under Contract
-
2026-02-20price $152,800
-
2025-10-24$160,000 New Listing
-
2002-12-06soldstatus $87,500
-
1996-03-01soldstatus $65,000
ⓘ Source: listings_history table (triggers on properties + properties_extension) + one-shot
backfill from property_details.listing_events for pre-trigger history.
Tax reassessment forecast AR · Resets to sale price
- Current annual tax
- $656 · $55/mo
- Projected year-2 tax
- $978 · $81/mo
- Expected delta
- +$322/yr (+$27/mo · 49.0%)
ⓘ Screening estimate from a state-policy table — verify with the county assessor before closing.
Climate risk First Street
- Flood 1/10 Low FEMA zone X (unshaded) · 0% chance over 30 yrs
- Wildfire 2/10 Low
- Heat 7/10 Severe 7 d/yr ≥111°F today · 21 d/yr by 30 yrs out
- Wind 6/10 Major 40% chance of damaging wind over 30 yrs
- Air quality 1/10 Low 0 unhealthy d/yr today · 0 by 30 yrs out
Nearby sold comps map
Loading sold comps map…
Walkable amenities ~0.75 mi
Loading nearby amenities…
Taxation est. · year 1
- Rental income
- $14,625
- − Mortgage interest
- −$8,559
- − Property taxes
- −$656
- − Insurance
- −$764
- − Repairs & maintenance
- −$1,170
- − Management
- −$1,170
- − Depreciation
- −$4,445
- Taxable loss
- −$2,140
- Est. tax savings @ 24.0%
- +$514
- After-tax cash flow
- $1,031/yr
For passive investors: Depreciation is non-cash, so a rental often shows a tax loss while cash-flowing — sheltering income. Rental losses are passive: they offset passive income freely, and up to $25,000/yr can offset ordinary (W-2) income if you actively participate and your MAGI is under $100k (phasing out to $0 by $150k); unused losses carry forward. On sale, claimed depreciation is recaptured at up to 25%, and gains may owe capital-gains tax (a 1031 exchange can defer both). Figures are a year-1 estimate at your 24.0% rate — not tax advice; consult a CPA.
Schools (NCES district)
- District
- El Dorado School District
- NCES district ID
- 0505680
- Math proficiency
- 32% ▼ -6.00%
- Reading proficiency
- 34% ▼ -6.00%
- Median HH income
- $36,122
- Composite
- 27.36/100
- National rank
- #6979
- State rank
- #134 of 238 in AR
Livability — El Dorado
- Score
- 69/100
- State rank
- #65
- US rank
- #8444
Category grades
Schools grade is shown separately in the Schools card above.
Census & demographics
- Census place
- El Dorado, AR
- Population (ZIP)
- 29,187
Population outlook (Union County) Hauer SSP2
- Today (2025)
- 37,422 people
- By 2030
- 35,808 · -4.3%
- By 2040
- 32,605 · -12.9%
- By 2050
- 29,688 · -20.7%
- By 2075
- 23,691 · -36.7%
- By 2100
- 17,950 · -52.0%
Race, ethnicity, and origin ACS 2023
- Neighborhood character
- Diverse neighborhood (Simpson 0.55)
- Race & ethnicity
- White 58% Black 32% Hispanic / Latino 6% Two or more races 4% Asian 1%
- Hispanic origin (detail)
- Mexican 5%
- Common ancestry
- Lithuanian 1% Italian 1% Serbian 1%
- Foreign-born
- 4% · Canada, China
- Languages at home
- 95% English-only · Spanish 4% Chinese 1%
Political lean MEDSL · Union
- 2024 margin
- Solid R (+33.5) · D 32.5% · R 66.0% · Other 1.5%
- 2008→2024 swing
- -7.4pp toward R · 2008: -26.1pp · 2024: -33.5pp
- All cycles
- 2024: R+33.5 2020: R+29.5 2016: R+27.8 2012: R+26.3 2008: R+26.1
Not yet ingested
- Civics
- —
Market trends
- HPI YoY
- ▼ -35.36%
- Current HPI
- 155.8786
- Rent YoY
- —
- Metro
- —
- State GDP YoY
- ▲ 3.80%
- F500 in state
- 10
Industry mix (Fortune 500 HQ in AR)
| Industry | F500 HQs | Revenue |
|---|---|---|
| Retail | 1 | $681B |
|
||
| Food / Agriculture | 1 | $53B |
|
||
| Retail / Energy | 1 | $22B |
|
||
| Transportation / Logistics | 1 | $12B |
|
||
| Energy | 1 | $4B |
|
||
Price history
+135.1% since first listed5 events — show timeline
- 2026-04-30 Pending — CARMLS
- 2026-02-20 Price Changed $152,800 CARMLS
- 2025-10-24 Listed $160,000 CARMLS
- 2002-12-06 Sold (Public Records) $87,500 Public Records
- 1996-03-01 Sold (Public Records) $65,000 Public Records
Property tax history
+3.1%/yrLatest (2025): $656 · -6.5% YoY. Source: county tax records.
Cash-flow waterfall
monthlySold comps — $/sqft
last 12 mo · ≤1 miLoading sold comps…