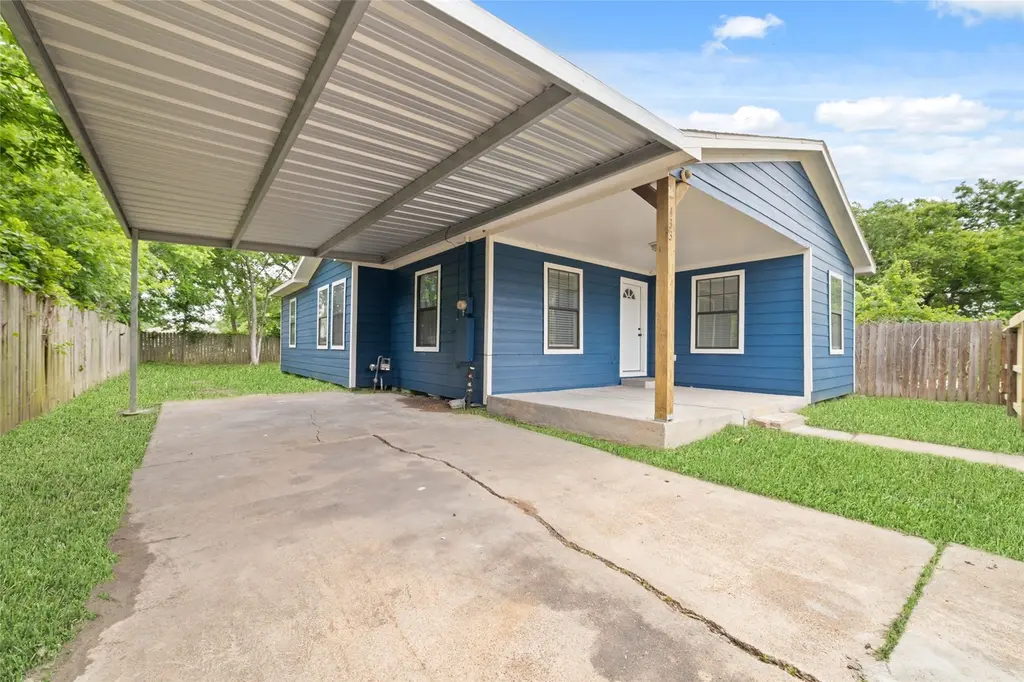
433 Calloway St · Houston, TX
Flood risk 8/10 · Major
- FEMA flood zone
- X (unshaded)
- Chance of flooding over 30 yrs
- 0.99%
- Est. flood insurance / yr
- $507 – $1,088
Fire risk 2/10 · Minimal
- Est. fire insurance / yr
- $1,222 – $2,270
Heat risk 9/10 · Severe
- Hot days now (above 109°F)
- 7 days/yr
- Hot days in 30 yrs
- 24 days/yr
Wind risk 9/10 · Severe
- Chance of severe wind over 30 yrs
- 99.0%
Air-quality risk 2/10 · Minimal
- Unhealthy air days now
- 2 days/yr
- Unhealthy air days in 30 yrs
- 2 days/yr
Risk factors via First Street. Map © Google.
Why this score? — see what drove the D grade
The composite is a weighted blend of 9 inputs, each scored 0–100. Each bar is that input's sub-score; the figure is the points it added to the 100-point composite (weight × sub-score).
- Appreciation +10.0/10.0
- ARV discount +8.8/15.0
- Cash flow +8.2/30.0
- Livability +3.7/5.0
- 1% rule +3.4/10.0
- Schools +2.8/10.0
- Rent growth +2.5/5.0
- Condition / age +2.5/5.0
- DSCR +2.2/10.0
$194,900
🖨 Deal sheet 📄 Offer letter ✓ Due diligence
Listing remarks
Welcome to this home tucked away on Houston’s east side. Set on a spacious lot, there’s plenty of room to enjoy the outdoors—whether it’s relaxing evenings, a small garden, or simply having space to spread out. Step inside to a comfortable open layout designed for easy living. The living area feels welcoming and flows naturally into the dining space, making it perfect for quiet nights at home or casual get-togethers. The kitchen adds a touch of charm with granite countertops, soft-close cabinetry, and ample storage for all your essentials. A dedicated laundry/utility room offers everyday convenience, while the overall feel of the home is warm, functional, and easy to
Key facts
- 5,000 sq ft lot
- Parking
- Built 1942
Property features AI
Exterior
- Parking: Attached carport; Carport available
- Utilities: Public water; Public sewer
- Home design: Residential property; Single-story (first-floor living areas noted); Built in 1942; Pillar/post/pier foundation
- Construction: Cement siding construction; Composition roof; Pillar/post/pier foundation; Year built: 1942
- Exterior features: Cleared lot; Composition roof
Interior
- Kitchen: Kitchen on the first floor (16 x 6)
- Bedrooms: Primary bedroom on the first floor (15 x 12); Bedroom on the first floor (14 x 10); Bedroom on the first floor (10 x 10)
- Bathrooms: 2 full bathrooms
- Heating & cooling: Central heating (gas); Central air conditioning (electric)
- Interior features: 5 total rooms; Cleared lot (see Exterior for lot details)
Neighborhood map
What this means for you Summary
Snapshot
- This is a 3-bed/2.0-bath single-family listed at $195k.
Deal economics
- At list price, monthly cash flow is $-251 ($-3k/yr) — negative.
- To cash-flow at today's rent, offer at most $151k (22.8% below list).
- To meet the 1% rule (rent ≥ 1% of price), the offer needs to be $164k (16.0% below list).
- Recommended offer: $151k (22.8% below list) — sets the bar for cash-flow.
- Cap rate 5.2% vs local median 3.2% in Houston — top-decile yield for the area; either an underpriced asset or a hidden risk that comps aren't pricing in. Stress-test before assuming the spread holds.
Location & tenants
- Location reads 74/100 on livability (#184 in TX, #4,771 nationally) — a middle-class / working-renter tenant base. Strengths: amenities A+, cost of living A+, housing A+; Watch: crime F.
- Galena Park ISD (suburban): math 32% / reading 33% proficiency, ranked #578 of 826 in TX (top 70%) — families likely to look elsewhere, expect single-tenant / working-renter base with shorter leases; 74% free/reduced lunch — lower-income household profile, screen leases tightly.
- Zoned schools: Jacinto City El (math 31% / reading 32%, grade F, #2,396 of 4,322 statewide, top 56%, 714 students, 89% FRL); Woodland Acres Middle (math 35% / reading 34%, grade F, #858 of 1,662 statewide, top 54%, 603 students, 85% FRL); Galena Park H S (math 37% / reading 36%, grade F, #924 of 1,632 statewide, top 57%, 1,914 students, 87% FRL).
- Market conditions: 153 active listings in the ZIP; 13 comparable units currently listed for rent nearby; rentals at typical pace (median 24d on market — plan ~3-4 weeks tenant-placement turnaround); 46% of comp listings sitting > 30 days — soft ceiling on asking rent; 29,883 units permitted in Harris County in 2024 (8,621 in 5+ unit buildings).
- This rent runs 41% of the median local income ($48k/yr) — at the standard rent-burdened threshold; future hikes will face affordability resistance.
Forward outlook
- In year one you build about $21k of equity ($1k loan paydown + $19k appreciation (10.0% local appreciation)).
- Harris County population projected at +47% by 2050 — long-run rental-demand tailwind backs the buy-and-hold thesis.
- By year 2, paydown + projected appreciation supports a ~$33k cash-out refi (75% LTV) — recoverable capital for the next deal without selling this one.
Negotiation context
- It's been on market 18 days — a 2% lower offer ($192k) is reasonable based on typical stale-listing flexibility.
- 7 sale attempts since 9y ago with the ask held roughly flat each time — persistent listings suggest the price (not the market) is what's stuck; bring a comps-based counter.
Risks & watch-outs
- Watch-outs: flood insurance adds $66/mo; built in 1942 — expect roof / HVAC / electrical / plumbing capex.
- Climate carrying-cost: severe flood risk; severe wind risk, 99% chance of damaging wind over 30y; extreme-heat days projected 7→24/yr by 2055 (HVAC capex compounding) — expect insurance premiums to compound above CPI over the hold.
Questions for the listing agent
- What do current leases actually rent for vs. the listed asking? Can we see a recent rent roll and the last 12 months of T-12 income?
- Built in 1942 — when were the roof, HVAC, electrical panel, plumbing, and water heater last replaced?
- What's the actual annual flood-insurance premium (NFIP or private), and is the property in a SFHA with mandatory coverage?
- Is there a deadline driving the sale (1031 exchange, divorce, estate, relocation)? That informs how much negotiation room exists.
- Schools are D-rated, which usually means shorter tenancies and higher turnover. Who's the typical renter profile here, and what's been the actual vacancy rate?
- Crime grade is F in this area — have there been break-ins, vandalism, or insurance claims at this property in the last 3 years? What carrier currently insures it and at what premium?
- The area grade is low — what's the realistic commute time and amenity access for the typical tenant pool here? Any planned neighborhood developments (good or bad) we should know about?
- What's the average days-on-market for RENTAL listings here right now (not sales)? A rising rental-DOM trend means longer vacancies and softer asking-rent achievability than the comps imply.
- What's the recent tenant-quality profile in this submarket — average credit score on applications, eviction rate, late-payment / NSF rate, and stable-employment percentage? A property-management company in the area should have these aggregated.
- How much new for-sale + rental construction is in the pipeline within 1–3 miles? Heavy new supply typically softens prices + rents 12–24 months out; constrained supply supports both.
Investment metrics
- 1% rule
- 0.84% ✗
- Cap rate
- 5.16%
- Cash-on-cash
- -4.06%
- DSCR
- 0.82
- GRM
- 9.9
CMA / ARV
- ARV (median comp)
- $200,516
- List price
- $194,900
- Delta
- -2.80%
- Verdict
- FAIR
- Comps
- 20 within 1.0 mi
Show comp detail 12 sales within ~0.75 mi
| Address | Dist | Beds/Ba | Sqft | Sold | Price | $/sf | Match |
|---|---|---|---|---|---|---|---|
| 2513 13th St | 0.10mi | 3/1.5 | 1,258 (+6%) | 1mo | $139,999 | $111 | 82 |
| 2515 7th St | 0.39mi | 2/2.0 (-1) | 1,171 (-1%) | 2mo | $169,900 | $145 | 73 |
| 2224 11th St | 0.42mi | 3/2.0 | 1,120 (-6%) | 1mo | $179,900 | $161 | 70 |
| 2204 Benson Dr | 0.50mi | 3/2.0 | 1,242 (+4%) | 1mo | $199,999 | $161 | 68 |
| 2219 15th St | 0.43mi | 3/1.0 | 1,213 (+2%) | 7mo | $94,000 | $77 | 67 |
| 225 Armstrong St | 0.48mi | 3/2.5 | 1,207 (+2%) | 8mo | $115,000 | $95 | 66 |
| 1204 Sage Dr | 0.18mi | 3/1.0 | 1,336 (+12%) | 8mo | $160,000 | $120 | 60 |
| 9721 Stedman St | 0.63mi | 3/2.0 | 1,265 (+6%) | 2mo | $211,000 | $167 | 58 |
| 2222 8th St | 0.52mi | 3/1.0 | 1,246 (+5%) | 7mo | $149,950 | $120 | 58 |
| 213 Armstrong St | 0.50mi | 2/1.5 (-1) | 1,281 (+8%) | 4mo | $110,000 | $86 | 53 |
| 2220 7th St | 0.56mi | 4/2.0 (+1) | 1,114 (-6%) | 7mo | $179,990 | $162 | 53 |
| 2113 10th St | 0.63mi | 2/2.0 (-1) | 1,103 (-7%) | 7mo | $135,000 | $122 | 48 |
Match score weights: distance 35% · size 25% · config 20% · recency 20%. Top-matched comps best support the ARV.
Projected returns pro-forma
10.0% appreciation · 3.0% rent growth · sell at horizon
- IRR
- 20.4%
- Equity multiple
- 2.65×
- Total profit
- $90,295
- Equity at exit
- $175,581
- IRR
- 18.6%
- Equity multiple
- 6.11×
- Total profit
- $278,775
- Equity at exit
- $378,648
Cash invested: $54,572 (down + closing). Projections, not guarantees.
Landlord ↔ Tenant lean methodology
- Overall (STATE)
- 87 Strongly Landlord-Friendly
- State Texas
- 87 Strongly Landlord-Friendly · R+5
- County
- — inherits STATE
- City
- — inherits STATE
ZIP-level market 77029
- Home prices YoY
- 7.2%
- Active inventory
- 153
- Price-to-rent
- 9.9×
Monthly cashflow live
- Estimated rent
- $1,637 high interval (Pro) →
- Mortgage (P&I)
- −$1,022
- Tax from tax record
- −$375 /mo · $4,499/yr
- Insurance
- −$81
- Flood insurance flood zone
- −$66 /mo · $798/yr
- HOA
- −$0
- Vacancy / Maint / Mgmt
- −$344
- Net cashflow
- $-251
Break-even live
UW: 25.0% down · 7.5% · 30yr · 1.5% tax · 5.0% vac · 8.0% maint · 8.0% mgmt
Financing live
Cash to close
- Down payment
- $48,725
- Closing costs
- $5,847
- Reserves months
- —
- Total cash needed
- —
Loan-product check · same deal, 3 products live
Conventional
25% down · 7.5% · 30yr
- Down + closing
- —
- Monthly P&I
- —
- Monthly cashflow
- —
- DSCR
- —
- Eligible?
- —
Personal DTI + credit; lowest rate.
DSCR
20% down · 8.5% · 30yr
- Down + closing
- —
- Monthly P&I
- —
- Monthly cashflow
- —
- DSCR
- —
- Eligible?
- —
No personal income docs; deal must DSCR.
Hard money
10% down · 12.0% · 12mo
- Down + closing
- —
- Monthly P&I
- —
- Monthly cashflow
- —
- DSCR
- —
- Eligible?
- —
Short-term bridge; refi at stabilization.
Rent comps 13 comps
| Address | Beds | Baths | Sqft | Rent | $/sqft | DOM | Units | Dist |
|---|---|---|---|---|---|---|---|---|
| 335 Delaware St Houston, TX | 2.0 | 1.0 | 784 | $940 | $1.20 | 12d | 1 | 0.33mi |
| 423 Armstrong St Houston, TX | 3.0 | 2.0 | 1090 | $1,515 | $1.39 | 1d | 1 | 0.41mi |
| 403 Armstrong St Houston, TX | 3.0 | 2.0 | 909 | $1,435 | $1.58 | 5d | 1 | 0.42mi |
| 205 Bolden St Unit A Houston, TX | 3.0 | 2.0 | 1200 | $2,500 | $2.08 | 43d | 1 | 0.46mi |
| 9743 Veyblum St Unit B Houston, TX | 3.0 | 2.0 | 872 | $1,145 | $1.31 | 5d | 1 | 0.50mi |
| 9821 Turnbow St Unit C Houston, TX | 3.0 | 2.0 | 1140 | $1,720 | $1.51 | 43d | 1 | 0.54mi |
| 311 Massachusetts St Unit A Houston, TX | 3.0 | 2.0 | 1184 | $1,700 | $1.44 | 12d | 1 | 0.62mi |
| 9713 Stedman St Unit b Houston, TX | 3.0 | 2.0 | 872 | $1,095 | $1.26 | 43d | 1 | 0.65mi |
| 2216 3rd St Galena Park, TX | 3.0 | 2.0 | 1500 | $1,400 | $0.93 | 43d | 1 | 0.73mi |
| 9710 Tuffly St Houston, TX | 3.0 | 2.0 | 1275 | $1,795 | $1.41 | 24d | 1 | 0.85mi |
| 9709 Cargill St Houston, TX | 3.0 | 2.0 | 1184 | $2,300 | $1.94 | 43d | 1 | 1.07mi |
| 9806 Fillmore St Houston, TX | 2.0 | 2.0 | 850 | $1,850 | $2.18 | 43d | 1 | 1.08mi |
| 9907 Lanewell St Unit a Houston, TX | 3.0 | 2.0 | 872 | $1,154 | $1.32 | 21d | 1 | 1.16mi |
Listing history 28 events
-
2026-05-17status Pending 839-char remark
-
2026-04-28$194,900 Active 839-char remark
-
2026-04-28historical
-
2025-10-15price $170,000
-
2025-10-10price $189,999
-
2025-09-23$199,999 Active
-
2025-08-28historical
-
2025-07-29$169,977 Active
-
2024-02-16soldstatus
-
2024-02-08soldstatus
-
2024-02-02soldstatus Sold
-
2023-12-23status Pending
-
2023-12-18status Option Pending
-
2023-10-18price $174,900
-
2023-10-18status Active
-
2023-10-15status Pending
-
2023-10-05status Option Pending
-
2023-08-15price $195,000
-
2023-07-31$200,900 Active
-
2023-07-25historical
-
2023-07-15price $204,999
-
2023-05-20price $217,500
-
2023-05-03$224,999 Active
-
2017-12-27soldstatus Sold
-
2017-11-29status Pending, Continue to Show
-
2017-10-30$149,900 Active
-
2017-06-09soldstatus
-
1994-12-06soldstatus
ⓘ Source: listings_history table (triggers on properties + properties_extension) + one-shot
backfill from property_details.listing_events for pre-trigger history.
Tax reassessment forecast TX · Resets to sale price
- Current annual tax
- $4,499 · $375/mo
- Projected year-2 tax
- $4,499 · $375/mo
- Expected delta
- $0/yr ($0/mo · 0.0%)
ⓘ Screening estimate from a state-policy table — verify with the county assessor before closing.
Climate risk First Street
- Flood 8/10 Severe FEMA zone X (unshaded) · 99% chance over 30 yrs
- Wildfire 2/10 Low
- Heat 9/10 Extreme 7 d/yr ≥109°F today · 24 d/yr by 30 yrs out
- Wind 9/10 Extreme 99% chance of damaging wind over 30 yrs
- Air quality 2/10 Low 2 unhealthy d/yr today · 2 by 30 yrs out
Nearby sold comps map
Loading sold comps map…
Walkable amenities ~0.75 mi
Loading nearby amenities…
Taxation est. · year 1
- Rental income
- $19,647
- − Mortgage interest
- −$10,917
- − Property taxes
- −$4,499
- − Insurance
- −$1,772
- − Repairs & maintenance
- −$1,572
- − Management
- −$1,572
- − Depreciation
- −$5,670
- Taxable loss
- −$6,354
- Est. tax savings @ 24.0%
- +$1,525
- After-tax cash flow
- $-1,489/yr
For passive investors: Depreciation is non-cash, so a rental often shows a tax loss while cash-flowing — sheltering income. Rental losses are passive: they offset passive income freely, and up to $25,000/yr can offset ordinary (W-2) income if you actively participate and your MAGI is under $100k (phasing out to $0 by $150k); unused losses carry forward. On sale, claimed depreciation is recaptured at up to 25%, and gains may owe capital-gains tax (a 1031 exchange can defer both). Figures are a year-1 estimate at your 24.0% rate — not tax advice; consult a CPA.
Schools (NCES district)
- District
- Galena Park ISD
- NCES district ID
- 4820250
- Math proficiency
- 32% ▼ -20.00%
- Reading proficiency
- 33% ▼ -7.00%
- Median HH income
- $43,158
- Composite
- 27.62/100
- National rank
- #6927
- State rank
- #578 of 826 in TX
Livability — Houston
- Score
- 74/100
- State rank
- #184
- US rank
- #4771
Category grades
Schools grade is shown separately in the Schools card above.
Census & demographics
- Census place
- Houston, TX
- County
- Harris County · 4,702,590 people
- City population
- 3,226,434
- Metro
- Houston-The Woodlands-Sugar Land, TX
- Population (ZIP)
- 16,154
- Household income
- $48,279
- Rent vs Own
- Severe rent burden
- 457.0
Population outlook (Harris County) Hauer SSP2
- Today (2025)
- 5,571,493 people
- By 2030
- 6,089,821 · +9.3%
- By 2040
- 7,142,806 · +28.2%
- By 2050
- 8,185,864 · +46.9%
- By 2075
- 10,574,329 · +89.8%
- By 2100
- 12,109,958 · +117.4%
Race, ethnicity, and origin ACS 2023
- Neighborhood character
- Predominantly Hispanic (72%)
- Race & ethnicity
- Hispanic / Latino 72% Two or more races 32% Black 22% White 5%
- Hispanic origin (detail)
- Mexican 66%
- Foreign-born
- 31% · Canada
- Languages at home
- 39% English-only · Spanish 61%
Political lean MEDSL · Harris
- 2024 margin
- Lean D (+5.5) · D 52.0% · R 46.4% · Other 1.6%
- 2008→2024 swing
- +3.9pp toward D · 2008: 1.6pp · 2024: 5.5pp
- All cycles
- 2024: D+5.5 2020: D+13.3 2016: D+12.4 2012: D+0.1 2008: D+1.6
Not yet ingested
- Civics
- —
Market trends
- HPI YoY
- ▲ 18.53%
- Current HPI
- 276.1811
- Rent YoY
- —
- Metro
- Houston-The Woodlands-Sugar Land, TX
- State GDP YoY
- ▲ 3.95%
- F500 in state
- 110
Industry mix (Fortune 500 HQ in TX)
| Industry | F500 HQs | Revenue |
|---|---|---|
| Energy | 16 | $1,198B |
|
||
| Technology | 5 | $198B |
|
||
| Engineering / Construction | 4 | $72B |
|
||
| Energy Services | 3 | $60B |
|
||
| Utilities | 3 | $41B |
|
||
| Healthcare | 2 | $330B |
|
||
Price history
+30.0% since first listed28 events — show timeline
- 2026-05-17 Pending — HARMLS
- 2026-04-28 Listing Removed — HARMLS
- 2026-04-28 Listed $194,900 HARMLS
- 2025-10-15 Price Changed $170,000 HARMLS
- 2025-10-10 Price Changed $189,999 HARMLS
- 2025-09-23 Listed $199,999 HARMLS
- 2025-08-28 Listing Removed — HARMLS
- 2025-07-29 Listed $169,977 HARMLS
- 2024-02-16 Sold (Public Records) — Public Records
- 2024-02-08 Sold (Public Records) — Public Records
- 2024-02-02 Sold (MLS) — HARMLS
- 2023-12-23 Pending — HARMLS
- 2023-12-18 Pending — HARMLS
- 2023-10-18 Price Changed $174,900 HARMLS
- 2023-10-18 Relisted — HARMLS
- 2023-10-15 Pending — HARMLS
- 2023-10-05 Pending — HARMLS
- 2023-08-15 Price Changed $195,000 HARMLS
- 2023-07-31 Listed $200,900 HARMLS
- 2023-07-25 Listing Removed — HARMLS
- 2023-07-15 Price Changed $204,999 HARMLS
- 2023-05-20 Price Changed $217,500 HARMLS
- 2023-05-03 Listed $224,999 HARMLS
- 2017-12-27 Sold (MLS) — HARMLS
- 2017-11-29 Pending — HARMLS
- 2017-10-30 Listed $149,900 HARMLS
- 2017-06-09 Sold (Public Records) — Public Records
- 1994-12-06 Sold (Public Records) — Public Records
Property tax history
+11.9%/yrLatest (2025): $4,499 · +101.0% YoY. Source: county tax records.
Cash-flow waterfall
monthlySold comps — $/sqft
last 12 mo · ≤1 miLoading sold comps…