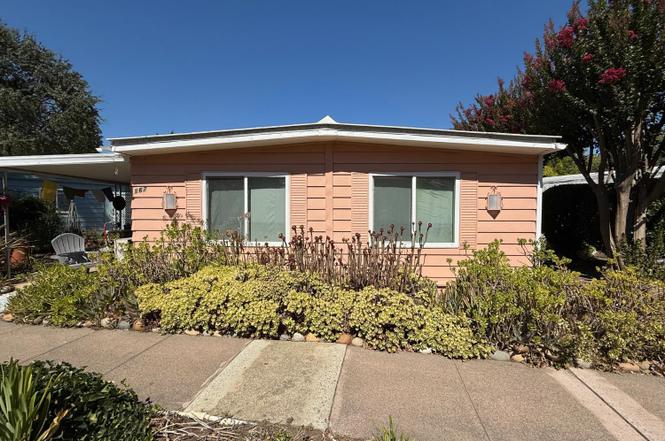
167 Sequoia Cir · Santa Rosa, CA
Flood risk 1/10 · Minimal
- FEMA flood zone
- X (unshaded)
- Chance of flooding over 30 yrs
- 0.0%
- Est. flood insurance / yr
- $507 – $1,088
Fire risk 2/10 · Minimal
- Est. fire insurance / yr
- $659 – $1,223
Heat risk 4/10 · Minor
- Hot days now (above 90°F)
- 7 days/yr
- Hot days in 30 yrs
- 15 days/yr
Wind risk 1/10 · Minimal
- Chance of severe wind over 30 yrs
- —
Air-quality risk 9/10 · Severe
- Unhealthy air days now
- 19 days/yr
- Unhealthy air days in 30 yrs
- 19 days/yr
Risk factors via First Street. Map © Google.
Why this score? — see what drove the B grade
The composite is a weighted blend of 9 inputs, each scored 0–100. Each bar is that input's sub-score; the figure is the points it added to the 100-point composite (weight × sub-score).
- Cash flow +30.0/30.0
- ARV discount +11.5/15.0
- 1% rule +10.0/10.0
- DSCR +10.0/10.0
- Livability +3.8/5.0
- Schools +3.7/10.0
- Condition / age +2.5/5.0
- Rent growth +2.2/5.0
- Appreciation +0.0/10.0
$145,000
🖨 Deal sheet (PDF) 📄 Offer letter ✓ Due diligence
Listing remarks
Welcome to Sequoia Gardens, a 55+ adult community. This move-in ready home offers 2 bedrooms and 1 oversized remodeled bathroom across approximately 1,152 square feet. Situated in a desirable cul-de-sac, it features a bright, open floor plan enhanced with solar tubes and beautiful flooring throughout. The open kitchen includes a breakfast bar and plenty of cabinet space. The primary bedroom offers abundant closet storage, while the large covered patio provides a perfect spot to relax. Backing to walking paths, the property is centrally located within the park and close to shopping, dining, transportation, and major medical facilities.
Key facts
- Open floor plan
- Solar tubes
- Large covered patio
Tags
Property features AI
Finance
- Financial info: Monthly land lease: $913
- HOA & community: No homeowners association; Located in a senior community; Located in Sequoia Gardens park
Exterior
- Parking: Covered parking for 2 vehicles
- Utilities: Public sewer; Cable available; Internet available
- Home design: Manufactured home in a park; Double-wide model; Madison manufacturer; Wood skirt
- Construction: Manufactured construction
- Exterior features: Covered patio; Porch with steps; Carport awning; Storage shed(s)
Interior
- Kitchen: Free standing gas range; Free standing refrigerator; Microwave
- Bedrooms: 2 bedrooms
- Flooring: Carpet; Laminate (simulated wood)
- Bathrooms: 1 full bathroom with shower stall
- Heating & cooling: Central heating; Central cooling
- Interior features: Skylights in living room and kitchen; Dining and living room combined; Breakfast area; Laminate counters
- Laundry & utility: Washer and dryer included; Laundry area inside the home
Neighborhood map
What this means for you Summary
Snapshot
- This is a 2-bed/1.0-bath manufactured listed at $145k.
Deal economics
- At list price, monthly cash flow is $1k ($12k/yr) — positive.
- The deal already cash-flows at list — no discount required.
- Meets the 1% rule at list price ($3k rent vs $145k).
- Recommended offer: $128k (12.0% below list) — sets the bar for market timing.
- Cap rate 14.7% vs local median 2.5% in Santa Rosa — top-decile yield for the area; either an underpriced asset or a hidden risk that comps aren't pricing in. Stress-test before assuming the spread holds.
Location & tenants
- Location reads 75/100 on livability (#112 in CA, #3,940 nationally) — a middle-class / working-renter tenant base. Strengths: amenities A+, commute A+, employment A+; Watch: cost of living F.
- Santa Rosa High (urban): math 31% / reading 47% proficiency, ranked #703 of 1,400 in CA (top 50%) — families likely to look elsewhere, expect single-tenant / working-renter base with shorter leases.
- Zoned schools: Jack London Elementary (275 students, 60% FRL); Hilliard Comstock Middle (434 students, 60% FRL); Piner High (1,361 students, 51% FRL) — zoned schools average 57% FRL vs 22% district-wide (35 pts higher); higher-poverty schools than district average — tighter screening recommended.
- Market conditions: Rents soft (-1.4%/yr); 79 active listings in the ZIP; 9 comparable units currently listed for rent nearby; rentals at typical pace (median 16d on market — plan ~3-4 weeks tenant-placement turnaround); solid renter incomes; 1,039 units permitted in Sonoma County in 2024 (185 in 5+ unit buildings).
- This rent runs 33% of the median local income ($94k/yr) — at the standard rent-burdened threshold; future hikes will face affordability resistance.
Forward outlook
- Local home prices are declining (-3.0%/yr); year-one equity from $1k of loan paydown is wiped out by about $4k of value loss. Plan a longer hold.
- Sonoma County population projected at +8% by 2050 — modest demand growth; plan on rents tracking national, not racing it.
- At projected returns (-3.0% appreciation + 0.0% rent growth), your $41k cash investment doubles in ~5 years — after that, you're playing with house money.
Negotiation context
- It's been on market 133 days — a 12% lower offer ($128k) is reasonable based on typical stale-listing flexibility.
- 3 sale attempts with the ask held roughly flat each time — persistent listings suggest the price (not the market) is what's stuck; bring a comps-based counter.
Questions for the listing agent
- It's been on market 133 days. Have you received any prior offers? Is the seller open to a 12% concession, seller financing, or rate buy-down credit?
- Built in 1974 — when were the roof, HVAC, electrical panel, plumbing, and water heater last replaced?
- Why hasn't it sold? Are there any deal-killer items the seller is aware of (foundation, flood, title, zoning, code violations)?
- Is there a deadline driving the sale (1031 exchange, divorce, estate, relocation)? That informs how much negotiation room exists.
- What's the average days-on-market for RENTAL listings here right now (not sales)? A rising rental-DOM trend means longer vacancies and softer asking-rent achievability than the comps imply.
- What's the recent tenant-quality profile in this submarket — average credit score on applications, eviction rate, late-payment / NSF rate, and stable-employment percentage? A property-management company in the area should have these aggregated.
- How much new for-sale + rental construction is in the pipeline within 1–3 miles? Heavy new supply typically softens prices + rents 12–24 months out; constrained supply supports both.
Investment metrics
- 1% rule
- 1.77% ✓
- Cap rate
- 14.74%
- Cash-on-cash
- 30.16%
- DSCR
- 2.34
- GRM
- 4.7
CMA / ARV
- ARV (on-the-fly)
- $158,976
- Comps found
- 12
Show comp detail 12 sales within ~0.75 mi
| Address | Dist | Beds/Ba | Sqft | Sold | Price | $/sf | Match |
|---|---|---|---|---|---|---|---|
| 100 Sequoia Cir | 0.05mi | 2/2.0 | 1,152 (0%) | 18mo | $155,000 | $135 | 78 |
| 22 Heyford Cir | 0.30mi | 2/2.0 | 1,152 (0%) | 16mo | $175,000 | $152 | 68 |
| 140 Sequoia Cir | 0.13mi | 2/2.0 | 1,248 (+8%) | 20mo | $152,500 | $122 | 60 |
| 117 Sequoia Cir | 0.12mi | 2/2.0 | 1,248 (+8%) | 20mo | $157,000 | $126 | 59 |
| 75 Sequoia Cir | 0.18mi | 2/2.0 | 1,080 (-6%) | 22mo | $140,000 | $130 | 59 |
| 126 Sequoia Cir | 0.20mi | 2/2.0 | 1,224 (+6%) | 22mo | $191,500 | $156 | 58 |
| 125 Salisbury Cir | 0.40mi | 2/2.0 | 1,224 (+6%) | 14mo | $157,000 | $128 | 56 |
| 52 Somerset Dr | 0.50mi | 2/2.0 | 1,248 (+8%) | 5mo | $134,000 | $107 | 54 |
| 154 Stratford Way | 0.43mi | 2/2.0 | 1,060 (-8%) | 16mo | $147,000 | $139 | 49 |
| 55 Norfolk Dr | 0.49mi | 2/2.0 | 1,060 (-8%) | 14mo | $146,000 | $138 | 48 |
| 60 Sequoia Cir | 0.23mi | 2/2.0 | 1,000 (-13%) | 19mo | $188,000 | $188 | 48 |
| 160 Shoreham Way | 0.38mi | 3/2.0 (+1) | 1,248 (+8%) | 21mo | $247,000 | $198 | 42 |
Match score weights: distance 35% · size 25% · config 20% · recency 20%. Top-matched comps best support the ARV.
Projected returns pro-forma
-3.0% appreciation · 0.0% rent growth · sell at horizon
- IRR
- 21.3%
- Equity multiple
- 1.84×
- Total profit
- $34,031
- Equity at exit
- $21,620
- IRR
- 27.4%
- Equity multiple
- 3.08×
- Total profit
- $84,482
- Equity at exit
- $12,537
Cash invested: $40,600 (down + closing). Projections, not guarantees.
Landlord ↔ Tenant lean methodology
- Overall (STATE)
- 18 Strongly Tenant-Friendly
- State California
- 18 Strongly Tenant-Friendly · D+13
- County
- — inherits STATE
- City
- — inherits STATE
ZIP-level market 95401
- Rents YoY
- -1.4%
- Active inventory
- 79
- Price-to-rent
- 4.7×
Monthly cashflow live
- Estimated rent
- $2,560 high interval (Pro) →
- Mortgage (P&I)
- −$760
- Tax est. 1.5%
- −$181 /mo · $2,175/yr
- Insurance
- −$60
- HOA
- −$0
- Vacancy / Maint / Mgmt
- −$538
- Net cashflow
- $1,020
Break-even live
Sensitivity live
| Price | -10% $1,121 | -5% $1,071 | +0% $1,020 | +5% $970 | +10% $920 |
|---|---|---|---|---|---|
| Rent | -10% $818 | -5% $919 | +0% $1,020 | +5% $1,122 | +10% $1,223 |
| Rate | -1.0pp $1,093 | -0.5pp $1,057 | base $1,020 | +0.5pp $983 | +1.0pp $945 |
UW: 25.0% down · 7.5% · 30yr · 1.5% tax · 5.0% vac · 8.0% maint · 8.0% mgmt
Financing live
Cash to close
- Down payment
- $36,250
- Closing costs
- $4,350
- Reserves months
- —
- Total cash needed
- —
Loan-product check · same deal, 3 products live
Conventional
25% down · 7.5% · 30yr
- Down + closing
- —
- Monthly P&I
- —
- Monthly cashflow
- —
- DSCR
- —
- Eligible?
- —
Personal DTI + credit; lowest rate.
DSCR
20% down · 8.5% · 30yr
- Down + closing
- —
- Monthly P&I
- —
- Monthly cashflow
- —
- DSCR
- —
- Eligible?
- —
No personal income docs; deal must DSCR.
Hard money
10% down · 12.0% · 12mo
- Down + closing
- —
- Monthly P&I
- —
- Monthly cashflow
- —
- DSCR
- —
- Eligible?
- —
Short-term bridge; refi at stabilization.
Rent comps 9 comps
| Address | Beds | Baths | Sqft | Rent | $/sqft | DOM | Units | Dist |
|---|---|---|---|---|---|---|---|---|
| 2135 Pebblewood Ct Santa Rosa, CA | 3.0 | 2.0 | 1340 | $3,400 | $2.54 | 16d | 1 | 1.08mi |
| 2120 Jennings Ave Santa Rosa, CA | 1.0–2.0 | 1.0–2.0 | 750 | $2,450 | $3.27 | 16d | 6 | 1.13mi |
| 920 Doubles Dr Santa Rosa, CA | 2.0 | 2.5 | 1013 | $2,450 | $2.42 | 16d | 1 | 1.23mi |
| 960 Doubles Dr Santa Rosa, CA | 2.0–3.0 | 1.0–2.5 | 1038 | $2,399 | $2.31 | 15d | 3 | 1.27mi |
| 3851 Sebastopol Rd #105 Santa Rosa, CA | 2.0 | 1.0 | 900 | $2,400 | $2.67 | 16d | 1 | 1.29mi |
| 1001 Doubles Dr Unit 105 Santa Rosa, CA | 2.0 | 2.0 | 1231 | $2,895 | $2.35 | 16d | 1 | 1.32mi |
| 1001 Doubles Dr Santa Rosa, CA | 2.0 | 2.0 | 1231 | $2,750 | $2.23 | 15d | 1 | 1.32mi |
| 1118 Dale Ct Santa Rosa, CA | 3.0 | 2.0 | 1276 | $2,495 | $1.96 | 23d | 1 | 1.33mi |
| 1765 W 3rd St Santa Rosa, CA | 2.0 | 1.5 | 1000 | $2,395 | $2.40 | 16d | 1 | 1.45mi |
Listing history 23 events
-
2026-06-21days on market $145,000 Active 133 DOM
-
2026-06-18days on market $145,000 Active 130 DOM
-
2026-06-17days on market $145,000 Active 129 DOM
-
2026-06-16days on market $145,000 Active 128 DOM
-
2026-06-15days on market $145,000 Active 127 DOM
-
2026-06-14days on market $145,000 Active 125 DOM
-
2026-06-13days on market $145,000 Active 124 DOM
-
2026-06-10days on market $145,000 Active 122 DOM
-
2026-06-09days on market $145,000 Active 121 DOM
-
2026-06-08days on market $145,000 Active 120 DOM
-
2026-06-07days on market $145,000 Active 119 DOM
-
2026-06-05days on market $145,000 Active 116 DOM
-
2026-06-03days on market $145,000 Active 115 DOM
-
2026-06-02days on market $145,000 Active 114 DOM
-
2026-06-01days on market $145,000 Active 113 DOM
-
2026-05-31days on market $145,000 Active 112 DOM
-
2026-05-30days on market $145,000 Active 111 DOM
-
2026-04-20status Active
-
2026-04-06historical Contingent (Show)
-
2026-03-10price $145,000
-
2026-02-04$152,000 Active
-
2025-11-10price $155,000
-
2025-09-19$162,500 Active
ⓘ Source: listings_history table (triggers on properties + properties_extension) + one-shot
backfill from property_details.listing_events for pre-trigger history.
Climate risk First Street
- Flood 1/10 Low FEMA zone X (unshaded) · 0% chance over 30 yrs
- Wildfire 2/10 Low
- Heat 4/10 Moderate 7 d/yr ≥90°F today · 15 d/yr by 30 yrs out
- Wind 1/10 Low
- Air quality 9/10 Extreme 19 unhealthy d/yr today · 19 by 30 yrs out
Nearby sold comps map
Loading sold comps map…
Walkable amenities ~0.75 mi
Loading nearby amenities…
Taxation est. · year 1
- Rental income
- $30,721
- − Mortgage interest
- −$8,122
- − Property taxes
- −$2,175
- − Insurance
- −$725
- − Repairs & maintenance
- −$2,458
- − Management
- −$2,458
- − Depreciation
- −$4,218
- Taxable income
- $10,565
- Est. tax owed @ 24.0%
- −$2,536
- After-tax cash flow
- $9,709/yr
For passive investors: Depreciation is non-cash, so a rental often shows a tax loss while cash-flowing — sheltering income. Rental losses are passive: they offset passive income freely, and up to $25,000/yr can offset ordinary (W-2) income if you actively participate and your MAGI is under $100k (phasing out to $0 by $150k); unused losses carry forward. On sale, claimed depreciation is recaptured at up to 25%, and gains may owe capital-gains tax (a 1031 exchange can defer both). Figures are a year-1 estimate at your 24.0% rate — not tax advice; consult a CPA.
Schools (NCES district)
- District
- Santa Rosa High
- NCES district ID
- 0635830
- Math proficiency
- 31% —
- Reading proficiency
- 47% —
- Median HH income
- $62,000
- Composite
- 37.25/100
- National rank
- #8972
- State rank
- #703 of 1400 in CA
Livability — Santa Rosa
- Score
- 75/100
- State rank
- #112
- US rank
- #3940
Category grades
Schools grade is shown separately in the Schools card above.
Census & demographics
- Census place
- Santa Rosa, CA
- County
- Sonoma County · 449,805 people
- City population
- 210,074
- Metro
- Santa Rosa-Petaluma, CA
- Population (ZIP)
- 36,861
- Household income
- $93,615
- Rent vs Own
- Severe rent burden
- 1525.0
Population outlook (Sonoma County) Hauer SSP2
- Today (2025)
- 539,935 people
- By 2030
- 554,870 · +2.8%
- By 2040
- 573,262 · +6.2%
- By 2050
- 580,715 · +7.6%
- By 2075
- 579,229 · +7.3%
- By 2100
- 547,835 · +1.5%
Race, ethnicity, and origin ACS 2023
- Neighborhood character
- Diverse neighborhood (Simpson 0.61)
- Race & ethnicity
- White 46% Hispanic / Latino 41% Two or more races 16% Asian 6% Black 1% Native American 1%
- Hispanic origin (detail)
- Mexican 36%
- Common ancestry
- Lithuanian 2% Italian 2% Slovak 1%
- Foreign-born
- 24% · Canada, Vietnam, China
- Languages at home
- 63% English-only · Spanish 32% Other Indo-European 2% Tagalog/Filipino 1%
Political lean MEDSL · Sonoma
- 2024 margin
- Solid D (+46.2) · D 71.4% · R 25.2% · Other 3.3%
- 2008→2024 swing
- -3.4pp toward R · 2008: 49.6pp · 2024: 46.2pp
- All cycles
- 2024: D+46.2 2020: D+51.5 2016: D+47.9 2012: D+44.9 2008: D+49.6
Not yet ingested
- Civics
- —
Market trends
- HPI YoY
- ▼ -855.56%
- Current HPI
- 253.1061
- Rent YoY
- ▼ -1.37%
- Metro
- Santa Rosa-Petaluma, CA
- State GDP YoY
- ▲ 3.21%
- F500 in state
- 116
Industry mix (Fortune 500 HQ in CA)
| Industry | F500 HQs | Revenue |
|---|---|---|
| Technology | 27 | $1,492B |
|
||
| Financial Services | 3 | $174B |
|
||
| Retail | 3 | $44B |
|
||
| Insurance | 3 | $26B |
|
||
| Media / Entertainment | 2 | $115B |
|
||
| Pharmaceuticals / Biotech | 2 | $62B |
|
||
Price history
-10.8% since first listed6 events — show timeline
- 2026-04-20 Relisted — BAREIS
- 2026-04-06 Contingent — BAREIS
- 2026-03-10 Price Changed $145,000 BAREIS
- 2026-02-04 Listed $152,000 BAREIS
- 2025-11-10 Price Changed $155,000 BAREIS
- 2025-09-19 Listed $162,500 BAREIS
Cash-flow waterfall
monthlySold comps — $/sqft
last 12 mo · ≤1 miLoading sold comps…