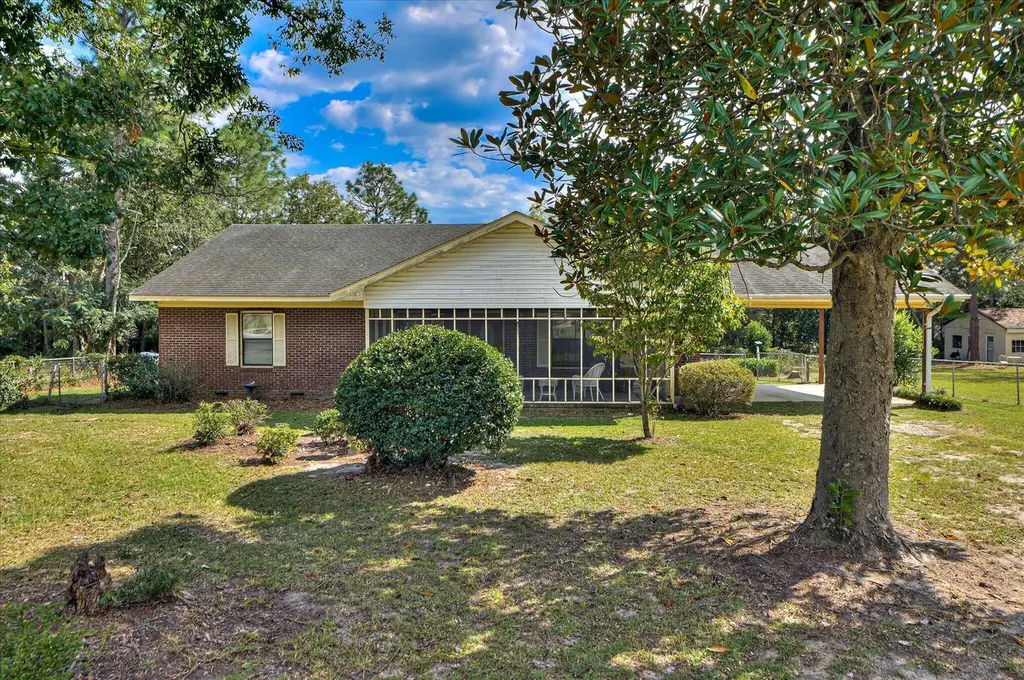
2114 Boykin Rd · Augusta-Richmond County consolidated government (balance), GA
Flood risk 1/10 · Minimal
- FEMA flood zone
- X (unshaded)
- Chance of flooding over 30 yrs
- 0.0%
- Est. flood insurance / yr
- $507 – $1,088
Fire risk 4/10 · Minor
- Est. fire insurance / yr
- $963 – $1,789
Heat risk 8/10 · Major
- Hot days now (above 107°F)
- 7 days/yr
- Hot days in 30 yrs
- 17 days/yr
Wind risk 6/10 · Moderate
- Chance of severe wind over 30 yrs
- 71.0%
Air-quality risk 3/10 · Minor
- Unhealthy air days now
- 3 days/yr
- Unhealthy air days in 30 yrs
- 3 days/yr
Risk factors via First Street. Map © Google.
Why this score? — see what drove the D grade
The composite is a weighted blend of 9 inputs, each scored 0–100. Each bar is that input's sub-score; the figure is the points it added to the 100-point composite (weight × sub-score).
- Cash flow +15.6/30.0
- ARV discount +9.3/15.0
- DSCR +4.8/10.0
- 1% rule +3.3/10.0
- Livability +2.5/5.0
- Condition / age +2.5/5.0
- Rent growth +2.4/5.0
- Schools +1.3/10.0
- Appreciation +0.0/10.0
$190,000
🖨 Deal sheet 📄 Offer letter ✓ Due diligence
Listing remarks
This has to be a cash sale. The previous owner never de-titled the mobile home part of it, looks like it was not required back then. Charming 4-Bedroom Home with Character and Potential in Dallas Heights Welcome to this unique 4-bedroom, 2-bathroom home, offering a blend of stick-built and mobile home construction on nearly half an acre (0.44 acres) in the Dallas Heights Subdivision. Built in 1989, this property carries a warm, nostalgic ambiance--reminiscent of ''grandma's house''--while providing ample space and opportunity for a creative new owner to make it their own. Inside, you'll find a cozy family room complete with a fireplace, a kitchen featuring a built-in seating island, and enc
Key facts
- Enclosed porches
- Attached carport
- Fully fenced
Tags
Property features AI
Finance
- Other: Zoning: R3
- Financial info: Information not provided
- HOA & community: Subdivision: Dallas Heights
Exterior
- Parking: Attached garage (1 garage space, 1 total parking space)
- Security: Information not provided
- Utilities: Public water; Public sewer; Natural gas connected; Water connected; Sewer connected; Power connected
- Home design: Single-family residence; One story; Entry level: 1
- Construction: Brick and frame construction; Composition roof; See remarks for additional construction details
- Exterior features: Front porch; Rear porch; Chain link fenced yard; Workshop and outbuilding; Landscaped, rectangular lot; Has a view
Interior
- Kitchen: Refrigerator; Dishwasher; Gas range
- Bedrooms: Information not provided
- Flooring: Carpet; Laminate
- Bathrooms: 2 full bathrooms
- Heating & cooling: Propane heating; Fireplace(s); Central air; Ceiling fan(s)
- Interior features: Kitchen island; Pantry; Tile counters; 7 total rooms; No basement (crawl space)
- Laundry & utility: Laundry room with washer hookup; Electric water heater
Neighborhood map
What this means for you Summary
Snapshot
- This is a 3-bed/2.0-bath single-family listed at $190k.
Deal economics
- At list price, monthly cash flow is $80 ($963/yr) — positive.
- The deal already cash-flows at list — no discount required.
- To meet the 1% rule (rent ≥ 1% of price), the offer needs to be $157k (17.4% below list).
- Recommended offer: $157k (17.4% below list) — sets the bar for 1% rule.
- Cap rate 6.8% vs local median 5.3% in Augusta-Richmond County consolidated government (balance) — meaningfully above typical; check what's discounted (condition, days-on-market, listing class) to confirm the premium yield is real.
Location & tenants
- Location reads: area grade D — affects rentability + tenant quality, not the cash-flow math above.
- Richmond County (urban): math 12% / reading 20% proficiency, ranked #154 of 174 in GA (top 88%) — low school quality limits family demand, transient renter base, plan for 1-2y turnover; 72% free/reduced lunch — lower-income household profile, screen leases tightly.
- Zoned schools: Diamond Lakes Elementary School (math 12% / reading 12%, grade F, #1,041 of 1,228 statewide, top 87%, 466 students, 98% FRL); Spirit Creek Middle School (math 4% / reading 12%, grade F, #445 of 470 statewide, top 95%, 532 students, 98% FRL) — zoned schools average 98% FRL vs 72% district-wide (26 pts higher); higher-poverty schools than district average — tighter screening recommended.
- Market conditions: Rents soft (-0.2%/yr); 364 active listings in the ZIP; 7 comparable units currently listed for rent nearby; rentals at typical pace (median 24d on market — plan ~3-4 weeks tenant-placement turnaround); 43% of comp listings sitting > 30 days — soft ceiling on asking rent; 561 units permitted in Richmond County in 2024 (0 in 5+ unit buildings).
- This rent runs 41% of the median local income ($46k/yr) — at the standard rent-burdened threshold; future hikes will face affordability resistance.
Forward outlook
- Local home prices are declining (-3.0%/yr); year-one equity from $1k of loan paydown is wiped out by about $6k of value loss. Plan a longer hold.
- Richmond County population projected to shrink 5% by 2050 — rents likely to lag national; underwrite the cash flow, not the appreciation.
Negotiation context
- It's been on market 22 days — a 2% lower offer ($187k) is reasonable based on typical stale-listing flexibility.
- 6 sale attempts since 2y ago with the ask held roughly flat each time — persistent listings suggest the price (not the market) is what's stuck; bring a comps-based counter.
- Current owner paid $120k; list at $190k implies a 58% gain — meaningful room to come down on a strong offer.
Risks & watch-outs
- Climate carrying-cost: major wind risk, 71% chance of damaging wind over 30y; extreme-heat days projected 7→17/yr by 2055 (HVAC capex compounding) — expect insurance premiums to compound above CPI over the hold.
Questions for the listing agent
- Is there a deadline driving the sale (1031 exchange, divorce, estate, relocation)? That informs how much negotiation room exists.
- The area grade is low — what's the realistic commute time and amenity access for the typical tenant pool here? Any planned neighborhood developments (good or bad) we should know about?
- What's the average days-on-market for RENTAL listings here right now (not sales)? A rising rental-DOM trend means longer vacancies and softer asking-rent achievability than the comps imply.
- What's the recent tenant-quality profile in this submarket — average credit score on applications, eviction rate, late-payment / NSF rate, and stable-employment percentage? A property-management company in the area should have these aggregated.
- How much new for-sale + rental construction is in the pipeline within 1–3 miles? Heavy new supply typically softens prices + rents 12–24 months out; constrained supply supports both.
Investment metrics
- 1% rule
- 0.83% ✗
- Cap rate
- 6.80%
- Cash-on-cash
- 1.81%
- DSCR
- 1.08
- GRM
- 10.1
CMA / ARV
- ARV (on-the-fly)
- $198,000
- Comps found
- 12
Show comp detail 12 sales within ~0.75 mi
| Address | Dist | Beds/Ba | Sqft | Sold | Price | $/sf | Match |
|---|---|---|---|---|---|---|---|
| 4417 Hatteras Dr | 0.10mi | 4/2.0 (+1) | 1,302 (-1%) | 12mo | $200,000 | $154 | 78 |
| 4212 Winslow Ln | 0.49mi | 3/2.0 | 1,311 (-1%) | 9mo | $209,900 | $160 | 68 |
| 4412 Hatteras Dr | 0.08mi | 3/2.0 | 1,188 (-10%) | 16mo | $170,000 | $143 | 66 |
| 2373 Richwood Dr | 0.58mi | 3/2.0 | 1,318 (-0%) | 9mo | $205,000 | $156 | 65 |
| 2348 Fieldcrest Rd | 0.64mi | 3/2.0 | 1,450 (+10%) | 3mo | $224,000 | $154 | 52 |
| 2323 Basswood Dr | 0.73mi | 3/2.0 | 1,284 (-3%) | 12mo | $193,000 | $150 | 52 |
| 4217 Ervay ST St | 0.19mi | 2/2.0 (-1) | 1,142 (-14%) | 15mo | $149,900 | $131 | 52 |
| 4204 Field Ct | 0.73mi | 4/2.0 (+1) | 1,410 (+7%) | 8mo | $195,000 | $138 | 43 |
| 3732 Vera Drive Dr | 0.59mi | 3/2.0 | 1,152 (-13%) | 13mo | $140,000 | $122 | 41 |
| 4004 Crest Ct | 0.63mi | 3/2.0 | 1,473 (+12%) | 13mo | $205,000 | $139 | 40 |
| 4202 Field Ct | 0.72mi | 3/2.0 | 1,426 (+8%) | 16mo | $184,999 | $130 | 40 |
| 2331 Travis Pines Dr. Dr | 0.60mi | 3/2.0 | 1,130 (-14%) | 11mo | $170,000 | $150 | 39 |
Match score weights: distance 35% · size 25% · config 20% · recency 20%. Top-matched comps best support the ARV.
Projected returns pro-forma
-3.0% appreciation · 0.0% rent growth · sell at horizon
- IRR
- -16.5%
- Equity multiple
- 0.43×
- Total profit
- $-30,347
- Equity at exit
- $28,330
- IRR
- -14.1%
- Equity multiple
- 0.29×
- Total profit
- $-37,907
- Equity at exit
- $16,428
Cash invested: $53,200 (down + closing). Projections, not guarantees.
Landlord ↔ Tenant lean methodology
- Overall (STATE)
- 90 Strongly Landlord-Friendly
- State Georgia
- 90 Strongly Landlord-Friendly · R+3
- County
- — inherits STATE
- City
- — inherits STATE
ZIP-level market 30906
- Home prices YoY
- -21.6%
- Rents YoY
- -0.2%
- Active inventory
- 364
- Price-to-rent
- 10.1×
Monthly cashflow live
- Estimated rent
- $1,569 high interval (Pro) →
- Mortgage (P&I)
- −$996
- Tax from tax record
- −$84 /mo · $1,008/yr
- Insurance
- −$79
- HOA
- −$0
- Vacancy / Maint / Mgmt
- −$330
- Net cashflow
- $80
Break-even live
UW: 25.0% down · 7.5% · 30yr · 1.5% tax · 5.0% vac · 8.0% maint · 8.0% mgmt
Financing live
Cash to close
- Down payment
- $47,500
- Closing costs
- $5,700
- Reserves months
- —
- Total cash needed
- —
Loan-product check · same deal, 3 products live
Conventional
25% down · 7.5% · 30yr
- Down + closing
- —
- Monthly P&I
- —
- Monthly cashflow
- —
- DSCR
- —
- Eligible?
- —
Personal DTI + credit; lowest rate.
DSCR
20% down · 8.5% · 30yr
- Down + closing
- —
- Monthly P&I
- —
- Monthly cashflow
- —
- DSCR
- —
- Eligible?
- —
No personal income docs; deal must DSCR.
Hard money
10% down · 12.0% · 12mo
- Down + closing
- —
- Monthly P&I
- —
- Monthly cashflow
- —
- DSCR
- —
- Eligible?
- —
Short-term bridge; refi at stabilization.
Rent comps 7 comps
| Address | Beds | Baths | Sqft | Rent | $/sqft | DOM | Units | Dist |
|---|---|---|---|---|---|---|---|---|
| 4416 Hatteras Dr Augusta, GA | 3.0 | 2.0 | 1436 | $1,600 | $1.11 | 13d | 1 | 0.08mi |
| 3731 Peach Orchard Rd Augusta, GA | 2.0 | 1.0 | 960 | $1,190 | $1.24 | 13d | 1 | 0.42mi |
| 3731 Peach Orchard Rd Augusta, GA | 2.0 | 1.0 | 960 | $1,220 | $1.27 | 43d | 1 | 0.42mi |
| 2302 Woodsman Dr Augusta, GA | 3.0 | 2.0 | 1436 | $1,475 | $1.03 | 23d | 1 | 0.92mi |
| 2401 Boykin Rd Hephzibah, GA | 3.0 | 2.5 | 1644 | $1,600 | $0.97 | 43d | 1 | 1.19mi |
| 3721 Colbert St Augusta, GA | 4.0 | 2.0 | 1302 | $1,400 | $1.08 | 43d | 1 | 1.31mi |
| 3325 Hamden St Augusta, GA | 3.0 | 2.0 | 1554 | $1,435 | $0.92 | 23d | 1 | 1.41mi |
Listing history 25 events
-
2026-06-18days on market $190,000 Active 22 DOM
-
2026-06-17days on market $190,000 Active 21 DOM
-
2026-06-16days on market $190,000 Active 20 DOM
-
2026-06-15days on market $190,000 Active 19 DOM
-
2026-06-14days on market $190,000 Active 17 DOM
-
2026-06-10days on market $190,000 Active 14 DOM
-
2026-06-09days on market $190,000 Active 13 DOM
-
2026-06-08days on market $190,000 Active 12 DOM
-
2026-06-07days on market $190,000 Active 11 DOM
-
2026-06-03days on market $190,000 Active 7 DOM
-
2026-06-02days on market $190,000 Active 6 DOM
-
2026-06-01days on market $190,000 Active 5 DOM
-
2026-05-31days on market $190,000 Active 4 DOM
-
2026-05-30days on market $190,000 Active 3 DOM
-
2026-05-27$190,000 Active
-
2026-01-15status Active
-
2025-12-07historical
-
2025-12-07historical
-
2025-12-03historical
-
2025-09-17$199,000
-
2025-09-17$199,000
-
2024-06-07soldstatus $120,000
-
2024-06-07soldstatus $120,000
-
2024-05-10$149,900
-
2024-05-10$149,900
ⓘ Source: listings_history table (triggers on properties + properties_extension) + one-shot
backfill from property_details.listing_events for pre-trigger history.
Tax reassessment forecast GA · Resets to sale price
- Current annual tax
- $1,008 · $84/mo
- Projected year-2 tax
- $1,748 · $146/mo
- Expected delta
- +$740/yr (+$62/mo · 73.4%)
ⓘ Screening estimate from a state-policy table — verify with the county assessor before closing.
Climate risk First Street
- Flood 1/10 Low FEMA zone X (unshaded) · 0% chance over 30 yrs
- Wildfire 4/10 Moderate
- Heat 8/10 Severe 7 d/yr ≥107°F today · 17 d/yr by 30 yrs out
- Wind 6/10 Major 71% chance of damaging wind over 30 yrs
- Air quality 3/10 Moderate 3 unhealthy d/yr today · 3 by 30 yrs out
Nearby sold comps map
Loading sold comps map…
Walkable amenities ~0.75 mi
Loading nearby amenities…
Taxation est. · year 1
- Rental income
- $18,833
- − Mortgage interest
- −$10,643
- − Property taxes
- −$1,008
- − Insurance
- −$950
- − Repairs & maintenance
- −$1,507
- − Management
- −$1,507
- − Depreciation
- −$5,527
- Taxable loss
- −$2,309
- Est. tax savings @ 24.0%
- +$554
- After-tax cash flow
- $1,517/yr
For passive investors: Depreciation is non-cash, so a rental often shows a tax loss while cash-flowing — sheltering income. Rental losses are passive: they offset passive income freely, and up to $25,000/yr can offset ordinary (W-2) income if you actively participate and your MAGI is under $100k (phasing out to $0 by $150k); unused losses carry forward. On sale, claimed depreciation is recaptured at up to 25%, and gains may owe capital-gains tax (a 1031 exchange can defer both). Figures are a year-1 estimate at your 24.0% rate — not tax advice; consult a CPA.
Schools (NCES district)
- District
- Richmond County
- NCES district ID
- 1304380
- Math proficiency
- 12% ▼ -9.00%
- Reading proficiency
- 20% ▼ -6.00%
- Median HH income
- $38,069
- Composite
- 13.43/100
- National rank
- #9524
- State rank
- #154 of 174 in GA
Livability — Augusta-Richmond County consolidated government (balance)
No livability data for this city. (Only ~50 U.S. cities are tracked.)
Census & demographics
- Census place
- Augusta-Richmond County consolidated government (balance), GA
- County
- Richmond County · 190,917 people
- City population
- 154,035
- Metro
- Augusta-Richmond County, GA-SC
- Population (ZIP)
- 60,423
- Household income
- $45,999
- Rent vs Own
- Severe rent burden
- 3363.0
Population outlook (Richmond County) Hauer SSP2
- Today (2025)
- 200,753 people
- By 2030
- 200,232 · -0.3%
- By 2040
- 196,813 · -2.0%
- By 2050
- 190,347 · -5.2%
- By 2075
- 172,496 · -14.1%
- By 2100
- 146,284 · -27.1%
Race, ethnicity, and origin ACS 2023
- Neighborhood character
- Majority Black (64%)
- Race & ethnicity
- Black 64% White 27% Two or more races 5% Hispanic / Latino 5%
- Common ancestry
- Lithuanian 1%
- Foreign-born
- 2% · Canada
- Languages at home
- 95% English-only · Spanish 3% German/W. Germanic 1%
Political lean MEDSL · Richmond
- 2024 margin
- Solid D (+36.1) · D 67.8% · R 31.7%
- 2008→2024 swing
- +4.3pp toward D · 2008: 31.8pp · 2024: 36.1pp
- All cycles
- 2024: D+36.1 2020: D+37.2 2016: D+32.4 2012: D+33.8 2008: D+31.8
Not yet ingested
- Civics
- —
Market trends
- HPI YoY
- ▼ -58.99%
- Current HPI
- 213.5733
- Rent YoY
- ▼ -0.25%
- Metro
- Augusta-Richmond County, GA-SC
- State GDP YoY
- ▲ 2.66%
- F500 in state
- 28
Industry mix (Fortune 500 HQ in GA)
| Industry | F500 HQs | Revenue |
|---|---|---|
| Paper / Packaging | 2 | $29B |
|
||
| Retail | 1 | $160B |
|
||
| Transportation / Logistics | 1 | $91B |
|
||
| Airlines | 1 | $62B |
|
||
| Consumer Goods | 1 | $47B |
|
||
| Utilities | 1 | $25B |
|
||
Price history
+26.8% since first listed11 events — show timeline
- 2026-05-27 Listed $190,000 Hive MLS
- 2026-01-15 Relisted — Hive MLS
- 2025-12-07 Listing Removed — Hive MLS
- 2025-12-07 Listing Removed — Hive MLS
- 2025-12-03 Listing Removed — Hive MLS
- 2025-09-17 Listed $199,000 Hive MLS
- 2025-09-17 Listed $199,000 Hive MLS
- 2024-06-07 Sold (MLS) $120,000 Hive MLS
- 2024-06-07 Sold (MLS) $120,000 Hive MLS
- 2024-05-10 Listed $149,900 Hive MLS
- 2024-05-10 Listed $149,900 Hive MLS
Property tax history
+3.9%/yrLatest (2025): $1,008 · +17.2% YoY. Source: county tax records.
Cash-flow waterfall
monthlySold comps — $/sqft
last 12 mo · ≤1 miLoading sold comps…