 Triplex
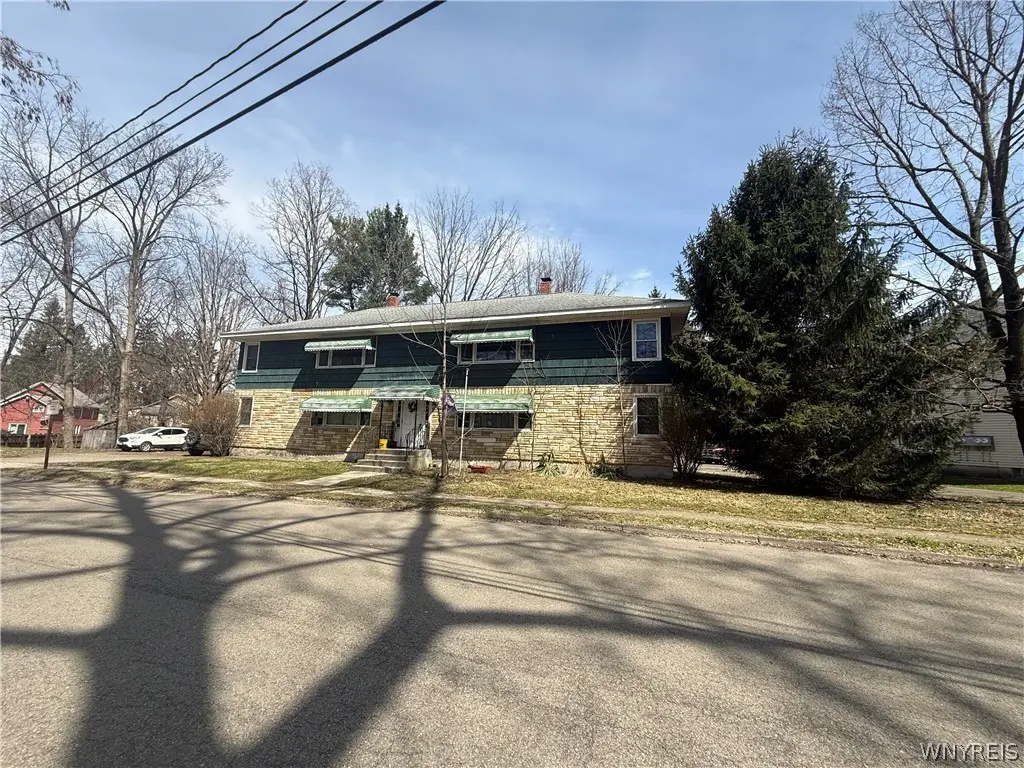
113 Torrance Pl · Gowanda, NY
Flood risk 1/10 · Minimal
- FEMA flood zone
- AO
- Chance of flooding over 30 yrs
- 0.0%
- Est. flood insurance / yr
- $848 – $2,087
Fire risk 1/10 · Minimal
- Est. fire insurance / yr
- $691 – $1,283
Heat risk 2/10 · Minimal
- Hot days now (above 93°F)
- 7 days/yr
- Hot days in 30 yrs
- 17 days/yr
Wind risk 1/10 · Minimal
- Chance of severe wind over 30 yrs
- —
Air-quality risk 2/10 · Minimal
- Unhealthy air days now
- 1 days/yr
- Unhealthy air days in 30 yrs
- 2 days/yr
Risk factors via First Street. Map © Google.
Why this score? — see what drove the A grade
The composite is a weighted blend of 9 inputs, each scored 0–100. Each bar is that input's sub-score; the figure is the points it added to the 100-point composite (weight × sub-score).
- Cash flow +30.0/30.0
- ARV discount +15.0/15.0
- DSCR +10.0/10.0
- Appreciation +10.0/10.0
- 1% rule +9.1/10.0
- Schools +3.5/10.0
- Livability +3.5/5.0
- Rent growth +2.5/5.0
- Condition / age +2.5/5.0
$224,900
🖨 Deal sheet (PDF) 📄 Offer letter ✓ Due diligence
Multi-family units
County records classify this as Multi-Family (5+ Unit). Listing-text estimate: 3 units. estimate disagrees with records
5+ unit building — per-unit beds/baths from public records are typically unavailable; the breakdown below (if shown) is an estimate from the listing text.
Listing remarks MLS
Great opportunity to buy a clean, cash flowing asset. Start or add to your portfolio with this amazing property. 4 apartments with a consistent history of tenancy and payments. 2/1 layouts with off street parking. Walkable neighborhood close to Cattaraugus Creek and Zoar Valley. Residents in the Village of Gowanda enjoy a tight knit small-town lifestyle.
Key facts
- Off street parking
- Zoar valley
- Village of gowanda
Tags
Neighborhood map
What this means for you Summary
Snapshot
- This is a 3 × 3-bed/?-bath units multifamily listed at $225k.
Deal economics
- At list price, monthly cash flow is $886 ($11k/yr) — positive. Per door: $295/mo.
- The deal already cash-flows at list — no discount required.
- Meets the 1% rule at list price ($3k rent vs $225k).
- Recommended offer: $218k (3.0% below list) — sets the bar for market timing.
Location & tenants
- Location reads 70/100 on livability (#457 in NY) — a middle-class / working-renter tenant base. Strengths: cost of living A+, housing A+, health & safety A+; Watch: schools C-, amenities F, commute F.
- Gowanda Central School District (rural): math 38% / reading 44% proficiency, ranked #513 of 590 in NY (top 87%) — families likely to look elsewhere, expect single-tenant / working-renter base with shorter leases.
- Market conditions: 24 active listings in the ZIP; 128 units permitted in Cattaraugus County in 2024 (21 in 5+ unit buildings).
Forward outlook
- In year one you build about $24k of equity ($2k loan paydown + $22k appreciation (10.0% local appreciation)).
- Cattaraugus County population projected at -28% by 2050 — secular population decline; favor cash flow + early exit over multi-decade hold.
- At projected returns (10.0% appreciation + 3.0% rent growth), your $63k cash investment doubles in ~2 years — after that, you're playing with house money.
- By year 2, paydown + projected appreciation supports a ~$39k cash-out refi (75% LTV) — recoverable capital for the next deal without selling this one.
Negotiation context
- It's been on market 60 days — a 3% lower offer ($218k) is reasonable based on typical stale-listing flexibility.
- 2 sale attempts since 13y ago; this cycle's ask has dropped $15k (6%) from the opening price — seller is motivated, your offer sets the floor, not the list.
- Current owner paid $82k; list at $225k implies a 174% gain — meaningful room to come down on a strong offer.
Risks & watch-outs
- Watch-outs: flood insurance adds $122/mo; built in 1953 — expect roof / HVAC / electrical / plumbing capex.
- Climate carrying-cost: in FEMA flood zone AO (mandatory federal flood insurance) — expect insurance premiums to compound above CPI over the hold.
Questions for the listing agent
- It's been on market 60 days. Have you received any prior offers? Is the seller open to a 3% concession, seller financing, or rate buy-down credit?
- Can we see the unit-by-unit rent roll, current vacancy, and any below-market leases? What's the average tenancy length?
- What capital expenditures (roof, boiler, parking lot, exteriors) have been made in the last 5 years, and what's planned in the next 2?
- Built in 1953 — when were the roof, HVAC, electrical panel, plumbing, and water heater last replaced?
- What's the actual annual flood-insurance premium (NFIP or private), and is the property in a SFHA with mandatory coverage?
- Is there a deadline driving the sale (1031 exchange, divorce, estate, relocation)? That informs how much negotiation room exists.
- What's the average days-on-market for RENTAL listings here right now (not sales)? A rising rental-DOM trend means longer vacancies and softer asking-rent achievability than the comps imply.
- What's the recent tenant-quality profile in this submarket — average credit score on applications, eviction rate, late-payment / NSF rate, and stable-employment percentage? A property-management company in the area should have these aggregated.
- How much new apartment / multifamily construction is in the pipeline within 1–3 miles? Heavy new supply (>2% of stock underway) typically softens rents 12–24 months out; light construction supports rent growth.
Investment metrics
- 1% rule
- 1.41% ✓
- Cap rate
- 11.67%
- Cash-on-cash
- 19.21%
- DSCR
- 1.85
- GRM
- 5.9
CMA / ARV
- ARV (median comp)
- $288,451
- List price
- $224,900
- Delta
- -22.03%
- Verdict
- UNDERPRICED
- Comps
- 6 within 1.0 mi
Show comp detail 1 sale within ~0.75 mi
| Address | Dist | Beds/Ba | Sqft | Sold | Price | $/sf | Match |
|---|---|---|---|---|---|---|---|
| 129 Chestnut St | 0.07mi | 8/3.5 (-1) | 4,172 (+13%) | 20mo | $40,000 | $10 | 52 |
Match score weights: distance 35% · size 25% · config 20% · recency 20%. Top-matched comps best support the ARV.
Projected returns pro-forma
10.0% appreciation · 3.0% rent growth · sell at horizon
- IRR
- 36.8%
- Equity multiple
- 3.84×
- Total profit
- $178,976
- Equity at exit
- $202,608
- IRR
- 31.7%
- Equity multiple
- 8.67×
- Total profit
- $482,882
- Equity at exit
- $436,931
Cash invested: $62,972 (down + closing). Projections, not guarantees.
Landlord ↔ Tenant lean methodology
- Overall (STATE)
- 15 Strongly Tenant-Friendly
- State New York
- 15 Strongly Tenant-Friendly · D+10
- County
- — inherits STATE
- City
- — inherits STATE
ZIP-level market 14070
- Home prices YoY
- 8.8%
- Active inventory
- 24
- Price-to-rent
- 17.7×
Monthly cashflow live
- Estimated rent
- $3,175 medium interval (Pro) →
- Mortgage (P&I)
- −$1,179
- Tax from tax record
- −$227 /mo · $2,728/yr
- Insurance
- −$94
- Flood insurance flood zone
- −$122 /mo · $1,468/yr
- HOA
- −$0
- Vacancy / Maint / Mgmt
- −$667
- Net cashflow
- $886
Break-even live
Sensitivity live
| Price | -10% $1,013 | -5% $949 | +0% $886 | +5% $822 | +10% $758 |
|---|---|---|---|---|---|
| Rent | -10% $635 | -5% $760 | +0% $886 | +5% $1,011 | +10% $1,136 |
| Rate | -1.0pp $999 | -0.5pp $943 | base $886 | +0.5pp $827 | +1.0pp $768 |
3-unit breakdown (identical units grouped — click to expand)
| Units | Beds | Baths | Est. rent |
|---|---|---|---|
| 3× units | 3 | — | $3,174 |
| #1 | 3 | — | $1,058 |
| #2 | 3 | — | $1,058 |
| #3 | 3 | — | $1,058 |
| Total (3 units) | $3,175 | ||
UW: 25.0% down · 7.5% · 30yr · 1.5% tax · 5.0% vac · 8.0% maint · 8.0% mgmt
Financing live
Cash to close
- Down payment
- $56,225
- Closing costs
- $6,747
- Reserves months
- —
- Total cash needed
- —
Loan-product check · same deal, 3 products live
Conventional
25% down · 7.5% · 30yr
- Down + closing
- —
- Monthly P&I
- —
- Monthly cashflow
- —
- DSCR
- —
- Eligible?
- —
Personal DTI + credit; lowest rate.
DSCR
20% down · 8.5% · 30yr
- Down + closing
- —
- Monthly P&I
- —
- Monthly cashflow
- —
- DSCR
- —
- Eligible?
- —
No personal income docs; deal must DSCR.
Hard money
10% down · 12.0% · 12mo
- Down + closing
- —
- Monthly P&I
- —
- Monthly cashflow
- —
- DSCR
- —
- Eligible?
- —
Short-term bridge; refi at stabilization.
Listing history 19 events
-
2026-06-21days on market $224,900 Active 60 DOM
-
2026-06-18days on market $224,900 Active 58 DOM
-
2026-06-17days on market $224,900 Active 57 DOM
-
2026-06-16days on market $224,900 Active 56 DOM
-
2026-06-15days on market $224,900 Active 55 DOM
-
2026-06-13days on market $224,900 Active 53 DOM
-
2026-06-12days on market $224,900 Active 52 DOM
-
2026-06-09days on market $224,900 Active 49 DOM
-
2026-06-08pricedays on market $224,900 Active 48 DOM
-
2026-06-07days on market $239,900 Active 47 DOM
-
2026-06-07days on market $239,900 Active 46 DOM
-
2026-06-04days on market $239,900 Active 43 DOM
-
2026-06-02days on market $239,900 Active 42 DOM
-
2026-06-01days on market $239,900 Active 41 DOM
-
2026-05-31days on market $239,900 Active 40 DOM
-
2026-04-20$239,900 Active 356-char remark
Show marketing remark (356 chars)
Great opportunity to buy a clean, cash flowing asset. Start or add to your portfolio with this amazing property. 4 apartments with a consistent history of tenancy and payments. 2/1 layouts with off street parking. Walkable neighborhood close to Cattaraugus Creek and Zoar Valley. Residents in the Village of Gowanda enjoy a tight knit small-town lifestyle.
-
2013-04-22soldstatus $82,000 308-char remark
Show marketing remark (308 chars)
This well maintained 4 unit property is fully rented. Each unit has living room, eat in kitchen, 1 bath and 2 bedrooms. Center entrance way leads to the apts. Tenants pay all utilities including water. Full basement access for all tenants with 4 separate areas for tenants to have their own washer and dryer.
-
2013-04-22soldstatus $82,000
Show marketing remark (308 chars)
This well maintained 4 unit property is fully rented. Each unit has living room, eat in kitchen, 1 bath and 2 bedrooms. Center entrance way leads to the apts. Tenants pay all utilities including water. Full basement access for all tenants with 4 separate areas for tenants to have their own washer and dryer.
-
2013-01-04$89,900 308-char remark
Show marketing remark (308 chars)
This well maintained 4 unit property is fully rented. Each unit has living room, eat in kitchen, 1 bath and 2 bedrooms. Center entrance way leads to the apts. Tenants pay all utilities including water. Full basement access for all tenants with 4 separate areas for tenants to have their own washer and dryer.
ⓘ Source: listings_history table (triggers on properties + properties_extension) + one-shot
backfill from property_details.listing_events for pre-trigger history.
Tax reassessment forecast NY · Partial reset (capped growth)
- Current annual tax
- $2,728 · $227/mo
- Projected year-2 tax
- $3,264 · $272/mo
- Expected delta
- +$536/yr (+$45/mo · 19.7%)
ⓘ Screening estimate from a state-policy table — verify with the county assessor before closing.
Climate risk First Street
- Flood 1/10 Low FEMA zone AO · 0% chance over 30 yrs
- Wildfire 1/10 Low
- Heat 2/10 Low 7 d/yr ≥93°F today · 17 d/yr by 30 yrs out
- Wind 1/10 Low
- Air quality 2/10 Low 1 unhealthy d/yr today · 2 by 30 yrs out
Nearby sold comps map
Loading sold comps map…
Walkable amenities ~0.75 mi
Loading nearby amenities…
Taxation est. · year 1
- Rental income
- $38,100
- − Mortgage interest
- −$12,598
- − Property taxes
- −$2,728
- − Insurance
- −$2,592
- − Repairs & maintenance
- −$3,048
- − Management
- −$3,048
- − Depreciation
- −$6,543
- Taxable income
- $7,544
- Est. tax owed @ 24.0%
- −$1,810
- After-tax cash flow
- $8,816/yr
For passive investors: Depreciation is non-cash, so a rental often shows a tax loss while cash-flowing — sheltering income. Rental losses are passive: they offset passive income freely, and up to $25,000/yr can offset ordinary (W-2) income if you actively participate and your MAGI is under $100k (phasing out to $0 by $150k); unused losses carry forward. On sale, claimed depreciation is recaptured at up to 25%, and gains may owe capital-gains tax (a 1031 exchange can defer both). Figures are a year-1 estimate at your 24.0% rate — not tax advice; consult a CPA.
Schools (NCES district)
- District
- Gowanda Central School District
- NCES district ID
- 3612390
- Math proficiency
- 38% ▼ -13.00%
- Reading proficiency
- 44% ▲ 3.00%
- Median HH income
- $43,777
- Composite
- 34.71/100
- National rank
- #5138
- State rank
- #513 of 590 in NY
Livability — Gowanda
- Score
- 70/100
- State rank
- #457
- US rank
- #7988
Category grades
Schools grade is shown separately in the Schools card above.
Census & demographics
- Census place
- Gowanda, NY
- Population (ZIP)
- 5,437
Population outlook (Cattaraugus County) Hauer SSP2
- Today (2025)
- 71,623 people
- By 2030
- 67,751 · -5.4%
- By 2040
- 59,488 · -16.9%
- By 2050
- 51,601 · -28.0%
- By 2075
- 35,025 · -51.1%
- By 2100
- 21,243 · -70.3%
Race, ethnicity, and origin ACS 2023
- Neighborhood character
- Predominantly White (81%)
- Race & ethnicity
- White 81% Native American 10% Hispanic / Latino 5% Two or more races 3% Black 1%
- Hispanic origin (detail)
- Puerto Rican 4%
- Common ancestry
- Romanian 9% Italian 3% Slovak 2%
- Foreign-born
- 3% · Canada
- Languages at home
- 94% English-only · Spanish 3% German/W. Germanic 1%
Political lean MEDSL · Cattaraugus
- 2024 margin
- Solid R (+32.8) · D 33.6% · R 66.4%
- 2008→2024 swing
- -22.2pp toward R · 2008: -10.6pp · 2024: -32.8pp
- All cycles
- 2024: R+32.8 2020: R+29.5 2016: R+34.4 2012: R+13.4 2008: R+10.6
Not yet ingested
- Civics
- —
Market trends
- HPI YoY
- ▲ 21.64%
- Current HPI
- 269.1092
- Rent YoY
- —
- Metro
- —
- State GDP YoY
- ▲ 2.60%
- F500 in state
- 92
Industry mix (Fortune 500 HQ in NY)
| Industry | F500 HQs | Revenue |
|---|---|---|
| Financial Services | 10 | $950B |
|
||
| Consumer Goods | 9 | $162B |
|
||
| Insurance | 4 | $225B |
|
||
| Telecommunications | 2 | $144B |
|
||
| Pharmaceuticals | 2 | $112B |
|
||
| Media / Entertainment | 2 | $69B |
|
||
Price history
+166.9% since first listed4 events — show timeline
- 2026-04-20 Listed $239,900 WNYREIS
- 2013-04-22 Sold (Public Records) $82,000 Public Records
- 2013-04-22 Sold (MLS) $82,000 WNYREIS
- 2013-01-04 Listed $89,900 WNYREIS
Property tax history
-0.1%/yrLatest (2025): $2,728 · -6.1% YoY. Source: county tax records.
Cash-flow waterfall
monthlySold comps — $/sqft
last 12 mo · ≤1 miLoading sold comps…