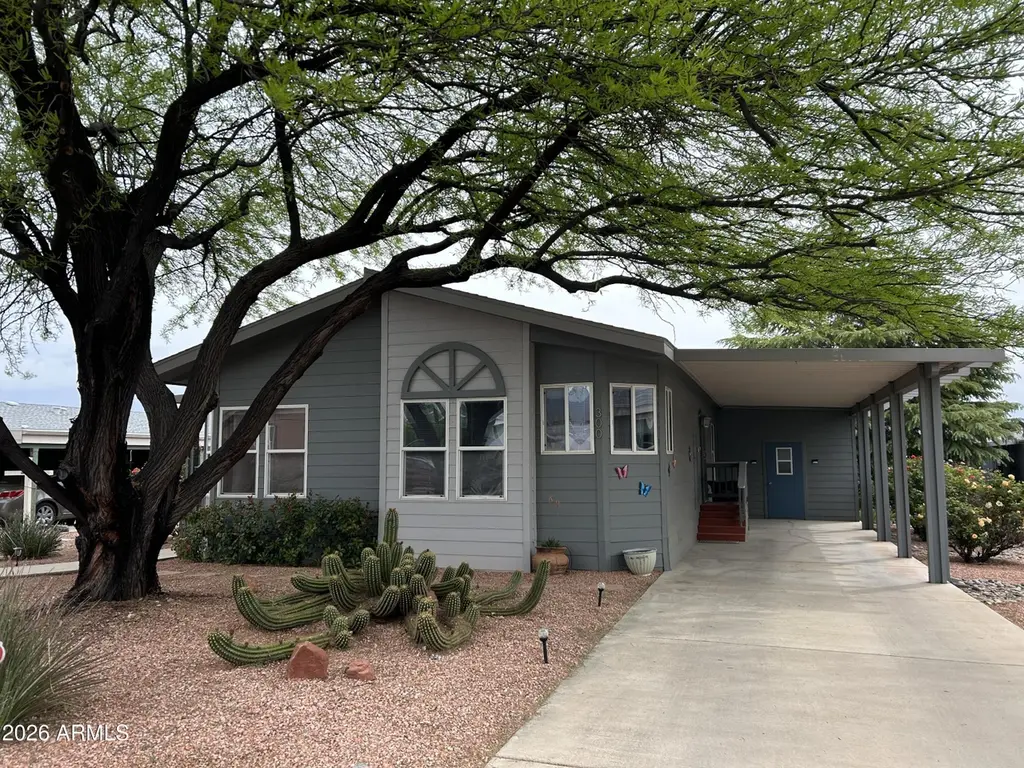
2050 W State Route 89 A -- #300 · Cottonwood, AZ
Flood risk No data
- FEMA flood zone
- —
- Chance of flooding over 30 yrs
- —
- Est. flood insurance / yr
- —
Fire risk No data
- Est. fire insurance / yr
- —
Heat risk No data
- Hot days now (above threshold)
- —
- Hot days in 30 yrs
- —
Wind risk No data
- Chance of severe wind over 30 yrs
- —
Air-quality risk No data
- Unhealthy air days now
- —
- Unhealthy air days in 30 yrs
- —
Risk factors via First Street. Map © Google.
Why this score? — see what drove the C+ grade
The composite is a weighted blend of 9 inputs, each scored 0–100. Each bar is that input's sub-score; the figure is the points it added to the 100-point composite (weight × sub-score).
- Cash flow +23.8/30.0
- ARV discount +13.6/15.0
- DSCR +7.7/10.0
- 1% rule +6.2/10.0
- Livability +4.0/5.0
- Condition / age +4.0/5.0
- Rent growth +2.4/5.0
- Schools +1.9/10.0
- Appreciation +0.0/10.0
$194,500
🖨 Deal sheet (PDF) 📄 Offer letter ✓ Due diligence
Listing remarks MLS
Your dream home is waiting for you!! The home was remodeled, new Grey Rustic Vinyl flooring. Third bedroom does have carpet. The home was painted inside and out. If you light this home has skylights and many windows with mountain view from the formal dinning room. so many upgrades MAKE time to see this home today!
Key facts
- Study library
- Living room
- Dining room
Tags
Property features AI
Finance
- Financial info: Current financing: Other
- HOA & community: Land lease community ($820 monthly); No association fees included; Community amenities: pool, community spa (heated), golf, pickleball courts, biking/walking paths, fitness center
Exterior
- Parking: 2 covered parking spaces; 2 carport spaces
- Security: Gated community
- Utilities: City water; Public sewer
- Home design: Manufactured / mobile home; Attached property; Leasehold ownership; Mountain views
- Construction: Vinyl siding and block construction; Composition roof; Building area reported by owner
- Exterior features: Heated spa; Shed(s); Desert front and back landscaping; Private maintained road; No fencing
Interior
- Kitchen: Built-in microwave; Refrigerator; Dishwasher; Garbage disposal; Reverse osmosis water filtration
- Bedrooms: 3 possible bedrooms
- Flooring: Carpet; Laminate
- Bathrooms: 2 full bathrooms
- Heating & cooling: Heat pump heating; Heat pump cooling; Central air
- Interior features: Vaulted ceilings; Kitchen island; Pantry; Bidet; Full bathroom in primary bedroom; Skylights; Dual-pane windows
Neighborhood map
What this means for you Summary
Snapshot
- This is a 2-bed/2.0-bath manufactured listed at $194k. Condition is rated good.
Deal economics
- At list price, monthly cash flow is $373 ($4k/yr) — positive.
- The deal already cash-flows at list — no discount required.
- Meets the 1% rule at list price ($2k rent vs $194k).
- Recommended offer: $183k (6.0% below list) — sets the bar for market timing.
- Cap rate 8.6% vs local median 3.8% in Cottonwood — top-decile yield for the area; either an underpriced asset or a hidden risk that comps aren't pricing in. Stress-test before assuming the spread holds.
Location & tenants
- Location reads 79/100 on livability (#7 in AZ, #2,176 nationally) — a middle-class / working-renter tenant base. Strengths: health & safety A+, commute A, cost of living A; Watch: employment D, amenities F.
- Cottonwood-Oak Creek Elementary District (4487) (town): math 17% / reading 28% proficiency, ranked #174 of 249 in AZ (top 70%) — low school quality limits family demand, transient renter base, plan for 1-2y turnover.
- Market conditions: Rents soft (-0.2%/yr); 270 active listings in the ZIP; 6 comparable units currently listed for rent nearby; rentals at typical pace (median 15d on market — plan ~3-4 weeks tenant-placement turnaround); 2,062 units permitted in Yavapai County in 2024 (98 in 5+ unit buildings).
- At $2,173/mo this rent would consume 45% of the median local household income ($57k/yr) (locally 894% of renters already pay >50% of income on rent) — very limited rent-growth headroom before tenants either downsize or default.
Forward outlook
- Local home prices are declining (-3.0%/yr); year-one equity from $1k of loan paydown is wiped out by about $6k of value loss. Plan a longer hold.
- Yavapai County population projected at +10% by 2050 — modest demand growth; plan on rents tracking national, not racing it.
Negotiation context
- It's been on market 74 days — a 6% lower offer ($183k) is reasonable based on typical stale-listing flexibility.
- 3 sale attempts since 3y ago with the ask held roughly flat each time — persistent listings suggest the price (not the market) is what's stuck; bring a comps-based counter.
Questions for the listing agent
- It's been on market 74 days. Have you received any prior offers? Is the seller open to a 6% concession, seller financing, or rate buy-down credit?
- Why hasn't it sold? Are there any deal-killer items the seller is aware of (foundation, flood, title, zoning, code violations)?
- Is there a deadline driving the sale (1031 exchange, divorce, estate, relocation)? That informs how much negotiation room exists.
- What's the average days-on-market for RENTAL listings here right now (not sales)? A rising rental-DOM trend means longer vacancies and softer asking-rent achievability than the comps imply.
- What's the recent tenant-quality profile in this submarket — average credit score on applications, eviction rate, late-payment / NSF rate, and stable-employment percentage? A property-management company in the area should have these aggregated.
- How much new for-sale + rental construction is in the pipeline within 1–3 miles? Heavy new supply typically softens prices + rents 12–24 months out; constrained supply supports both.
Investment metrics
- 1% rule
- 1.12% ✓
- Cap rate
- 8.59%
- Cash-on-cash
- 8.21%
- DSCR
- 1.37
- GRM
- 7.5
CMA / ARV
- ARV (on-the-fly)
- $225,120
- Comps found
- 12
Show comp detail 12 sales within ~0.75 mi
| Address | Dist | Beds/Ba | Sqft | Sold | Price | $/sf | Match |
|---|---|---|---|---|---|---|---|
| 1216 Hogan Dr | 0.20mi | 2/2.0 | 1,600 (-5%) | 1mo | $248,000 | $155 | 82 |
| 2050 W State Route 89-a -- #344 | 0.26mi | 3/2.0 (+1) | 1,680 (0%) | 2mo | $200,000 | $119 | 81 |
| 1024 Rankin Ave | 0.17mi | 3/2.0 (+1) | 1,605 (-4%) | 2mo | $199,900 | $125 | 78 |
| 2050 W SR 89a -- #104 | 0.00mi | 2/2.0 | 1,456 (-13%) | 1mo | $118,000 | $81 | 77 |
| 880 W On The Greens Blvd | 0.31mi | 3/2.0 (+1) | 1,620 (-4%) | 2mo | $249,900 | $154 | 73 |
| 700 W On The Greens Blvd | 0.50mi | 2/2.0 | 1,720 (+2%) | 1mo | $277,500 | $161 | 72 |
| 2050 W State Route 89a -- #345 | 0.14mi | 3/2.0 (+1) | 1,800 (+7%) | 6mo | $240,300 | $134 | 71 |
| 2050 W SR 89-a -- #96 | 0.26mi | 3/2.0 (+1) | 1,568 (-7%) | 1mo | $155,000 | $99 | 71 |
| 2050 W St Route 89a -- #273 | 0.00mi | 3/2.0 (+1) | 1,440 (-14%) | 7mo | $150,000 | $104 | 65 |
| 992 Trevino Dr | 0.13mi | 3/2.0 (+1) | 1,431 (-15%) | 3mo | $195,000 | $136 | 62 |
| 1181 Sunrise Dr | 0.63mi | 3/2.0 (+1) | 1,739 (+4%) | 8mo | $345,000 | $198 | 53 |
| 1065 Crenshaw Ave | 0.49mi | 3/2.0 (+1) | 1,440 (-14%) | 2mo | $180,000 | $125 | 47 |
Match score weights: distance 35% · size 25% · config 20% · recency 20%. Top-matched comps best support the ARV.
Projected returns pro-forma
-3.0% appreciation · 0.0% rent growth · sell at horizon
- IRR
- -7.2%
- Equity multiple
- 0.74×
- Total profit
- $-14,119
- Equity at exit
- $29,001
- IRR
- -1.9%
- Equity multiple
- 0.89×
- Total profit
- $-6,213
- Equity at exit
- $16,817
Cash invested: $54,460 (down + closing). Projections, not guarantees.
Landlord ↔ Tenant lean methodology
- Overall (STATE)
- 87 Strongly Landlord-Friendly
- State Arizona
- 87 Strongly Landlord-Friendly · R+3
- County
- — inherits STATE
- City
- — inherits STATE
ZIP-level market 86326
- Home prices YoY
- -32.2%
- Rents YoY
- -0.2%
- Active inventory
- 270
- Price-to-rent
- 7.5×
Monthly cashflow live
- Estimated rent
- $2,173 high interval (Pro) →
- Mortgage (P&I)
- −$1,020
- Tax est. 1.5%
- −$243 /mo · $2,918/yr
- Insurance
- −$81
- HOA
- −$0
- Vacancy / Maint / Mgmt
- −$456
- Net cashflow
- $373
Break-even live
Sensitivity live
| Price | -10% $507 | -5% $440 | +0% $373 | +5% $305 | +10% $238 |
|---|---|---|---|---|---|
| Rent | -10% $201 | -5% $287 | +0% $373 | +5% $458 | +10% $544 |
| Rate | -1.0pp $471 | -0.5pp $422 | base $373 | +0.5pp $322 | +1.0pp $271 |
UW: 25.0% down · 7.5% · 30yr · 1.5% tax · 5.0% vac · 8.0% maint · 8.0% mgmt
Financing live
Cash to close
- Down payment
- $48,625
- Closing costs
- $5,835
- Reserves months
- —
- Total cash needed
- —
Loan-product check · same deal, 3 products live
Conventional
25% down · 7.5% · 30yr
- Down + closing
- —
- Monthly P&I
- —
- Monthly cashflow
- —
- DSCR
- —
- Eligible?
- —
Personal DTI + credit; lowest rate.
DSCR
20% down · 8.5% · 30yr
- Down + closing
- —
- Monthly P&I
- —
- Monthly cashflow
- —
- DSCR
- —
- Eligible?
- —
No personal income docs; deal must DSCR.
Hard money
10% down · 12.0% · 12mo
- Down + closing
- —
- Monthly P&I
- —
- Monthly cashflow
- —
- DSCR
- —
- Eligible?
- —
Short-term bridge; refi at stabilization.
Rent comps 6 comps
| Address | Beds | Baths | Sqft | Rent | $/sqft | DOM | Units | Dist |
|---|---|---|---|---|---|---|---|---|
| 992 Sterling Ln Cottonwood, AZ | 3.0 | 2.0 | 1652 | $2,395 | $1.45 | 22d | 1 | 0.23mi |
| 1910 W Trail Blazer Dr Cottonwood, AZ | 2.0 | 2.0 | 1278 | $2,900 | $2.27 | 14d | 1 | 0.95mi |
| 255 S Cottonwood Ranch Rd Cottonwood, AZ | 3.0 | 2.0 | 1695 | $2,195 | $1.29 | 14d | 1 | 0.98mi |
| 1121 Old Jerome Hwy Clarkdale, AZ | 2.0 | 2.0 | 1981 | $2,185 | $1.10 | 22d | 1 | 1.28mi |
| 844 Tiablanca Rd Clarkdale, AZ | 2.0 | 2.0 | 1333 | $1,995 | $1.50 | 14d | 1 | 1.34mi |
| 564 Crossbar Ln Cottonwood, AZ | 3.0 | 2.0 | 1290 | $2,250 | $1.74 | 14d | 1 | 1.50mi |
Listing history 23 events
-
2026-06-21days on market $194,500 Active 74 DOM
-
2026-06-18days on market $194,500 Active 71 DOM
-
2026-06-17days on market $194,500 Active 70 DOM
-
2026-06-16days on market $194,500 Active 69 DOM
-
2026-06-15days on market $194,500 Active 68 DOM
-
2026-06-14days on market $194,500 Active 66 DOM
-
2026-06-13days on market $194,500 Active 65 DOM
-
2026-06-10days on market $194,500 Active 63 DOM
-
2026-06-09days on market $194,500 Active 62 DOM
-
2026-06-08days on market $194,500 Active 61 DOM
-
2026-06-07days on market $194,500 Active 60 DOM
-
2026-06-05days on market $194,500 Active 57 DOM
-
2026-06-03days on market $194,500 Active 56 DOM
-
2026-06-02days on market $194,500 Active 55 DOM
-
2026-06-01days on market $194,500 Active 54 DOM
-
2026-05-31days on market $194,500 Active 53 DOM
-
2026-05-30days on market $194,500 Active 52 DOM
-
2026-05-20price $194,500
-
2026-04-08$199,500 Active
-
2024-05-17soldstatus $230,000 317-char remark
Show marketing remark (317 chars)
Your dream home is waiting for you!! The home was remodeled, new Grey Rustic Vinyl flooring. Third bedroom does have carpet. The home was painted inside and out. If you light this home has skylights and many windows with mountain view from the formal dinning room. so many upgrades MAKE time to see this home today!
-
2024-03-24$235,000 317-char remark
Show marketing remark (317 chars)
Your dream home is waiting for you!! The home was remodeled, new Grey Rustic Vinyl flooring. Third bedroom does have carpet. The home was painted inside and out. If you light this home has skylights and many windows with mountain view from the formal dinning room. so many upgrades MAKE time to see this home today!
-
2024-03-12historical
-
2023-06-22$249,000
ⓘ Source: listings_history table (triggers on properties + properties_extension) + one-shot
backfill from property_details.listing_events for pre-trigger history.
Nearby sold comps map
Loading sold comps map…
Walkable amenities ~0.75 mi
Loading nearby amenities…
Taxation est. · year 1
- Rental income
- $26,078
- − Mortgage interest
- −$10,895
- − Property taxes
- −$2,918
- − Insurance
- −$972
- − Repairs & maintenance
- −$2,086
- − Management
- −$2,086
- − Depreciation
- −$5,658
- Taxable income
- $1,462
- Est. tax owed @ 24.0%
- −$351
- After-tax cash flow
- $4,121/yr
For passive investors: Depreciation is non-cash, so a rental often shows a tax loss while cash-flowing — sheltering income. Rental losses are passive: they offset passive income freely, and up to $25,000/yr can offset ordinary (W-2) income if you actively participate and your MAGI is under $100k (phasing out to $0 by $150k); unused losses carry forward. On sale, claimed depreciation is recaptured at up to 25%, and gains may owe capital-gains tax (a 1031 exchange can defer both). Figures are a year-1 estimate at your 24.0% rate — not tax advice; consult a CPA.
Condition & rehab AI · 12 photos
This home is move-in ready with updated interiors and a good condition exterior. It has a good condition roof and foundation, and the landscaping can be improved to further enhance its curb appeal.
Value-add opportunities
- Both Paint exterior — Enhances curb appeal and value
- Both Replace landscaping — Improves curb appeal and adds value
- Both Replace flooring in living areas — Modernizes the space and adds value
Renovation cost estimate screening
Value-add ROI direction
- Both Paint exterior — Enhances curb appeal and value ↑
- Both Replace landscaping — Improves curb appeal and adds value ↑
- Both Replace flooring in living areas — Modernizes the space and adds value ↑
ⓘ Cost ranges are severity-bucket heuristics (US national rule-of-thumb). Get contractor quotes + a written scope before underwriting a rehab budget.
Schools (NCES district)
- District
- Cottonwood-Oak Creek Elementary District (4487)
- NCES district ID
- 0402370
- Math proficiency
- 17% ▼ -10.00%
- Reading proficiency
- 28% ▼ -7.00%
- Median HH income
- $41,740
- Composite
- 19.16/100
- National rank
- #8822
- State rank
- #174 of 249 in AZ
Livability — Cottonwood
- Score
- 79/100
- State rank
- #7
- US rank
- #2176
Category grades
Schools grade is shown separately in the Schools card above.
Census & demographics
- Census place
- Cottonwood, AZ
- County
- Yavapai County · 190,406 people
- City population
- 24,852
- Metro
- Prescott Valley-Prescott, AZ
- Population (ZIP)
- 24,852
- Household income
- $57,378
- Rent vs Own
- Severe rent burden
- 894.0
Population outlook (Yavapai County) Hauer SSP2
- Today (2025)
- 241,389 people
- By 2030
- 249,523 · +3.4%
- By 2040
- 259,966 · +7.7%
- By 2050
- 264,736 · +9.7%
- By 2075
- 269,334 · +11.6%
- By 2100
- 256,505 · +6.3%
Race, ethnicity, and origin ACS 2023
- Neighborhood character
- Predominantly White (73%)
- Race & ethnicity
- White 73% Hispanic / Latino 20% Two or more races 14% Native American 1%
- Hispanic origin (detail)
- Mexican 17%
- Common ancestry
- Italian 3% Romanian 3% Lithuanian 2%
- Foreign-born
- 12% · Canada
- Languages at home
- 84% English-only · Spanish 14% German/W. Germanic 1%
Political lean MEDSL · Yavapai
- 2024 margin
- Solid R (+33.9) · D 32.6% · R 66.5%
- 2008→2024 swing
- -9.5pp toward R · 2008: -24.4pp · 2024: -33.9pp
- All cycles
- 2024: R+33.9 2020: R+29.3 2016: R+31.4 2012: R+30.7 2008: R+24.4
Not yet ingested
- Civics
- —
Market trends
- HPI YoY
- ▼ -165.27%
- Current HPI
- 347.5058
- Rent YoY
- ▼ -0.22%
- Metro
- Prescott Valley-Prescott, AZ
- State GDP YoY
- ▲ 4.54%
- F500 in state
- 20
Industry mix (Fortune 500 HQ in AZ)
| Industry | F500 HQs | Revenue |
|---|---|---|
| Technology | 2 | $13B |
|
||
| Mining / Metals | 1 | $23B |
|
||
| Environmental Services | 1 | $16B |
|
||
| Metals / Steel | 1 | $14B |
|
||
| Technology Distribution | 1 | $9B |
|
||
| Homebuilding | 1 | $8B |
|
||
Price history
-21.9% since first listed6 events — show timeline
- 2026-05-20 Price Changed $194,500 ARMLS
- 2026-04-08 Listed $199,500 ARMLS
- 2024-05-17 Sold (MLS) $230,000 ARMLS
- 2024-03-24 Listed $235,000 ARMLS
- 2024-03-12 Listing Removed — ARMLS
- 2023-06-22 Listed $249,000 ARMLS
Cash-flow waterfall
monthlySold comps — $/sqft
last 12 mo · ≤1 miLoading sold comps…