1389 Featherstone Ave · Bolivar Peninsula, TX
Flood risk 10/10 · Severe
- FEMA flood zone
- VE
- Chance of flooding over 30 yrs
- 0.99%
- Est. flood insurance / yr
- $5,013 – $11,043
Fire risk 5/10 · Moderate
- Est. fire insurance / yr
- $1,222 – $2,270
Heat risk 10/10 · Severe
- Hot days now (above 107°F)
- 7 days/yr
- Hot days in 30 yrs
- 25 days/yr
Wind risk 10/10 · Severe
- Chance of severe wind over 30 yrs
- 99.0%
Air-quality risk 2/10 · Minimal
- Unhealthy air days now
- 1 days/yr
- Unhealthy air days in 30 yrs
- 1 days/yr
Risk factors via First Street. Map © Google.
Why this score? — see what drove the D- grade
The composite is a weighted blend of 9 inputs, each scored 0–100. Each bar is that input's sub-score; the figure is the points it added to the 100-point composite (weight × sub-score).
- Cash flow +9.1/30.0
- ARV discount +6.1/15.0
- Schools +5.1/10.0
- Appreciation +5.0/10.0
- Livability +3.2/5.0
- 1% rule +2.9/10.0
- DSCR +2.5/10.0
- Rent growth +2.5/5.0
- Condition / age +2.5/5.0
$499,880
🖨 Deal sheet 📄 Offer letter ✓ Due diligence
Listing remarks MLS
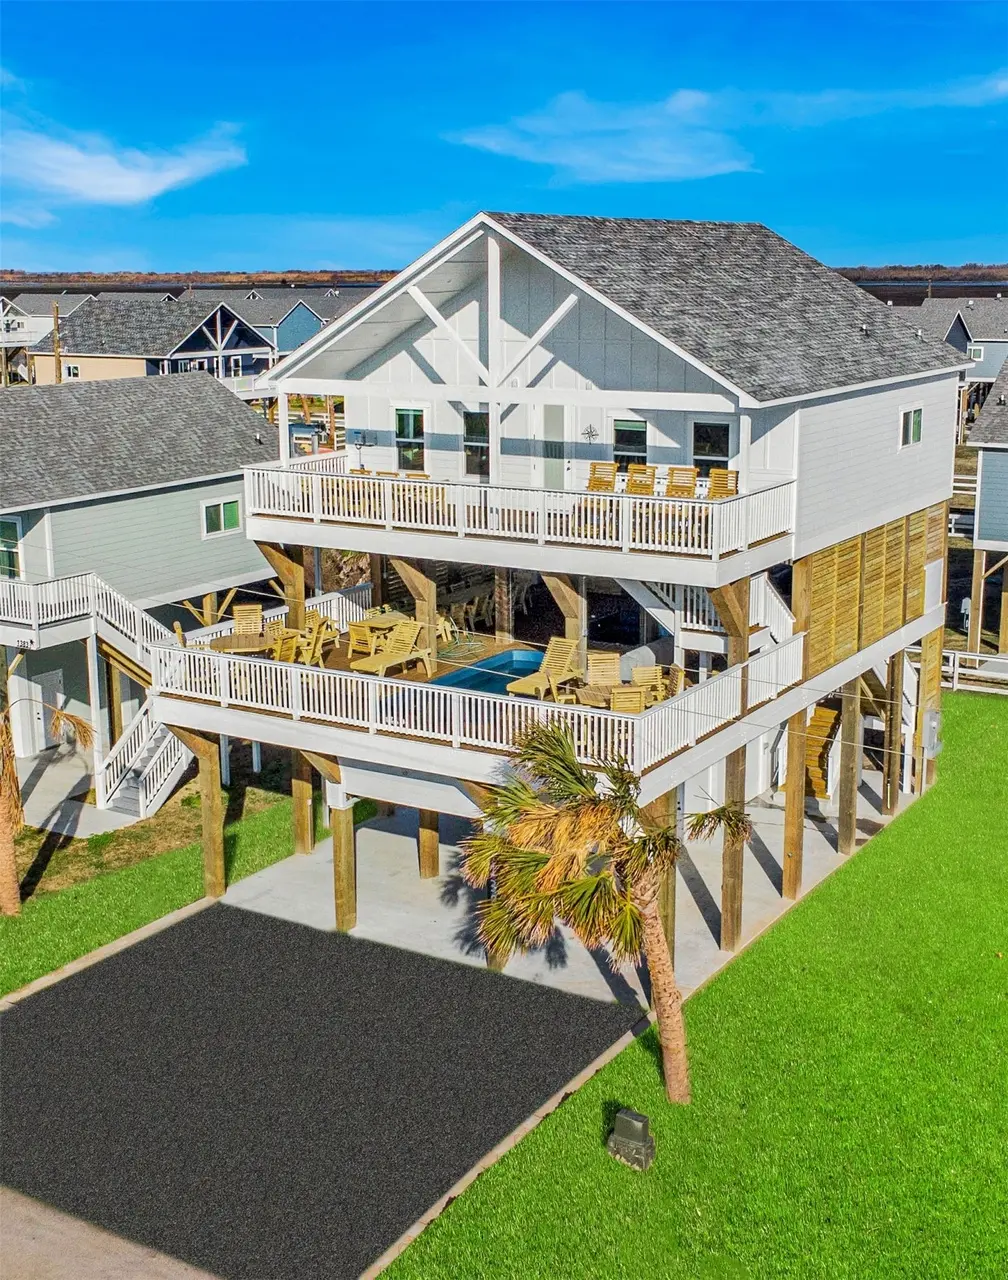
Let the magic begin! Beautiful 3 bedroom/ 3 Bath Villas at Rollover Bay Home w/options: loft, quartz counters, outside shower & 4" deck extension-Amenities: Elevated Pool/Pool Deck, 2-Story Entertainment Pavilion, Ocean Observatory Deck, Kids Playground, Multiple Lounge Areas and a Prime Bolivar Peninsula location. This is the BASE PRICE for the 3 bed/3 bath floor plan offers 1,224 square feet of livable space, a usable loft option of 281 SF, ALL with a covered front porch & vaulted ceilings in the living space. Upgrade options available: Garage, Outside Shower, RV package, Quartz Kitchen Counters & Additonal Deck Space. Upgrade options are additional costs on top of the base price. Photos are a representation of what the home will looke like since the home is not built yet.This is the base price for the mid deck villa with no upgrades or furnishings. Short-term rentals allowed/ Vacation Rentals are allowed.
Key facts
- 5,000 sq ft lot
- Garage
- Listed 672 days
Neighborhood map
What this means for you Summary
Snapshot
- This is a 3-bed/3.5-bath land listed at $500k.
Deal economics
- At list price, monthly cash flow is $-1k ($-13k/yr) — negative.
- To cash-flow at today's rent, offer at most $347k (30.6% below list).
- To meet the 1% rule (rent ≥ 1% of price), the offer needs to be $397k (20.6% below list).
- Recommended offer: $347k (30.6% below list) — sets the bar for cash-flow.
- Cap rate 5.4% vs local median 2.1% in Bolivar Peninsula — top-decile yield for the area; either an underpriced asset or a hidden risk that comps aren't pricing in. Stress-test before assuming the spread holds.
Location & tenants
- Location reads 65/100 on livability (#719 in TX) — a middle-class / working-renter tenant base. Strengths: crime A+, cost of living A+, housing A+; Watch: schools D+, amenities F, commute F.
- High Island ISD (rural): math 65% / reading 50% proficiency, ranked #177 of 1,141 in TX (top 16%) — acceptable for families but not a draw, mixed tenant base, ~2y average lease.
- Market conditions: 227 active listings in the ZIP; 5 comparable units currently listed for rent nearby; rentals leasing fast (median 7d on market — plan ~1-2 weeks tenant-placement turnaround); 3,258 units permitted in Galveston County in 2024 (0 in 5+ unit buildings).
Forward outlook
- In year one you build about $18k of equity ($3k loan paydown + $15k appreciation (3.0% local appreciation)).
- Galveston County population projected at +43% by 2050 — long-run rental-demand tailwind backs the buy-and-hold thesis.
- By year 2, paydown + projected appreciation supports a ~$30k cash-out refi (75% LTV) — recoverable capital for the next deal without selling this one.
Negotiation context
- It's been on market 673 days — a 12% lower offer ($440k) is reasonable based on typical stale-listing flexibility.
- 2 sale attempts since 4y ago with the ask held roughly flat each time — persistent listings suggest the price (not the market) is what's stuck; bring a comps-based counter.
Risks & watch-outs
- Watch-outs: flood insurance adds $669/mo.
- Climate carrying-cost: in FEMA flood zone VE (mandatory federal flood insurance); severe wind risk, 99% chance of damaging wind over 30y; moderate wildfire risk; extreme-heat days projected 7→25/yr by 2055 (HVAC capex compounding) — expect insurance premiums to compound above CPI over the hold.
Questions for the listing agent
- What do current leases actually rent for vs. the listed asking? Can we see a recent rent roll and the last 12 months of T-12 income?
- It's been on market 673 days. Have you received any prior offers? Is the seller open to a 31% concession, seller financing, or rate buy-down credit?
- What's the actual annual flood-insurance premium (NFIP or private), and is the property in a SFHA with mandatory coverage?
- What does the HOA fee cover, when was the last increase, and are there any pending special assessments or reserve-fund shortfalls?
- Why hasn't it sold? Are there any deal-killer items the seller is aware of (foundation, flood, title, zoning, code violations)?
- Is there a deadline driving the sale (1031 exchange, divorce, estate, relocation)? That informs how much negotiation room exists.
- Schools are D-rated, which usually means shorter tenancies and higher turnover. Who's the typical renter profile here, and what's been the actual vacancy rate?
- The area grade is low — what's the realistic commute time and amenity access for the typical tenant pool here? Any planned neighborhood developments (good or bad) we should know about?
- What's the average days-on-market for RENTAL listings here right now (not sales)? A rising rental-DOM trend means longer vacancies and softer asking-rent achievability than the comps imply.
- What's the recent tenant-quality profile in this submarket — average credit score on applications, eviction rate, late-payment / NSF rate, and stable-employment percentage? A property-management company in the area should have these aggregated.
- How much new for-sale + rental construction is in the pipeline within 1–3 miles? Heavy new supply typically softens prices + rents 12–24 months out; constrained supply supports both.
Investment metrics
- 1% rule
- 0.79% ✗
- Cap rate
- 5.36%
- Cash-on-cash
- -3.32%
- DSCR
- 0.85
- GRM
- 10.5
CMA / ARV
- ARV (median comp)
- $484,800
- List price
- $499,880
- Delta
- 3.11%
- Verdict
- FAIR
- Comps
- 20 within 1.0 mi
Projected returns pro-forma
3.0% appreciation · 3.0% rent growth · sell at horizon
- IRR
- -0.8%
- Equity multiple
- 0.95×
- Total profit
- $-6,569
- Equity at exit
- $224,768
- IRR
- 3.3%
- Equity multiple
- 1.51×
- Total profit
- $71,714
- Equity at exit
- $346,394
Cash invested: $139,966 (down + closing). Projections, not guarantees.
Landlord ↔ Tenant lean methodology
- Overall (STATE)
- 87 Strongly Landlord-Friendly
- State Texas
- 87 Strongly Landlord-Friendly · R+5
- County
- — inherits STATE
- City
- — inherits STATE
ZIP-level market 77617
- Active inventory
- 227
- Price-to-rent
- 10.5×
Monthly cashflow live
- Estimated rent
- $3,968 high interval (Pro) →
- Mortgage (P&I)
- −$2,621
- Tax est. 1.5%
- −$625 /mo · $7,498/yr
- Insurance
- −$208
- Flood insurance flood zone
- −$669 /mo · $8,028/yr
- HOA
- −$68
- Vacancy / Maint / Mgmt
- −$833
- Net cashflow
- $-1,057
Break-even live
UW: 25.0% down · 7.5% · 30yr · 1.5% tax · 5.0% vac · 8.0% maint · 8.0% mgmt
Financing live
Cash to close
- Down payment
- $124,970
- Closing costs
- $14,996
- Reserves months
- —
- Total cash needed
- —
Loan-product check · same deal, 3 products live
Conventional
25% down · 7.5% · 30yr
- Down + closing
- —
- Monthly P&I
- —
- Monthly cashflow
- —
- DSCR
- —
- Eligible?
- —
Personal DTI + credit; lowest rate.
DSCR
20% down · 8.5% · 30yr
- Down + closing
- —
- Monthly P&I
- —
- Monthly cashflow
- —
- DSCR
- —
- Eligible?
- —
No personal income docs; deal must DSCR.
Hard money
10% down · 12.0% · 12mo
- Down + closing
- —
- Monthly P&I
- —
- Monthly cashflow
- —
- DSCR
- —
- Eligible?
- —
Short-term bridge; refi at stabilization.
Rent comps 5 comps
| Address | Beds | Baths | Sqft | Rent | $/sqft | DOM | Units | Dist |
|---|---|---|---|---|---|---|---|---|
| 1062 Cedar Ln Unit 1466498P Port Bolivar, TX | 4.0 | 2.0 | 1130 | $3,936 | $3.48 | 1d | 1 | 0.07mi |
| 998 Dolly St Unit 1223259P Port Bolivar, TX | 3.0 | 2.0 | 1313 | $2,663 | $2.03 | 5d | 1 | 0.31mi |
| 994 Dolly St Unit 1223247P Port Bolivar, TX | 4.0 | 2.0 | 1291 | $3,914 | $3.03 | 20d | 1 | 0.32mi |
| 986 Dolly St Unit 1281079P Crystal Beach, TX | 3.0 | 2.0 | 1646 | $4,893 | $2.97 | 7d | 1 | 0.33mi |
| 975 Dolly St Unit 1364178P Gilchrist, TX | 3.0 | 2.0 | 1593 | $4,556 | $2.86 | 12d | 1 | 0.36mi |
HOA detail
- Monthly dues
- $68 · $816/yr
- Likely covers
- pool
Listing history 18 events
-
2026-06-18days on market $499,880 Active 673 DOM
-
2026-06-17days on market $499,880 Active 672 DOM
-
2026-06-16days on market $499,880 Active 671 DOM
-
2026-06-15days on market $499,880 Active 670 DOM
-
2026-06-13days on market $499,880 Active 668 DOM
-
2026-06-12days on market $499,880 Active 667 DOM
-
2026-06-10days on market $499,880 Active 664 DOM
-
2026-06-08days on market $499,880 Active 663 DOM
-
2026-06-08days on market $499,880 Active 662 DOM
-
2026-06-07days on market $499,880 Active 661 DOM
-
2026-06-03days on market $499,880 Active 658 DOM
-
2026-06-02days on market $499,880 Active 657 DOM
-
2026-06-01days on market $499,880 Active 656 DOM
-
2026-05-31days on market $499,880 Active 655 DOM
-
2024-08-14$499,880 Active 938-char remark
Show marketing remark (938 chars)
Let the magic begin! Beautiful 3 bedroom/ 3 Bath Villas at Rollover Bay Home w/options: loft, quartz counters, outside shower & 4" deck extension-Amenities: Elevated Pool/Pool Deck, 2-Story Entertainment Pavilion, Ocean Observatory Deck, Kids Playground, Multiple Lounge Areas and a Prime Bolivar Peninsula location. This is the BASE PRICE for the 3 bed/3 bath floor plan offers 1,224 square feet of livable space, a usable loft option of 281 SF, ALL with a covered front porch & vaulted ceilings in the living space. Upgrade options available: Garage, Outside Shower, RV package, Quartz Kitchen Counters & Additonal Deck Space. Upgrade options are additional costs on top of the base price. Photos are a representation of what the home will looke like since the home is not built yet.This is the base price for the mid deck villa with no upgrades or furnishings. Short-term rentals allowed/ Vacation Rentals are allowed.
-
2023-02-07soldstatus Sold 281-char remark
Show marketing remark (281 chars)
Welcome to 1389 Featherstone Ave, a beautiful piece of bay side property sitting right outside of the new Villas at Rollover Bay. Just 300 yards from the beach, this lot is perfect for a family vacation. Don't miss out on this amazing opportunity to build your dream vacation home!
-
2023-01-18status Pending 281-char remark
Show marketing remark (281 chars)
Welcome to 1389 Featherstone Ave, a beautiful piece of bay side property sitting right outside of the new Villas at Rollover Bay. Just 300 yards from the beach, this lot is perfect for a family vacation. Don't miss out on this amazing opportunity to build your dream vacation home!
-
2022-10-21$53,000 Active 281-char remark
Show marketing remark (281 chars)
Welcome to 1389 Featherstone Ave, a beautiful piece of bay side property sitting right outside of the new Villas at Rollover Bay. Just 300 yards from the beach, this lot is perfect for a family vacation. Don't miss out on this amazing opportunity to build your dream vacation home!
ⓘ Source: listings_history table (triggers on properties + properties_extension) + one-shot
backfill from property_details.listing_events for pre-trigger history.
Climate risk First Street
- Flood 10/10 Extreme FEMA zone VE · 99% chance over 30 yrs
- Wildfire 5/10 Major
- Heat 10/10 Extreme 7 d/yr ≥107°F today · 25 d/yr by 30 yrs out
- Wind 10/10 Extreme 99% chance of damaging wind over 30 yrs
- Air quality 2/10 Low 1 unhealthy d/yr today · 1 by 30 yrs out
Nearby sold comps map
Loading sold comps map…
Walkable amenities ~0.75 mi
Loading nearby amenities…
Taxation est. · year 1
- Rental income
- $47,619
- − Mortgage interest
- −$28,001
- − Property taxes
- −$7,498
- − Insurance
- −$10,527
- − Repairs & maintenance
- −$3,809
- − Management
- −$3,809
- − HOA
- −$816
- − Depreciation
- −$14,542
- Taxable loss
- −$21,385
- Est. tax savings @ 24.0%
- +$5,132
- After-tax cash flow
- $-7,548/yr
For passive investors: Depreciation is non-cash, so a rental often shows a tax loss while cash-flowing — sheltering income. Rental losses are passive: they offset passive income freely, and up to $25,000/yr can offset ordinary (W-2) income if you actively participate and your MAGI is under $100k (phasing out to $0 by $150k); unused losses carry forward. On sale, claimed depreciation is recaptured at up to 25%, and gains may owe capital-gains tax (a 1031 exchange can defer both). Figures are a year-1 estimate at your 24.0% rate — not tax advice; consult a CPA.
Schools (NCES district)
- District
- High Island ISD
- NCES district ID
- 4823160
- Math proficiency
- 65% ▲ 30.00%
- Reading proficiency
- 50% ▲ 15.00%
- Median HH income
- $49,447
- Composite
- 50.69/100
- National rank
- #3933
- State rank
- #177 of 1141 in TX
Livability — Bolivar Peninsula
- Score
- 65/100
- State rank
- #719
- US rank
- #13437
Category grades
Schools grade is shown separately in the Schools card above.
Census & demographics
- Census place
- Bolivar Peninsula, TX
- City population
- 2,957
- Population (ZIP)
- 38
Population outlook (Galveston County) Hauer SSP2
- Today (2025)
- 390,640 people
- By 2030
- 425,226 · +8.9%
- By 2040
- 493,765 · +26.4%
- By 2050
- 559,698 · +43.3%
- By 2075
- 719,260 · +84.1%
- By 2100
- 819,628 · +109.8%
Race, ethnicity, and origin ACS 2023
- Neighborhood character
- Predominantly White (100%)
- Race & ethnicity
- White 100%
- Common ancestry
- Lithuanian 18% Serbian 18%
- Languages at home
- 84% English-only · Spanish 16%
Political lean MEDSL · Galveston
- 2024 margin
- Strong R (+27.4) · D 35.7% · R 63.1% · Other 1.2%
- 2008→2024 swing
- -7.9pp toward R · 2008: -19.5pp · 2024: -27.4pp
- All cycles
- 2024: R+27.4 2020: R+22.6 2016: R+22.6 2012: R+26.9 2008: R+19.5
Not yet ingested
- Civics
- —
Market trends
- HPI YoY
- —
- Current HPI
- —
- Rent YoY
- —
- Metro
- —
- State GDP YoY
- ▲ 3.95%
- F500 in state
- 110
Industry mix (Fortune 500 HQ in TX)
| Industry | F500 HQs | Revenue |
|---|---|---|
| Energy | 16 | $1,198B |
|
||
| Technology | 5 | $198B |
|
||
| Engineering / Construction | 4 | $72B |
|
||
| Energy Services | 3 | $60B |
|
||
| Utilities | 3 | $41B |
|
||
| Healthcare | 2 | $330B |
|
||
Price history
+843.2% since first listed4 events — show timeline
- 2024-08-14 Listed $499,880 HARMLS
- 2023-02-07 Sold (MLS) — HARMLS
- 2023-01-18 Pending — HARMLS
- 2022-10-21 Listed $53,000 HARMLS
Property tax history
+29.5%/yrLatest (2025): $926 · -5.2% YoY. Source: county tax records.
Cash-flow waterfall
monthlySold comps — $/sqft
last 12 mo · ≤1 miLoading sold comps…