2715 Trail Ride Way · Heartland, TX
Flood risk No data
- FEMA flood zone
- —
- Chance of flooding over 30 yrs
- —
- Est. flood insurance / yr
- —
Fire risk No data
- Est. fire insurance / yr
- —
Heat risk No data
- Hot days now (above threshold)
- —
- Hot days in 30 yrs
- —
Wind risk No data
- Chance of severe wind over 30 yrs
- —
Air-quality risk No data
- Unhealthy air days now
- —
- Unhealthy air days in 30 yrs
- —
Risk factors via First Street. Map © Google.
Why this score? — see what drove the D+ grade
The composite is a weighted blend of 9 inputs, each scored 0–100. Each bar is that input's sub-score; the figure is the points it added to the 100-point composite (weight × sub-score).
- Cash flow +17.1/30.0
- ARV discount +7.5/15.0
- DSCR +5.3/10.0
- 1% rule +4.2/10.0
- Schools +3.6/10.0
- Rent growth +2.5/5.0
- Livability +2.5/5.0
- Condition / age +2.5/5.0
- Appreciation +0.0/10.0
$225,999
🖨 Deal sheet (PDF) 📄 Offer letter ✓ Due diligence
Listing remarks
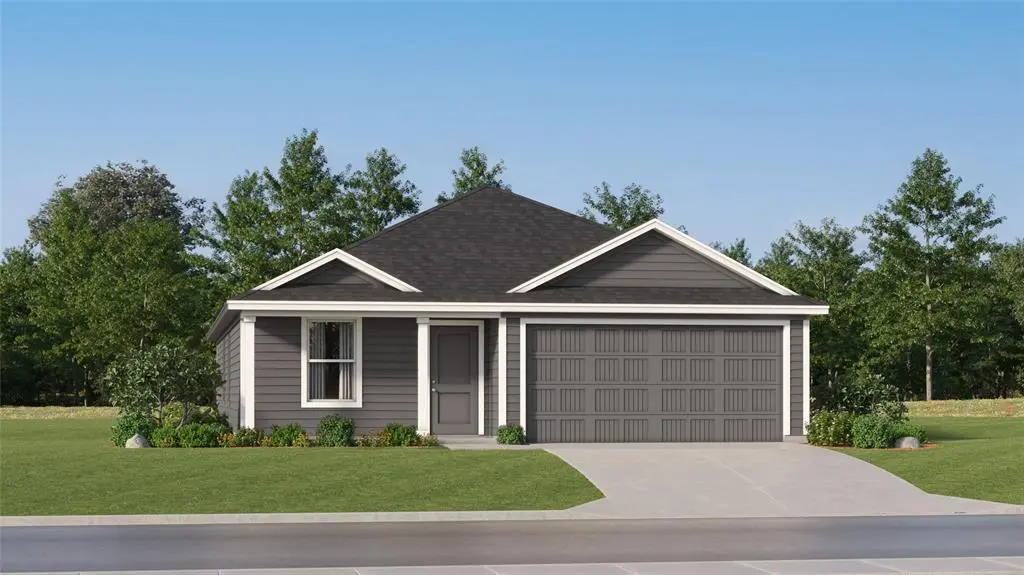
LENNAR - Eastland - Ramsey Floorplan - This single-level home showcases a spacious open floorplan shared between the kitchen, dining area and family room for easy entertaining. An owner’s suite enjoys a private location in a rear corner of the home, complemented by an en-suite bathroom and walk-in closet. There are three secondary bedrooms at the front of the home, which are comfortable spaces for household members and overnight guests. Prices, dimensions and features may vary and are subject to change. Photos are for illustrative purposes only.
Key facts
- Walk-in closet
- Open floorplan
- Secondary bedrooms
Tags
Property features AI
Finance
- Other: Property restrictions: Deed; MUD (Municipal Utility District) applies
- Financial info: Acceptable financing: Cash, Conventional, FHA, USDA loan, VA loan; Second mortgage: No
- HOA & community: Mandatory association; Annual association fee; Association fee covers full use of facilities, grounds maintenance, and management fees; HOA managed by SW Legacy
Exterior
- Parking: Attached 2-car garage (garage faces front, 2-car single door); 2 covered parking spaces; No carport spaces
- Security: Carbon monoxide detector(s); Fire alarm; Smoke detector(s)
- Utilities: MUD water and sewer; Concrete curbs and sidewalks; Municipal Utility District (MUD) service
- Home design: Single family residence; One story; Residential property; New construction (incomplete, 2025)
- Construction: Brick, rock/stone and siding exterior; Composition roof; Slab foundation; Year built: 2025 (new construction - incomplete)
- Exterior features: Covered porch(es); Wood fencing; Landscaped yard; Sprinkler system; Subdivision location
Interior
- Kitchen: Dishwasher; Disposal; Gas range; Microwave; Breakfast bar; Built-in cabinets; Natural stone/granite countertops; Walk-in pantry; Water line to refrigerator; Plumbed for gas in kitchen
- Bedrooms: 4 bedrooms (all on the main level)
- Flooring: Carpet; Luxury vinyl plank
- Bathrooms: 2 full bathrooms
- Heating & cooling: Central heating (Electric, Natural Gas); Central air conditioning (Electric); ENERGY STAR qualified HVAC and equipment
- Interior features: Built-in features; Cable TV available; Decorative lighting; High-speed internet available; Pantry; Walk-in closet(s)
- Laundry & utility: Plumbed for washer/dryer (utility connections implied by laundry/utility listing of appliances)
Neighborhood map
What this means for you Summary
Snapshot
- This is a 4-bed/2.0-bath land listed at $226k.
Deal economics
- At list price, monthly cash flow is $157 ($2k/yr) — positive.
- The deal already cash-flows at list — no discount required.
- To meet the 1% rule (rent ≥ 1% of price), the offer needs to be $207k (8.3% below list).
- Recommended offer: $207k (8.3% below list) — sets the bar for 1% rule.
- Cap rate 7.1% vs local median 4.6% in Heartland — top-decile yield for the area; either an underpriced asset or a hidden risk that comps aren't pricing in. Stress-test before assuming the spread holds.
Location & tenants
- Location reads: area grade D — affects rentability + tenant quality, not the cash-flow math above.
- Crandall ISD (rural): math 36% / reading 42% proficiency, ranked #351 of 826 in TX (top 42%) — families likely to look elsewhere, expect single-tenant / working-renter base with shorter leases.
- Zoned schools: W A Martin El (math 41% / reading 32%, grade F, #1,883 of 4,322 statewide, top 44%, 644 students, 71% FRL); Crandall Middle (math 38% / reading 42%, grade F, #646 of 1,662 statewide, top 40%, 983 students, 60% FRL); Crandall H S (math 33% / reading 53%, grade F, #713 of 1,632 statewide, top 44%, 1,707 students, 56% FRL) — zoned schools average 62% FRL vs 41% district-wide (21 pts higher); higher-poverty schools than district average — tighter screening recommended.
- Market conditions: 802 active listings in the ZIP; 40 comparable units currently listed for rent nearby; rentals at typical pace (median 27d on market — plan ~3-4 weeks tenant-placement turnaround); solid renter incomes; 1,747 units permitted in Kaufman County in 2024 (180 in 5+ unit buildings).
Forward outlook
- Local home prices are declining (-3.0%/yr); year-one equity from $2k of loan paydown is wiped out by about $7k of value loss. Plan a longer hold.
- Kaufman County population projected at +43% by 2050 — long-run rental-demand tailwind backs the buy-and-hold thesis.
Negotiation context
- It's been on market 17 days — a 2% lower offer ($223k) is reasonable based on typical stale-listing flexibility.
Questions for the listing agent
- What does the HOA fee cover, when was the last increase, and are there any pending special assessments or reserve-fund shortfalls?
- Is there a deadline driving the sale (1031 exchange, divorce, estate, relocation)? That informs how much negotiation room exists.
- The area grade is low — what's the realistic commute time and amenity access for the typical tenant pool here? Any planned neighborhood developments (good or bad) we should know about?
- What's the average days-on-market for RENTAL listings here right now (not sales)? A rising rental-DOM trend means longer vacancies and softer asking-rent achievability than the comps imply.
- What's the recent tenant-quality profile in this submarket — average credit score on applications, eviction rate, late-payment / NSF rate, and stable-employment percentage? A property-management company in the area should have these aggregated.
- How much new for-sale + rental construction is in the pipeline within 1–3 miles? Heavy new supply typically softens prices + rents 12–24 months out; constrained supply supports both.
Investment metrics
- 1% rule
- 0.92% ✗
- Cap rate
- 7.13%
- Cash-on-cash
- 2.98%
- DSCR
- 1.13
- GRM
- 9.1
CMA / ARV
No comps found within radius.
Projected returns pro-forma
-3.0% appreciation · 3.0% rent growth · sell at horizon
- IRR
- -11.6%
- Equity multiple
- 0.58×
- Total profit
- $-26,648
- Equity at exit
- $33,697
- IRR
- -2.4%
- Equity multiple
- 0.84×
- Total profit
- $-10,413
- Equity at exit
- $19,540
Cash invested: $63,280 (down + closing). Projections, not guarantees.
Landlord ↔ Tenant lean methodology
- Overall (STATE)
- 87 Strongly Landlord-Friendly
- State Texas
- 87 Strongly Landlord-Friendly · R+5
- County
- — inherits STATE
- City
- — inherits STATE
ZIP-level market 75114
- Home prices YoY
- -26.7%
- Active inventory
- 802
- Price-to-rent
- 9.1×
Monthly cashflow live
- Estimated rent
- $2,073 high interval (Pro) →
- Mortgage (P&I)
- −$1,185
- Tax from tax record
- −$160 /mo · $1,915/yr
- Insurance
- −$94
- HOA
- −$42
- Vacancy / Maint / Mgmt
- −$435
- Net cashflow
- $157
Break-even live
Sensitivity live
| Price | -10% $285 | -5% $221 | +0% $157 | +5% $93 | +10% $29 |
|---|---|---|---|---|---|
| Rent | -10% $-7 | -5% $75 | +0% $157 | +5% $239 | +10% $321 |
| Rate | -1.0pp $271 | -0.5pp $214 | base $157 | +0.5pp $98 | +1.0pp $39 |
UW: 25.0% down · 7.5% · 30yr · 1.5% tax · 5.0% vac · 8.0% maint · 8.0% mgmt
Financing live
Cash to close
- Down payment
- $56,500
- Closing costs
- $6,780
- Reserves months
- —
- Total cash needed
- —
Loan-product check · same deal, 3 products live
Conventional
25% down · 7.5% · 30yr
- Down + closing
- —
- Monthly P&I
- —
- Monthly cashflow
- —
- DSCR
- —
- Eligible?
- —
Personal DTI + credit; lowest rate.
DSCR
20% down · 8.5% · 30yr
- Down + closing
- —
- Monthly P&I
- —
- Monthly cashflow
- —
- DSCR
- —
- Eligible?
- —
No personal income docs; deal must DSCR.
Hard money
10% down · 12.0% · 12mo
- Down + closing
- —
- Monthly P&I
- —
- Monthly cashflow
- —
- DSCR
- —
- Eligible?
- —
Short-term bridge; refi at stabilization.
Rent comps 40 comps
| Address | Beds | Baths | Sqft | Rent | $/sqft | DOM | Units | Dist |
|---|---|---|---|---|---|---|---|---|
| 1799 Courage Crk Crandall, TX | 3.0 | 2.0 | 1260 | $1,800 | $1.43 | 45d | 1 | 0.19mi |
| 1793 Courage Crk Crandall, TX | 4.0 | 2.0 | 1667 | $1,769 | $1.06 | 1d | 1 | 0.21mi |
| 1789 Courage Crk Crandall, TX | 4.0 | 2.0 | 1667 | $1,739 | $1.04 | 5d | 1 | 0.22mi |
| 1507 Trick Riding Way Crandall, TX | 4.0 | 2.0 | 1850 | $1,900 | $1.03 | 1d | 1 | 0.24mi |
| 1507 Trick Riding Way Crandall, TX | 4.0 | 2.0 | 1850 | $1,900 | $1.03 | 26d | 1 | 0.24mi |
| 2511 Cornado Way Crandall, TX | 3.0 | 2.0 | 1239 | $1,799 | $1.45 | 26d | 1 | 0.25mi |
| 2311 Alcantara Ave Crandall, TX | 3.0 | 2.0 | 1220 | $1,740 | $1.43 | 1d | 1 | 0.26mi |
| 2294 Great Belt Blvd Crandall, TX | 3.0 | 2.0 | 1266 | $1,815 | $1.43 | 26d | 1 | 0.28mi |
| 2603 Khaju Grv Crandall, TX | 3.0 | 2.0 | 1266 | $1,699 | $1.34 | 5d | 1 | 0.28mi |
| 2504 Cornado Way Crandall, TX | 3.0 | 2.0 | 1440 | $1,799 | $1.25 | 45d | 1 | 0.29mi |
| 2302 Great Belt Blvd Crandall, TX | 3.0 | 2.0 | 1266 | $1,650 | $1.30 | 5d | 1 | 0.29mi |
| 2908 Hearts Trl Crandall, TX | 3.0 | 3.0 | 1266 | $1,750 | $1.38 | 45d | 1 | 0.30mi |
| 2306 Great Belt Blvd Crandall, TX | 3.0 | 2.0 | 1266 | $1,695 | $1.34 | 45d | 1 | 0.30mi |
| 2510 Flight Trl Crandall, TX | 4.0 | 2.0 | 1667 | $1,845 | $1.11 | 26d | 1 | 0.30mi |
| 2513 Flight Trl Crandall, TX | 4.0 | 2.0 | 1707 | $1,825 | $1.07 | 26d | 1 | 0.32mi |
| 2521 Flight Trl Crandall, TX | 4.0 | 2.0 | 1707 | $1,825 | $1.07 | 26d | 1 | 0.36mi |
| 2624 Bartlett St Crandall, TX | 4.0 | 2.0 | 1707 | $1,825 | $1.07 | 26d | 1 | 0.36mi |
| 2409 Fleming Dr Crandall, TX | 4.0 | 2.0 | 1667 | $1,845 | $1.11 | 26d | 1 | 0.37mi |
| 2739 Bronte Blvd Crandall, TX | 4.0 | 2.0 | 1707 | $1,825 | $1.07 | 26d | 1 | 0.37mi |
| 1930 Wild Orchard Ln Crandall, TX | 3.0 | 2.0 | 1411 | $1,865 | $1.32 | 45d | 1 | 0.38mi |
| 2746 Bronte Blvd Crandall, TX | 4.0 | 2.0 | 1707 | $1,825 | $1.07 | 26d | 1 | 0.39mi |
| 2745 Bronte Blvd Crandall, TX | 4.0 | 2.0 | 1667 | $1,845 | $1.11 | 26d | 1 | 0.40mi |
| 2237 Mustang Ghost Trl Crandall, TX | 3.0 | 2.0 | 1952 | $2,040 | $1.05 | 45d | 1 | 0.40mi |
| 3315 Beckwith Way Crandall, TX | 3.0 | 2.0 | 1440 | $1,685 | $1.17 | 45d | 1 | 0.52mi |
| 1209 Kings Pl Crandall, TX | 3.0 | 2.0 | 1356 | $1,975 | $1.46 | 3d | 1 | 0.57mi |
| 3007 Wallace Wells Ct Crandall, TX | 3.0 | 2.0 | 1440 | $1,950 | $1.35 | 45d | 1 | 0.58mi |
| 2826 Hudson Dr Crandall, TX | 3.0 | 2.0 | 1639 | $2,400 | $1.46 | 8d | 1 | 0.63mi |
| 2991 Wallace Wells Ct Crandall, TX | 3.0 | 2.0 | 1266 | $1,895 | $1.50 | 45d | 1 | 0.64mi |
| 3352 Beckwith Way Crandall, TX | 3.0 | 2.0 | 1266 | $1,750 | $1.38 | 1d | 1 | 0.64mi |
| 1609 Duke Dr Crandall, TX | 2.0–4.0 | 2.0–2.5 | 1614 | $2,490 | $1.54 | 0d | 1 | 0.65mi |
| 3121 Helix Bay Dr Crandall, TX | 3.0 | 2.0 | 1440 | $1,675 | $1.16 | 45d | 1 | 0.66mi |
| 2973 Wallace Wells Ct Crandall, TX | 3.0 | 2.0 | 1440 | $1,665 | $1.16 | 45d | 1 | 0.68mi |
| 3103 Helix Bay Dr Crandall, TX | 3.0 | 2.0 | 1440 | $1,729 | $1.20 | 5d | 1 | 0.69mi |
| 3101 Helix Bay Dr Crandall, TX | 3.0 | 2.0 | 1266 | $1,745 | $1.38 | 26d | 1 | 0.70mi |
| 2961 Wallace Wells Ct Crandall, TX | 3.0 | 2.0 | 1266 | $1,855 | $1.47 | 4d | 1 | 0.72mi |
| 3104 Helix Bay Dr Crandall, TX | 3.0 | 2.0 | 1266 | $1,675 | $1.32 | 26d | 1 | 0.72mi |
| 2960 Wallace Wells Ct Crandall, TX | 3.0 | 2.0 | 1440 | $2,000 | $1.39 | 45d | 1 | 0.73mi |
| 3147 Blossom Trl Crandall, TX | 4.0 | 3.0 | 2177 | $2,700 | $1.24 | 45d | 1 | 0.79mi |
| 4001 Fairmont Ln Forney, TX | 4.0 | 2.0 | 1545 | $2,000 | $1.29 | 45d | 1 | 0.81mi |
| 3004 Dakota Trl Crandall, TX | 4.0 | 2.0 | 1938 | $2,300 | $1.19 | 6d | 1 | 0.84mi |
HOA detail
- Monthly dues
- $42 · $504/yr
Listing history 11 events
-
2026-06-08statusdays on market $225,999 Pending 17 DOM
-
2026-06-07days on market $225,999 Active 16 DOM
-
2026-06-04days on market $225,999 Active 13 DOM
-
2026-06-03days on market $225,999 Active 12 DOM
-
2026-06-02days on market $225,999 Active 11 DOM
-
2026-06-02price $225,999 Active 10 DOM
-
2026-06-01days on market $226,999 Active 10 DOM
-
2026-05-31days on market $226,999 Active 9 DOM
-
2026-05-22$226,999 Active
-
2026-05-20price $226,999 414-char remark
-
2026-05-19$246,999 Active 414-char remark
ⓘ Source: listings_history table (triggers on properties + properties_extension) + one-shot
backfill from property_details.listing_events for pre-trigger history.
Tax reassessment forecast TX · Resets to sale price
- Current annual tax
- $1,915 · $160/mo
- Projected year-2 tax
- $4,136 · $345/mo
- Expected delta
- +$2,221/yr (+$185/mo · 116.0%)
ⓘ Screening estimate from a state-policy table — verify with the county assessor before closing.
Nearby sold comps map
Loading sold comps map…
Walkable amenities ~0.75 mi
Loading nearby amenities…
Taxation est. · year 1
- Rental income
- $24,878
- − Mortgage interest
- −$12,659
- − Property taxes
- −$1,915
- − Insurance
- −$1,130
- − Repairs & maintenance
- −$1,990
- − Management
- −$1,990
- − HOA
- −$504
- − Depreciation
- −$6,575
- Taxable loss
- −$1,885
- Est. tax savings @ 24.0%
- +$453
- After-tax cash flow
- $2,335/yr
For passive investors: Depreciation is non-cash, so a rental often shows a tax loss while cash-flowing — sheltering income. Rental losses are passive: they offset passive income freely, and up to $25,000/yr can offset ordinary (W-2) income if you actively participate and your MAGI is under $100k (phasing out to $0 by $150k); unused losses carry forward. On sale, claimed depreciation is recaptured at up to 25%, and gains may owe capital-gains tax (a 1031 exchange can defer both). Figures are a year-1 estimate at your 24.0% rate — not tax advice; consult a CPA.
Schools (NCES district)
- District
- Crandall ISD
- NCES district ID
- 4815510
- Math proficiency
- 36% ▼ -13.00%
- Reading proficiency
- 42% ▼ -8.00%
- Median HH income
- $70,076
- Composite
- 35.57/100
- National rank
- #4901
- State rank
- #351 of 826 in TX
Livability — Heartland
No livability data for this city. (Only ~50 U.S. cities are tracked.)
Census & demographics
- Census place
- Heartland, TX
- County
- Kaufman County · 122,338 people
- Metro
- Dallas-Fort Worth-Arlington, TX
- Population (ZIP)
- 9,333
- Household income
- $88,013
- Rent vs Own
- Severe rent burden
- 33.0
Population outlook (Kaufman County) Hauer SSP2
- Today (2025)
- 138,716 people
- By 2030
- 150,815 · +8.7%
- By 2040
- 174,877 · +26.1%
- By 2050
- 198,020 · +42.8%
- By 2075
- 251,908 · +81.6%
- By 2100
- 285,325 · +105.7%
Race, ethnicity, and origin ACS 2023
- Neighborhood character
- Diverse neighborhood (Simpson 0.62)
- Race & ethnicity
- White 48% Hispanic / Latino 36% Two or more races 14% Black 14%
- Hispanic origin (detail)
- Mexican 34%
- Common ancestry
- Slovak 1%
- Foreign-born
- 18% · Canada, China
- Languages at home
- 71% English-only · Spanish 27% Other Indo-European 1%
Political lean MEDSL · Kaufman
- 2024 margin
- Strong R (+27.9) · D 35.6% · R 63.5%
- 2008→2024 swing
- +7.9pp toward D · 2008: -35.8pp · 2024: -27.9pp
- All cycles
- 2024: R+27.9 2020: R+33.9 2016: R+47.0 2012: R+44.4 2008: R+35.8
Not yet ingested
- Civics
- —
Market trends
- HPI YoY
- ▼ -71.61%
- Current HPI
- 196.4773
- Rent YoY
- —
- Metro
- Dallas-Fort Worth-Arlington, TX
- State GDP YoY
- ▲ 3.95%
- F500 in state
- 110
Industry mix (Fortune 500 HQ in TX)
| Industry | F500 HQs | Revenue |
|---|---|---|
| Energy | 16 | $1,198B |
|
||
| Technology | 5 | $198B |
|
||
| Engineering / Construction | 4 | $72B |
|
||
| Energy Services | 3 | $60B |
|
||
| Utilities | 3 | $41B |
|
||
| Healthcare | 2 | $330B |
|
||
Price history
-0.4% since first listed3 events — show timeline
- 2026-06-08 Pending — NTREIS
- 2026-06-01 Price Changed $225,999 NTREIS
- 2026-05-22 Listed $226,999 NTREIS
Property tax history
-5.8%/yrLatest (2025): $1,915 · -5.8% YoY. Source: county tax records.
Cash-flow waterfall
monthlySold comps — $/sqft
last 12 mo · ≤1 miLoading sold comps…