 Multi-family
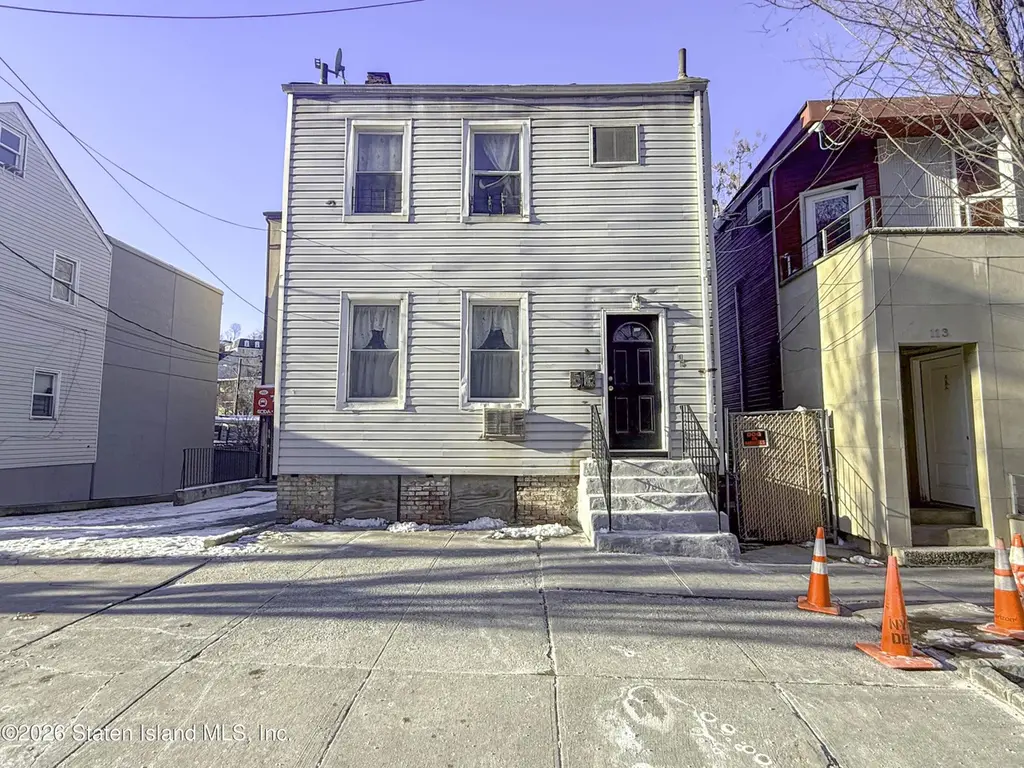
115 Victory Blvd · New York, NY
Flood risk 7/10 · Major
- FEMA flood zone
- X (unshaded)
- Chance of flooding over 30 yrs
- 0.99%
- Est. flood insurance / yr
- $507 – $1,088
Fire risk 1/10 · Minimal
- Est. fire insurance / yr
- $691 – $1,283
Heat risk 7/10 · Major
- Hot days now (above 98°F)
- 7 days/yr
- Hot days in 30 yrs
- 16 days/yr
Wind risk 6/10 · Moderate
- Chance of severe wind over 30 yrs
- 54.0%
Air-quality risk 4/10 · Minor
- Unhealthy air days now
- 5 days/yr
- Unhealthy air days in 30 yrs
- 7 days/yr
Risk factors via First Street. Map © Google.
Why this score? — see what drove the D+ grade
The composite is a weighted blend of 9 inputs, each scored 0–100. Each bar is that input's sub-score; the figure is the points it added to the 100-point composite (weight × sub-score).
- Cash flow +21.0/30.0
- DSCR +6.7/10.0
- Schools +5.0/10.0
- 1% rule +4.7/10.0
- Rent growth +4.0/5.0
- Livability +3.8/5.0
- Condition / age +2.5/5.0
- ARV discount +1.5/15.0
- Appreciation +0.0/10.0
$565,000
🖨 Deal sheet (PDF) 📄 Offer letter ✓ Due diligence
Multi-family units
County records classify this as Multi-Family (2-4 Unit). Listing-text estimate: 1 unit. estimate disagrees with records
Listing remarks
SUPER INVESTMENT, 5/5,CLOSE TO FERRY, . Level 1 & Basement: 2BDRM APT Level 2: 2BDRM APT + FINISHED ATTIC.
Key facts
- Finished attic
- Level 1 & basement
- Close to ferry
Tags
Property features AI
Finance
- Other: Annual tax listed (financial detail omitted per instructions)
- Financial info: Two units total; Unit 1 current rent: $1,100/month
Exterior
- Parking: On-street parking (no attached garage)
- Utilities: 220-volt electrical service
- Home design: 2-story building; Vinyl siding exterior; Condition listed as fair
- Construction: Vinyl siding construction; Year built: approximate
- Exterior features: On-street parking; Lot approximately 0.06 acres (approx. 25 x 98); Zoned R5
Interior
- Bedrooms: Unit 1: 3 bedrooms; Unit 2: 3 bedrooms
- Bathrooms: 2 full bathrooms; 2 three-quarter bathrooms (4 total bathrooms)
- Heating & cooling: Natural gas forced air heating
- Interior features: Finished basement; Two-unit multi-family building
Neighborhood map
What this means for you Summary
Snapshot
- This is a 5-bed/4.0-bath multifamily listed at $565k.
Deal economics
- At list price, monthly cash flow is $732 ($9k/yr) — positive.
- The deal already cash-flows at list — no discount required.
- To meet the 1% rule (rent ≥ 1% of price), the offer needs to be $551k (2.5% below list).
- Recommended offer: $551k (2.5% below list) — sets the bar for 1% rule.
- Cap rate 8.0% vs local median 2.6% in New York — top-decile yield for the area; either an underpriced asset or a hidden risk that comps aren't pricing in. Stress-test before assuming the spread holds.
Location & tenants
- Location reads 75/100 on livability (#268 in NY, #4,188 nationally) — a middle-class / working-renter tenant base. Strengths: amenities A+, commute A+, health & safety A; Watch: crime F, cost of living F.
- Zoned schools: Elm Tree Elementary School (math 27% / reading 52%, grade F, #1,444 of 2,108 statewide, top 71%, 806 students, 94% FRL); Is 61 William A Morris (math 22% / reading 57%, grade F, #418 of 729 statewide, top 59%, 932 students, 84% FRL); Midwood High School (math 94% / reading 96%, grade A+, #83 of 1,100 statewide, top 8%, 4,062 students, 73% FRL).
- Market conditions: Rents rising fast (+6.1%/yr); 265 active listings in the ZIP; solid renter incomes; 480 units permitted in Richmond County in 2024 (22 in 5+ unit buildings).
- At $5,508/mo this rent would consume 77% of the median local household income ($86k/yr) (locally 2008% of renters already pay >50% of income on rent) — very limited rent-growth headroom before tenants either downsize or default.
Forward outlook
- Local home prices are declining (-3.0%/yr); year-one equity from $4k of loan paydown is wiped out by about $17k of value loss. Plan a longer hold.
- Richmond County population projected to shrink 5% by 2050 — rents likely to lag national; underwrite the cash flow, not the appreciation.
Negotiation context
- It's been on market 26 days — a 2% lower offer ($557k) is reasonable based on typical stale-listing flexibility.
- 4 sale attempts since 25y ago with the ask held roughly flat each time — persistent listings suggest the price (not the market) is what's stuck; bring a comps-based counter.
- Current owner paid $230k; list at $565k implies a 146% gain — meaningful room to come down on a strong offer.
Risks & watch-outs
- Watch-outs: flood insurance adds $66/mo; built in 1915 — expect roof / HVAC / electrical / plumbing capex.
- Climate carrying-cost: major flood risk; major wind risk, 54% chance of damaging wind over 30y; extreme-heat days projected 7→16/yr by 2055 (HVAC capex compounding) — expect insurance premiums to compound above CPI over the hold.
Questions for the listing agent
- Built in 1915 — when were the roof, HVAC, electrical panel, plumbing, and water heater last replaced?
- What's the actual annual flood-insurance premium (NFIP or private), and is the property in a SFHA with mandatory coverage?
- Is there a deadline driving the sale (1031 exchange, divorce, estate, relocation)? That informs how much negotiation room exists.
- Schools are B-rated — typically a magnet for longer-tenancy family renters. What's the average tenant stay here, and is there a school-zone premium baked into asking?
- Crime grade is F in this area — have there been break-ins, vandalism, or insurance claims at this property in the last 3 years? What carrier currently insures it and at what premium?
- The area grade is low — what's the realistic commute time and amenity access for the typical tenant pool here? Any planned neighborhood developments (good or bad) we should know about?
- What's the average days-on-market for RENTAL listings here right now (not sales)? A rising rental-DOM trend means longer vacancies and softer asking-rent achievability than the comps imply.
- What's the recent tenant-quality profile in this submarket — average credit score on applications, eviction rate, late-payment / NSF rate, and stable-employment percentage? A property-management company in the area should have these aggregated.
- How much new apartment / multifamily construction is in the pipeline within 1–3 miles? Heavy new supply (>2% of stock underway) typically softens rents 12–24 months out; light construction supports rent growth.
Investment metrics
- 1% rule
- 0.97% ✗
- Cap rate
- 7.99%
- Cash-on-cash
- 6.06%
- DSCR
- 1.27
- GRM
- 8.5
CMA / ARV
- ARV (on-the-fly)
- $498,960
- Comps found
- 1
Show comp detail 1 sale within ~0.75 mi
| Address | Dist | Beds/Ba | Sqft | Sold | Price | $/sf | Match |
|---|---|---|---|---|---|---|---|
| 245 Westervelt Ave | 0.34mi | 5/2.0 | 1,314 (+4%) | 3mo | $520,000 | $396 | 66 |
Match score weights: distance 35% · size 25% · config 20% · recency 20%. Top-matched comps best support the ARV.
Projected returns pro-forma
-3.0% appreciation · 6.07% rent growth · sell at horizon
- IRR
- -4.5%
- Equity multiple
- 0.83×
- Total profit
- $-27,475
- Equity at exit
- $84,243
- IRR
- 8.3%
- Equity multiple
- 1.71×
- Total profit
- $112,398
- Equity at exit
- $48,851
Cash invested: $158,200 (down + closing). Projections, not guarantees.
Landlord ↔ Tenant lean methodology
- Overall (CITY)
- 0 Strongly Tenant-Friendly
- State New York
- 15 Strongly Tenant-Friendly · D+10
- County
- — inherits STATE
- City New York
- 0 Strongly Tenant-Friendly · D+34
ZIP-level market 10301
- Rents YoY
- 6.1%
- Active inventory
- 265
- Price-to-rent
- 17.1×
Monthly cashflow live
- Estimated rent
- $5,508 medium interval (Pro) →
- Mortgage (P&I)
- −$2,963
- Tax from tax record
- −$354 /mo · $4,252/yr
- Insurance
- −$235
- Flood insurance flood zone
- −$66 /mo · $798/yr
- HOA
- −$0
- Vacancy / Maint / Mgmt
- −$1,157
- Net cashflow
- $732
Break-even live
Sensitivity live
| Price | -10% $1,052 | -5% $892 | +0% $732 | +5% $572 | +10% $412 |
|---|---|---|---|---|---|
| Rent | -10% $297 | -5% $515 | +0% $732 | +5% $950 | +10% $1,167 |
| Rate | -1.0pp $1,017 | -0.5pp $876 | base $732 | +0.5pp $586 | +1.0pp $437 |
2-unit breakdown (identical units grouped — click to expand)
| Units | Beds | Baths | Est. rent |
|---|---|---|---|
| 2× units | 2 | 1 | $5,508 |
| #1 | 2 | 1 | $2,754 |
| #2 | 2 | 1 | $2,754 |
| Total (2 units) | $5,508 | ||
UW: 25.0% down · 7.5% · 30yr · 1.5% tax · 5.0% vac · 8.0% maint · 8.0% mgmt
Financing live
Cash to close
- Down payment
- $141,250
- Closing costs
- $16,950
- Reserves months
- —
- Total cash needed
- —
Loan-product check · same deal, 3 products live
Conventional
25% down · 7.5% · 30yr
- Down + closing
- —
- Monthly P&I
- —
- Monthly cashflow
- —
- DSCR
- —
- Eligible?
- —
Personal DTI + credit; lowest rate.
DSCR
20% down · 8.5% · 30yr
- Down + closing
- —
- Monthly P&I
- —
- Monthly cashflow
- —
- DSCR
- —
- Eligible?
- —
No personal income docs; deal must DSCR.
Hard money
10% down · 12.0% · 12mo
- Down + closing
- —
- Monthly P&I
- —
- Monthly cashflow
- —
- DSCR
- —
- Eligible?
- —
Short-term bridge; refi at stabilization.
Listing history 25 events
-
2026-06-21pricedays on market $565,000 Active 26 DOM
-
2026-06-18days on market $590,000 Active 23 DOM
-
2026-06-17days on market $590,000 Active 22 DOM
-
2026-06-16days on market $590,000 Active 21 DOM
-
2026-06-15days on market $590,000 Active 20 DOM
-
2026-06-13days on market $590,000 Active 18 DOM
-
2026-06-10days on market $590,000 Active 14 DOM
-
2026-06-08days on market $590,000 Active 13 DOM
-
2026-06-08days on market $590,000 Active 12 DOM
-
2026-06-04days on market $590,000 Active 9 DOM
-
2026-06-03days on market $590,000 Active 8 DOM
-
2026-06-02days on market $590,000 Active 7 DOM
-
2026-06-01days on market $590,000 Active 6 DOM
-
2026-05-31days on market $590,000 Active 5 DOM
-
2026-05-26$590,000 Active
-
2026-05-22historical
-
2026-02-18price $590,000
-
2026-02-17$590,000 Active
-
2016-02-17historical
-
2008-01-02soldstatus $230,000
-
2004-07-13$349,900
-
2002-07-16soldstatus $173,500
-
2002-05-17soldstatus $173,310
-
2001-11-28$189,900
-
1996-01-16soldstatus $45,000
ⓘ Source: listings_history table (triggers on properties + properties_extension) + one-shot
backfill from property_details.listing_events for pre-trigger history.
Tax reassessment forecast NY · Partial reset (capped growth)
- Current annual tax
- $4,252 · $354/mo
- Projected year-2 tax
- $6,900 · $575/mo
- Expected delta
- +$2,648/yr (+$221/mo · 62.3%)
ⓘ Screening estimate from a state-policy table — verify with the county assessor before closing.
Climate risk First Street
- Flood 7/10 Severe FEMA zone X (unshaded) · 99% chance over 30 yrs
- Wildfire 1/10 Low
- Heat 7/10 Severe 7 d/yr ≥98°F today · 16 d/yr by 30 yrs out
- Wind 6/10 Major 54% chance of damaging wind over 30 yrs
- Air quality 4/10 Moderate 5 unhealthy d/yr today · 7 by 30 yrs out
Nearby sold comps map
Loading sold comps map…
Walkable amenities ~0.75 mi
Loading nearby amenities…
Taxation est. · year 1
- Rental income
- $66,096
- − Mortgage interest
- −$31,649
- − Property taxes
- −$4,252
- − Insurance
- −$3,622
- − Repairs & maintenance
- −$5,288
- − Management
- −$5,288
- − Depreciation
- −$16,436
- Taxable loss
- −$439
- Est. tax savings @ 24.0%
- +$105
- After-tax cash flow
- $8,892/yr
For passive investors: Depreciation is non-cash, so a rental often shows a tax loss while cash-flowing — sheltering income. Rental losses are passive: they offset passive income freely, and up to $25,000/yr can offset ordinary (W-2) income if you actively participate and your MAGI is under $100k (phasing out to $0 by $150k); unused losses carry forward. On sale, claimed depreciation is recaptured at up to 25%, and gains may owe capital-gains tax (a 1031 exchange can defer both). Figures are a year-1 estimate at your 24.0% rate — not tax advice; consult a CPA.
Schools (NCES district)
No district data.
Livability — New York
- Score
- 75/100
- State rank
- #268
- US rank
- #4188
Category grades
Schools grade is shown separately in the Schools card above.
Census & demographics
- Census place
- New York, NY
- County
- Richmond County · 404,174 people
- City population
- 7,731,280
- Metro
- New York-Newark-Jersey City, NY-NJ-PA
- Population (ZIP)
- 41,052
- Household income
- $85,609
- Rent vs Own
- Severe rent burden
- 2008.0
Population outlook (Richmond County) Hauer SSP2
- Today (2025)
- 482,784 people
- By 2030
- 481,831 · -0.2%
- By 2040
- 473,159 · -2.0%
- By 2050
- 457,242 · -5.3%
- By 2075
- 408,029 · -15.5%
- By 2100
- 341,459 · -29.3%
Race, ethnicity, and origin ACS 2023
- Neighborhood character
- Highly diverse neighborhood (Simpson 0.72)
- Race & ethnicity
- White 37% Hispanic / Latino 29% Black 23% Two or more races 16% Asian 7%
- Hispanic origin (detail)
- Mexican 5% Puerto Rican 10% Cuban 2% Dominican 6%
- Common ancestry
- Romanian 3% Scotch-Irish 2% Italian 1%
- Foreign-born
- 22% · Canada, China, Jamaica
- Languages at home
- 68% English-only · Spanish 16% Other Indo-European 5% Russian/Polish/Slavic 3%
Political lean MEDSL · Richmond
- 2024 margin
- Strong R (+29.8) · D 35.1% · R 64.9%
- 2008→2024 swing
- -25.7pp toward R · 2008: -4.0pp · 2024: -29.8pp
- All cycles
- 2024: R+29.8 2020: R+14.9 2016: R+16.8 2012: D+0.8 2008: R+4.0
Not yet ingested
- Civics
- —
Market trends
- HPI YoY
- ▼ -407.37%
- Current HPI
- 319.0616
- Rent YoY
- ▲ 6.07%
- Metro
- New York-Newark-Jersey City, NY-NJ-PA
- State GDP YoY
- ▲ 2.60%
- F500 in state
- 92
Industry mix (Fortune 500 HQ in NY)
| Industry | F500 HQs | Revenue |
|---|---|---|
| Financial Services | 10 | $950B |
|
||
| Consumer Goods | 9 | $162B |
|
||
| Insurance | 4 | $225B |
|
||
| Telecommunications | 2 | $144B |
|
||
| Pharmaceuticals | 2 | $112B |
|
||
| Media / Entertainment | 2 | $69B |
|
||
Price history
+1211.1% since first listed11 events — show timeline
- 2026-05-26 Listed $590,000 SIBORMLS
- 2026-05-22 Listing Removed — SIBORMLS
- 2026-02-18 Price Changed $590,000 BNYMLS
- 2026-02-17 Listed $590,000 SIBORMLS
- 2016-02-17 Listing Removed — SIBORMLS
- 2008-01-02 Sold (Public Records) $230,000 Public Records
- 2004-07-13 Listed $349,900 SIBORMLS
- 2002-07-16 Sold (Public Records) $173,500 Public Records
- 2002-05-17 Sold (MLS) $173,310 SIBORMLS
- 2001-11-28 Listed $189,900 SIBORMLS
- 1996-01-16 Sold (Public Records) $45,000 Public Records
Property tax history
+4.7%/yrLatest (2025): $4,252 · +2.6% YoY. Source: county tax records.
Cash-flow waterfall
monthlySold comps — $/sqft
last 12 mo · ≤1 miLoading sold comps…