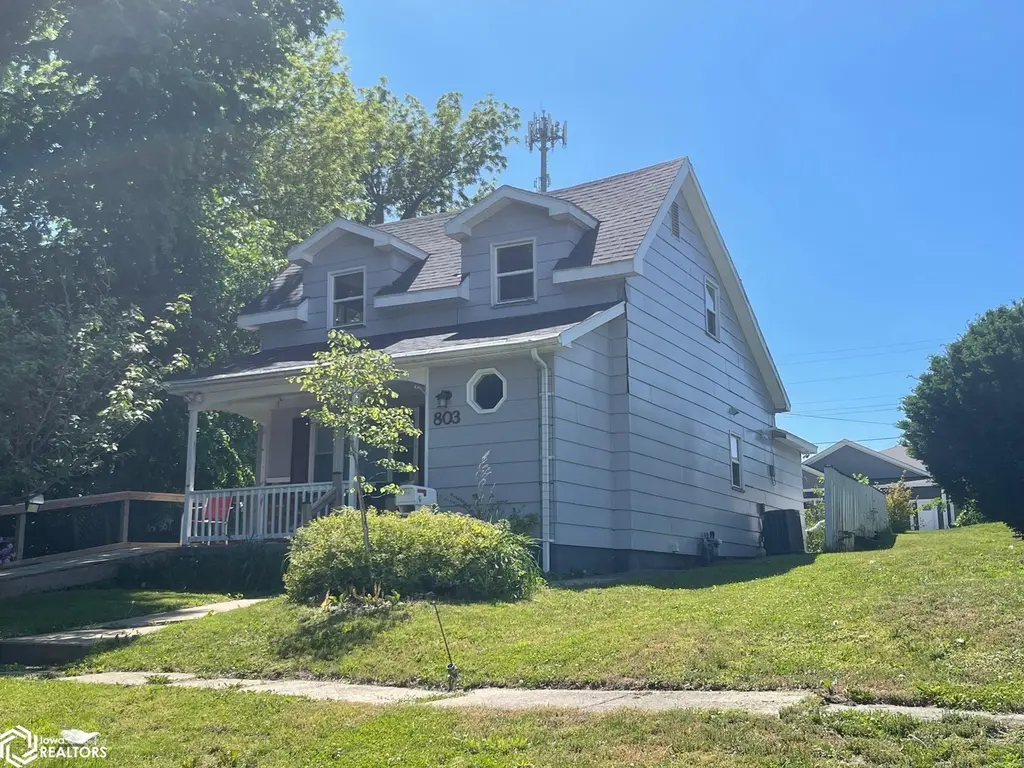
803 Center St · Grinnell, IA
Flood risk 1/10 · Minimal
- FEMA flood zone
- X (unshaded)
- Chance of flooding over 30 yrs
- 0.0%
- Est. flood insurance / yr
- $507 – $1,088
Fire risk 5/10 · Moderate
- Est. fire insurance / yr
- $902 – $1,676
Heat risk 3/10 · Minor
- Hot days now (above 102°F)
- 7 days/yr
- Hot days in 30 yrs
- 15 days/yr
Wind risk 2/10 · Minimal
- Chance of severe wind over 30 yrs
- —
Air-quality risk 2/10 · Minimal
- Unhealthy air days now
- 1 days/yr
- Unhealthy air days in 30 yrs
- 1 days/yr
Risk factors via First Street. Map © Google.
Why this score? — see what drove the B grade
The composite is a weighted blend of 9 inputs, each scored 0–100. Each bar is that input's sub-score; the figure is the points it added to the 100-point composite (weight × sub-score).
- Cash flow +25.2/30.0
- ARV discount +15.0/15.0
- DSCR +8.3/10.0
- 1% rule +7.1/10.0
- Schools +6.6/10.0
- Livability +4.0/5.0
- Rent growth +2.5/5.0
- Condition / age +2.5/5.0
- Appreciation +0.0/10.0
$80,000
🖨 Deal sheet 📄 Offer letter ✓ Due diligence
Listing remarks
2 bedroom, 1 bath 1 1/2 story home on quiet cul-du-sac. The first floor features a living room, dining room, kitchen and full bath with 2 bedrooms upstairs. All hail damage has been done. Newer windows. Big Backyard
Key facts
- 0.39 acre lot
- Built 1900
Property features AI
Exterior
- Parking: Gravel parking
- Utilities: Public water; Public sewer
- Home design: Single-family residence; One and one-half story
- Construction: Built with HardiPlank type exterior
- Exterior features: HardiPlank type siding; Lot approximately 0.39 acres (95 x 130)
Interior
- Bathrooms: 1 full bathroom
- Interior features: Central air conditioning; Forced air heating
Neighborhood map
What this means for you Summary
Snapshot
- This is a 2-bed/1.0-bath single-family listed at $80k.
Deal economics
- At list price, monthly cash flow is $180 ($2k/yr) — positive.
- The deal already cash-flows at list — no discount required.
- Meets the 1% rule at list price ($969 rent vs $80k).
- Cap rate 9.0% vs local median 2.9% in Grinnell — top-decile yield for the area; either an underpriced asset or a hidden risk that comps aren't pricing in. Stress-test before assuming the spread holds.
Location & tenants
- Location reads 79/100 on livability (#123 in IA, #2,270 nationally) — a middle-class / working-renter tenant base. Strengths: schools A+, cost of living A+, housing A+; Watch: employment D, amenities F, commute F.
- Grinnell-Newburg Community School District (town): math 76% / reading 79% proficiency, ranked #47 of 289 in IA (top 16%) — strong family-tenant draw, lease renewals of 3-5y typical.
- Market conditions: 98 active listings in the ZIP; 6 comparable units currently listed for rent nearby; rentals at typical pace (median 23d on market — plan ~3-4 weeks tenant-placement turnaround); 27 units permitted in Poweshiek County in 2024 (0 in 5+ unit buildings).
Forward outlook
- Local home prices are declining (-3.0%/yr); year-one equity from $553 of loan paydown is wiped out by about $2k of value loss. Plan a longer hold.
- Poweshiek County population projected to shrink 3% by 2050 — rents likely to lag national; underwrite the cash flow, not the appreciation.
Negotiation context
- Only 1 days on market — expect competitive offers; lowballing is unlikely to land.
Risks & watch-outs
- Watch-outs: built in 1900 — expect roof / HVAC / electrical / plumbing capex.
- Climate carrying-cost: moderate wildfire risk — expect insurance premiums to compound above CPI over the hold.
Questions for the listing agent
- Built in 1900 — when were the roof, HVAC, electrical panel, plumbing, and water heater last replaced?
- Is there a deadline driving the sale (1031 exchange, divorce, estate, relocation)? That informs how much negotiation room exists.
- Schools are A-rated — typically a magnet for longer-tenancy family renters. What's the average tenant stay here, and is there a school-zone premium baked into asking?
- What's the average days-on-market for RENTAL listings here right now (not sales)? A rising rental-DOM trend means longer vacancies and softer asking-rent achievability than the comps imply.
- What's the recent tenant-quality profile in this submarket — average credit score on applications, eviction rate, late-payment / NSF rate, and stable-employment percentage? A property-management company in the area should have these aggregated.
- How much new for-sale + rental construction is in the pipeline within 1–3 miles? Heavy new supply typically softens prices + rents 12–24 months out; constrained supply supports both.
Investment metrics
- 1% rule
- 1.21% ✓
- Cap rate
- 9.00%
- Cash-on-cash
- 9.65%
- DSCR
- 1.43
- GRM
- 6.9
CMA / ARV
- ARV (on-the-fly)
- $156,354
- Comps found
- 12
Show comp detail 12 sales within ~0.75 mi
| Address | Dist | Beds/Ba | Sqft | Sold | Price | $/sf | Match |
|---|---|---|---|---|---|---|---|
| 320 1st Ave | 0.23mi | 3/2.0 (+1) | 1,166 (+3%) | 10mo | $203,000 | $174 | 67 |
| 433 Main St | 0.46mi | 1/1.0 (-1) | 1,094 (-3%) | 2mo | $80,000 | $73 | 66 |
| 1209 Spencer St | 0.42mi | 2/1.0 | 1,046 (-8%) | 4mo | $105,000 | $100 | 64 |
| 616 Harrison Ave | 0.58mi | 2/1.5 | 1,184 (+4%) | 2mo | $235,000 | $198 | 62 |
| 411 1st Ave | 0.21mi | 3/1.0 (+1) | 1,266 (+12%) | 6mo | $142,000 | $112 | 61 |
| 510 Spring St | 0.34mi | 2/1.0 | 1,275 (+12%) | 9mo | $149,000 | $117 | 56 |
| 416 Broad St | 0.57mi | 3/1.5 (+1) | 1,058 (-7%) | 10mo | $146,000 | $138 | 47 |
| 539 10th Ave | 0.73mi | 3/1.5 (+1) | 1,180 (+4%) | 9mo | $229,000 | $194 | 45 |
| 1429 Prince St | 0.71mi | 2/1.5 | 992 (-12%) | 6mo | $105,000 | $106 | 39 |
| 1220 Main St | 0.56mi | 3/1.5 (+1) | 987 (-13%) | 9mo | $149,000 | $151 | 38 |
| 128 Main St | 0.73mi | 3/1.0 (+1) | 984 (-13%) | 6mo | $145,000 | $147 | 34 |
| 720 High St | 0.68mi | 3/3.0 (+1) | 1,264 (+12%) | 10mo | $139,000 | $110 | 28 |
Match score weights: distance 35% · size 25% · config 20% · recency 20%. Top-matched comps best support the ARV.
Projected returns pro-forma
-3.0% appreciation · 3.0% rent growth · sell at horizon
- IRR
- -1.7%
- Equity multiple
- 0.94×
- Total profit
- $-1,455
- Equity at exit
- $11,928
- IRR
- 8.0%
- Equity multiple
- 1.61×
- Total profit
- $13,647
- Equity at exit
- $6,917
Cash invested: $22,400 (down + closing). Projections, not guarantees.
Landlord ↔ Tenant lean methodology
- Overall (STATE)
- 83 Strongly Landlord-Friendly
- State Iowa
- 83 Strongly Landlord-Friendly · R+6
- County
- — inherits STATE
- City
- — inherits STATE
ZIP-level market 50112
- Home prices YoY
- -14.4%
- Active inventory
- 98
- Price-to-rent
- 6.9×
Monthly cashflow live
- Estimated rent
- $969 high interval (Pro) →
- Mortgage (P&I)
- −$420
- Tax from tax record
- −$132 /mo · $1,588/yr
- Insurance
- −$33
- HOA
- −$0
- Vacancy / Maint / Mgmt
- −$203
- Net cashflow
- $180
Break-even live
UW: 25.0% down · 7.5% · 30yr · 1.5% tax · 5.0% vac · 8.0% maint · 8.0% mgmt
Financing live
Cash to close
- Down payment
- $20,000
- Closing costs
- $2,400
- Reserves months
- —
- Total cash needed
- —
Loan-product check · same deal, 3 products live
Conventional
25% down · 7.5% · 30yr
- Down + closing
- —
- Monthly P&I
- —
- Monthly cashflow
- —
- DSCR
- —
- Eligible?
- —
Personal DTI + credit; lowest rate.
DSCR
20% down · 8.5% · 30yr
- Down + closing
- —
- Monthly P&I
- —
- Monthly cashflow
- —
- DSCR
- —
- Eligible?
- —
No personal income docs; deal must DSCR.
Hard money
10% down · 12.0% · 12mo
- Down + closing
- —
- Monthly P&I
- —
- Monthly cashflow
- —
- DSCR
- —
- Eligible?
- —
Short-term bridge; refi at stabilization.
Rent comps 6 comps
| Address | Beds | Baths | Sqft | Rent | $/sqft | DOM | Units | Dist |
|---|---|---|---|---|---|---|---|---|
| 931 West St Grinnell, IA | 3.0 | 1.0 | 1300 | $1,100 | $0.85 | 23d | 1 | 0.28mi |
| 916 Main St Unit 4 Grinnell, IA | 2.0 | 1.0 | 1200 | $850 | $0.71 | 23d | 1 | 0.36mi |
| 401 Washington Ave Grinnell, IA | 2.0 | 1.0 | 1000 | $825 | $0.82 | 14d | 1 | 0.38mi |
| 501 Washington Ave Grinnell, IA | 3.0 | 1.0 | 1008 | $1,025 | $1.02 | 14d | 1 | 0.40mi |
| 232 8th Ave W Grinnell, IA | 3.0 | 1.0 | 1008 | $1,010 | $1.00 | 43d | 1 | 0.46mi |
| 1512 Summer St Grinnell, IA | 2.0 | 1.0 | 1339 | $1,000 | $0.75 | 43d | 1 | 1.17mi |
Listing history 2 events
-
2026-05-27status Pending
-
2026-05-27$80,000 Active
ⓘ Source: listings_history table (triggers on properties + properties_extension) + one-shot
backfill from property_details.listing_events for pre-trigger history.
Tax reassessment forecast IA · Partial reset (capped growth)
- Current annual tax
- $1,588 · $132/mo
- Projected year-2 tax
- $1,588 · $132/mo
- Expected delta
- $0/yr ($0/mo · 0.0%)
ⓘ Screening estimate from a state-policy table — verify with the county assessor before closing.
Climate risk First Street
- Flood 1/10 Low FEMA zone X (unshaded) · 0% chance over 30 yrs
- Wildfire 5/10 Major
- Heat 3/10 Moderate 7 d/yr ≥102°F today · 15 d/yr by 30 yrs out
- Wind 2/10 Low
- Air quality 2/10 Low 1 unhealthy d/yr today · 1 by 30 yrs out
Nearby sold comps map
Loading sold comps map…
Walkable amenities ~0.75 mi
Loading nearby amenities…
Taxation est. · year 1
- Rental income
- $11,625
- − Mortgage interest
- −$4,481
- − Property taxes
- −$1,588
- − Insurance
- −$400
- − Repairs & maintenance
- −$930
- − Management
- −$930
- − Depreciation
- −$2,327
- Taxable income
- $969
- Est. tax owed @ 24.0%
- −$233
- After-tax cash flow
- $1,929/yr
For passive investors: Depreciation is non-cash, so a rental often shows a tax loss while cash-flowing — sheltering income. Rental losses are passive: they offset passive income freely, and up to $25,000/yr can offset ordinary (W-2) income if you actively participate and your MAGI is under $100k (phasing out to $0 by $150k); unused losses carry forward. On sale, claimed depreciation is recaptured at up to 25%, and gains may owe capital-gains tax (a 1031 exchange can defer both). Figures are a year-1 estimate at your 24.0% rate — not tax advice; consult a CPA.
Schools (NCES district)
- District
- Grinnell-Newburg Community School District
- NCES district ID
- 1913200
- Math proficiency
- 76% ▼ -3.00%
- Reading proficiency
- 79% ▲ 3.00%
- Median HH income
- $49,893
- Composite
- 65.57/100
- National rank
- #466
- State rank
- #47 of 289 in IA
Livability — Grinnell
- Score
- 79/100
- State rank
- #123
- US rank
- #2270
Category grades
Schools grade is shown separately in the Schools card above.
Census & demographics
- Census place
- Grinnell, IA
- City population
- 11,776
- Population (ZIP)
- 11,776
Population outlook (Poweshiek County) Hauer SSP2
- Today (2025)
- 18,601 people
- By 2030
- 18,342 · -1.4%
- By 2040
- 17,944 · -3.5%
- By 2050
- 18,029 · -3.1%
- By 2075
- 19,945 · +7.2%
- By 2100
- 22,637 · +21.7%
Race, ethnicity, and origin ACS 2023
- Neighborhood character
- Predominantly White (89%)
- Race & ethnicity
- White 89% Two or more races 4% Hispanic / Latino 3% Asian 3% Black 2%
- Common ancestry
- Iranian 7% Portuguese 4% Italian 3%
- Foreign-born
- 4% · Canada, South Korea, China
- Languages at home
- 94% English-only · Spanish 2% Other Indo-European 1% German/W. Germanic 1%
Political lean MEDSL · Poweshiek
- 2024 margin
- R (+17.0) · D 40.8% · R 57.8% · Other 1.5%
- 2008→2024 swing
- -28.7pp toward R · 2008: 11.8pp · 2024: -17.0pp
- All cycles
- 2024: R+17.0 2020: R+13.3 2016: R+6.8 2012: D+9.1 2008: D+11.8
Not yet ingested
- Civics
- —
Market trends
- HPI YoY
- ▼ -40.63%
- Current HPI
- 241.5557
- Rent YoY
- —
- Metro
- —
- State GDP YoY
- ▲ 2.48%
- F500 in state
- 4
Industry mix (Fortune 500 HQ in IA)
| Industry | F500 HQs | Revenue |
|---|---|---|
| Financial Services | 1 | $16B |
|
||
| Retail / Convenience | 1 | $15B |
|
||
Price history
2 events — show timeline
- 2026-05-27 Pending — IAR
- 2026-05-27 Listed $80,000 IAR
Property tax history
+2.2%/yrLatest (2025): $1,588 · +1.3% YoY. Source: county tax records.
Cash-flow waterfall
monthlySold comps — $/sqft
last 12 mo · ≤1 miLoading sold comps…