 Duplex
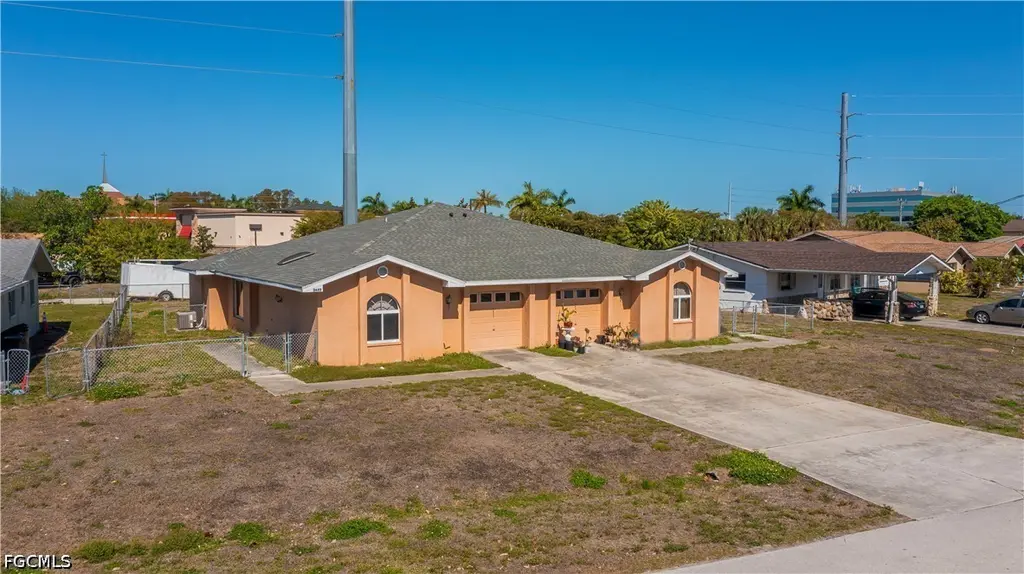
2620-2622 SE 16th Pl · Cape Coral, FL
Flood risk 7/10 · Major
- FEMA flood zone
- X (shaded)
- Chance of flooding over 30 yrs
- 0.77%
- Est. flood insurance / yr
- $507 – $1,088
Fire risk 3/10 · Minor
- Est. fire insurance / yr
- $947 – $1,759
Heat risk 10/10 · Severe
- Hot days now (above 107°F)
- 7 days/yr
- Hot days in 30 yrs
- 30 days/yr
Wind risk 10/10 · Severe
- Chance of severe wind over 30 yrs
- 99.0%
Air-quality risk 2/10 · Minimal
- Unhealthy air days now
- 1 days/yr
- Unhealthy air days in 30 yrs
- 1 days/yr
Risk factors via First Street. Map © Google.
Why this score? — see what drove the C- grade
The composite is a weighted blend of 9 inputs, each scored 0–100. Each bar is that input's sub-score; the figure is the points it added to the 100-point composite (weight × sub-score).
- Cash flow +20.5/30.0
- ARV discount +7.4/15.0
- DSCR +6.5/10.0
- 1% rule +5.8/10.0
- Schools +4.1/10.0
- Livability +3.9/5.0
- Condition / age +2.5/5.0
- Rent growth +1.1/5.0
- Appreciation +0.0/10.0
$345,000
🖨 Deal sheet 📄 Offer letter ✓ Due diligence
Multi-family units
County records classify this as Multi-Family (2-4 Unit). Listing-text estimate: 2 units. confirmed
Listing remarks
Well-maintained duplex ideally located just off Del Prado Blvd and near Veterans Pkwy, offering unbeatable convenience to shopping, dining, schools, and easy access to Ft. Myers. Situated close to county bus routes, making it especially attractive for tenants seeking walkable and transit-friendly living. Each unit features 2 bedrooms, 2 bathrooms, a 1-car garage, and approximately 1,162 sq ft of living area, plus a screened lanai for added outdoor space. Spacious layouts provide comfortable living for both tenants and owner-occupants. Major updates have been completed for peace of mind, including a new roof (2022), skylight (2020), and updated 125-amp electrical panels (2019). One unit was
Key facts
- 0.25 acre lot
- 2 garage spots
- Built 1988
Property features AI
Finance
- Financial info: Gross scheduled income: $20,340; Operating expenses: $9,300; One unit shows actual/pro forma rent of $1,695; Land lease expires 2027-02-28; Tenants are responsible for application fee, electricity, internet, sewer and water; No pets allowed
- HOA & community: Non-gated community; No association fee reported
Exterior
- Parking: Each unit includes an attached 1-car garage; Automatic garage door
- Utilities: Cable available; Public water (assessment paid); Public sewer (assessment paid)
- Home design: Multi-family property with 2 total units; Resale property; Irregular-shaped lot with paved, publicly maintained road access; Zoned RML
- Construction: Block, concrete and stucco construction; Shingle roof
- Exterior features: Fenced yard; Irrigation via reclaimed water (assessment paid)
Interior
- Kitchen: Dishwasher; Range; Refrigerator
- Bedrooms: Two 2-bedroom units (each unit described as Two Bedroom)
- Flooring: Tile flooring
- Bathrooms: Each unit has 2 full bathrooms (4 full bathrooms total)
- Heating & cooling: Central heating (electric); Central air conditioning (electric)
- Interior features: Single hung and sliding windows; Screened lanai/porch; Great room; Window coverings
- Laundry & utility: Laundry in residence; Washer/dryer hookups
Neighborhood map
What this means for you Summary
Snapshot
- This is a 2 × 2-bed/2.0-bath units multifamily listed at $345k.
Deal economics
- At list price, monthly cash flow is $388 ($5k/yr) — positive. Per door: $194/mo.
- The deal already cash-flows at list — no discount required.
- Meets the 1% rule at list price ($4k rent vs $345k).
- Cap rate 7.9% vs local median 3.1% in Cape Coral — top-decile yield for the area; either an underpriced asset or a hidden risk that comps aren't pricing in. Stress-test before assuming the spread holds.
Location & tenants
- Location reads 77/100 on livability (#208 in FL, #3,098 nationally) — a middle-class / working-renter tenant base. Strengths: housing A+, health & safety A+, amenities B+; Watch: commute F.
- Lee (suburban): math 47% / reading 50% proficiency, ranked #42 of 73 in FL (top 58%) — families likely to look elsewhere, expect single-tenant / working-renter base with shorter leases.
- Market conditions: Rents falling (-5.5%/yr); 820 active listings in the ZIP; 35 comparable units currently listed for rent nearby; rentals at typical pace (median 24d on market — plan ~3-4 weeks tenant-placement turnaround); 15,411 units permitted in Lee County in 2024 (4,686 in 5+ unit buildings).
- At $3,722/mo this rent would consume 63% of the median local household income ($71k/yr) (locally 1182% of renters already pay >50% of income on rent) — very limited rent-growth headroom before tenants either downsize or default.
Forward outlook
- Local home prices are declining (-3.0%/yr); year-one equity from $2k of loan paydown is wiped out by about $10k of value loss. Plan a longer hold.
- Lee County population projected at +44% by 2050 — long-run rental-demand tailwind backs the buy-and-hold thesis.
Negotiation context
- Only 3 days on market — expect competitive offers; lowballing is unlikely to land.
- 2 sale attempts since 2y ago with the ask held roughly flat each time — persistent listings suggest the price (not the market) is what's stuck; bring a comps-based counter.
- Current owner paid $170k; list at $345k implies a 103% gain — meaningful room to come down on a strong offer.
Risks & watch-outs
- Watch-outs: flood insurance adds $66/mo.
- Climate carrying-cost: major flood risk; severe wind risk, 99% chance of damaging wind over 30y; extreme-heat days projected 7→30/yr by 2055 (HVAC capex compounding) — expect insurance premiums to compound above CPI over the hold.
Questions for the listing agent
- Can we see the unit-by-unit rent roll, current vacancy, and any below-market leases? What's the average tenancy length?
- What capital expenditures (roof, boiler, parking lot, exteriors) have been made in the last 5 years, and what's planned in the next 2?
- What's the actual annual flood-insurance premium (NFIP or private), and is the property in a SFHA with mandatory coverage?
- Is there a deadline driving the sale (1031 exchange, divorce, estate, relocation)? That informs how much negotiation room exists.
- Schools are B-rated — typically a magnet for longer-tenancy family renters. What's the average tenant stay here, and is there a school-zone premium baked into asking?
- What's the average days-on-market for RENTAL listings here right now (not sales)? A rising rental-DOM trend means longer vacancies and softer asking-rent achievability than the comps imply.
- What's the recent tenant-quality profile in this submarket — average credit score on applications, eviction rate, late-payment / NSF rate, and stable-employment percentage? A property-management company in the area should have these aggregated.
- How much new apartment / multifamily construction is in the pipeline within 1–3 miles? Heavy new supply (>2% of stock underway) typically softens rents 12–24 months out; light construction supports rent growth.
Investment metrics
- 1% rule
- 1.08% ✓
- Cap rate
- 7.88%
- Cash-on-cash
- 5.65%
- DSCR
- 1.25
- GRM
- 7.7
CMA / ARV
- ARV (on-the-fly)
- $343,952
- Comps found
- 1
Show comp detail 1 sale within ~0.75 mi
| Address | Dist | Beds/Ba | Sqft | Sold | Price | $/sf | Match |
|---|---|---|---|---|---|---|---|
| 2620-2622 SE 16th Pl | 0.00mi | 4/4.0 | 2,324 (0%) | 1mo | $345,000 | $148 | 99 |
Match score weights: distance 35% · size 25% · config 20% · recency 20%. Top-matched comps best support the ARV.
Projected returns pro-forma
-3.0% appreciation · 0.0% rent growth · sell at horizon
- IRR
- -12.4%
- Equity multiple
- 0.57×
- Total profit
- $-41,913
- Equity at exit
- $51,441
- IRR
- -9.0%
- Equity multiple
- 0.52×
- Total profit
- $-46,147
- Equity at exit
- $29,829
Cash invested: $96,600 (down + closing). Projections, not guarantees.
Landlord ↔ Tenant lean methodology
- Overall (STATE)
- 87 Strongly Landlord-Friendly
- State Florida
- 87 Strongly Landlord-Friendly · R+3
- County
- — inherits STATE
- City
- — inherits STATE
ZIP-level market 33904
- Rents YoY
- -5.5%
- Active inventory
- 820
- Price-to-rent
- 15.4×
Monthly cashflow live
- Estimated rent
- $3,722 high interval (Pro) →
- Mortgage (P&I)
- −$1,809
- Tax from tax record
- −$533 /mo · $6,390/yr
- Insurance
- −$144
- Flood insurance flood zone
- −$66 /mo · $798/yr
- HOA
- −$0
- Vacancy / Maint / Mgmt
- −$782
- Net cashflow
- $388
Break-even live
2-unit breakdown (identical units grouped — click to expand)
| Units | Beds | Baths | Est. rent |
|---|---|---|---|
| 2× units | 2 | 2 | $3,722 |
| #1 | 2 | 2 | $1,861 |
| #2 | 2 | 2 | $1,861 |
| Total (2 units) | $3,722 | ||
UW: 25.0% down · 7.5% · 30yr · 1.5% tax · 5.0% vac · 8.0% maint · 8.0% mgmt
Financing live
Cash to close
- Down payment
- $86,250
- Closing costs
- $10,350
- Reserves months
- —
- Total cash needed
- —
Loan-product check · same deal, 3 products live
Conventional
25% down · 7.5% · 30yr
- Down + closing
- —
- Monthly P&I
- —
- Monthly cashflow
- —
- DSCR
- —
- Eligible?
- —
Personal DTI + credit; lowest rate.
DSCR
20% down · 8.5% · 30yr
- Down + closing
- —
- Monthly P&I
- —
- Monthly cashflow
- —
- DSCR
- —
- Eligible?
- —
No personal income docs; deal must DSCR.
Hard money
10% down · 12.0% · 12mo
- Down + closing
- —
- Monthly P&I
- —
- Monthly cashflow
- —
- DSCR
- —
- Eligible?
- —
Short-term bridge; refi at stabilization.
Rent comps 35 comps
| Address | Beds | Baths | Sqft | Rent | $/sqft | DOM | Units | Dist |
|---|---|---|---|---|---|---|---|---|
| 1809 Everest Pkwy Cape Coral, FL | 3.0 | 2.5 | 1680 | $2,400 | $1.43 | 23d | 1 | 0.35mi |
| 1320 SE 25th Ln Cape Coral, FL | 3.0 | 2.0 | 1752 | $2,700 | $1.54 | 3d | 1 | 0.37mi |
| 2633 SE 19th Pl Cape Coral, FL | 3.0 | 2.0 | 1924 | $8,379 | $4.35 | 23d | 1 | 0.48mi |
| 1326 SE 23rd Ter Cape Coral, FL | 3.0 | 2.0 | 1982 | $2,150 | $1.08 | 14d | 1 | 0.52mi |
| 2220 SE 18th Ave Cape Coral, FL | 4.0 | 2.0 | 2274 | $3,200 | $1.41 | 21d | 1 | 0.55mi |
| 3010 SE 19th Ave Cape Coral, FL | 3.0 | 2.0 | 2435 | $2,800 | $1.15 | 23d | 1 | 0.63mi |
| 3105 SE 18th Ave Cape Coral, FL | 3.0 | 2.0 | 1978 | $2,995 | $1.51 | 3d | 1 | 0.65mi |
| 1410 SE 31st Ter Cape Coral, FL | 3.0 | 2.0 | 1792 | $5,600 | $3.12 | 23d | 1 | 0.73mi |
| 1124 SE 29th St Cape Coral, FL | 3.0 | 2.0 | 1578 | $1,500 | $0.95 | 23d | 1 | 0.73mi |
| 1115 SE 30th Ter Cape Coral, FL | 4.0 | 3.0 | 3000 | $2,950 | $0.98 | 23d | 1 | 0.78mi |
| 1038 SE 30th St Cape Coral, FL | 3.0 | 2.0 | 1754 | $2,400 | $1.37 | 21d | 1 | 0.88mi |
| 1106 SE 21st Ln Cape Coral, FL | 3.0 | 2.0 | 1946 | $2,200 | $1.13 | 23d | 1 | 0.88mi |
| 2232 SE 27th St Cape Coral, FL | 3.0 | 3.0 | 1894 | $4,250 | $2.24 | 2d | 1 | 0.90mi |
| 3142 SE 22nd Pl Cape Coral, FL | 4.0 | 2.0 | 2170 | $3,500 | $1.61 | 23d | 1 | 0.96mi |
| 3116 SE 11th Ave Cape Coral, FL | 3.0 | 2.0 | 1878 | $2,500 | $1.33 | 2d | 1 | 0.98mi |
| 1901 SE 15th Pl Unit A Cape Coral, FL | 4.0 | 2.0 | 2970 | $1,595 | $0.54 | 23d | 1 | 1.00mi |
| 1402 SE 34th St Cape Coral, FL | 3.0 | 2.0 | 1613 | $1,899 | $1.18 | 11d | 1 | 1.03mi |
| 1426 SE 34th Ter Cape Coral, FL | 3.0 | 2.0 | 1740 | $7,103 | $4.08 | 23d | 1 | 1.06mi |
| 3418 SE 19th Ave Cape Coral, FL | 3.0 | 2.0 | 1880 | $3,500 | $1.86 | 23d | 1 | 1.11mi |
| 1406 SE 18th Ter Cape Coral, FL | 3.0 | 2.0 | 1828 | $2,800 | $1.53 | 23d | 1 | 1.11mi |
| 2308 SE 27th St Cape Coral, FL | 3.0 | 2.0 | 1612 | $4,520 | $2.80 | 23d | 1 | 1.16mi |
| 3510 SE 19th Pl Cape Coral, FL | 3.0 | 3.0 | 2318 | $4,000 | $1.73 | 14d | 1 | 1.17mi |
| 1322 SE 35th Ter Cape Coral, FL | 4.0 | 2.0 | 1803 | $2,850 | $1.58 | 23d | 1 | 1.19mi |
| 1125 SE 35th St Cape Coral, FL | 4.0 | 2.0 | 2023 | $2,400 | $1.19 | 16d | 1 | 1.22mi |
| 3402 SE 11th Ave Cape Coral, FL | 3.0 | 2.0 | 1882 | $7,099 | $3.77 | 23d | 1 | 1.24mi |
| 620 SE 29th St Cape Coral, FL | 3.0 | 2.0 | 1925 | $2,006 | $1.04 | 3d | 1 | 1.29mi |
| 2423 Everest Pkwy Cape Coral, FL | 3.0 | 2.0 | 1683 | $4,350 | $2.58 | 11d | 1 | 1.32mi |
| 3425 SE 10th Ave Cape Coral, FL | 3.0 | 2.0 | 1706 | $2,500 | $1.47 | 23d | 1 | 1.37mi |
| 1781 Coral Point Dr Cape Coral, FL | 4.0 | 2.0 | 1710 | $772 | $0.45 | 23d | 1 | 1.38mi |
| 712 SE 32nd Ter Cape Coral, FL | 4.0 | 2.0 | 1993 | $2,950 | $1.48 | 13d | 1 | 1.39mi |
| 620 SE 21st Ter Cape Coral, FL | 3.0 | 2.0 | 1722 | $4,210 | $2.44 | 23d | 1 | 1.41mi |
| 1811 SE 37th Ter Cape Coral, FL | 3.0 | 3.0 | 2657 | $8,380 | $3.15 | 23d | 1 | 1.43mi |
| 711 SE 33rd Ter Cape Coral, FL | 3.0 | 2.0 | 2063 | $3,500 | $1.70 | 23d | 1 | 1.45mi |
| 613 SE 21st St Cape Coral, FL | 3.0 | 2.0 | 1781 | $2,700 | $1.52 | 23d | 1 | 1.48mi |
| 904 SE 18th St Cape Coral, FL | 3.0 | 2.0 | 1776 | $2,100 | $1.18 | 23d | 1 | 1.49mi |
Listing history 5 events
-
2026-05-01status Pending
-
2026-04-28$345,000 Active
-
2024-03-15historical $1,695
-
2024-03-01$1,695
-
2002-10-22soldstatus $169,600
ⓘ Source: listings_history table (triggers on properties + properties_extension) + one-shot
backfill from property_details.listing_events for pre-trigger history.
Tax reassessment forecast FL · Resets to sale price
- Current annual tax
- $6,390 · $533/mo
- Projected year-2 tax
- $6,390 · $533/mo
- Expected delta
- $0/yr ($0/mo · 0.0%)
ⓘ Screening estimate from a state-policy table — verify with the county assessor before closing.
Climate risk First Street
- Flood 7/10 Severe FEMA zone X (shaded) · 77% chance over 30 yrs
- Wildfire 3/10 Moderate
- Heat 10/10 Extreme 7 d/yr ≥107°F today · 30 d/yr by 30 yrs out
- Wind 10/10 Extreme 99% chance of damaging wind over 30 yrs
- Air quality 2/10 Low 1 unhealthy d/yr today · 1 by 30 yrs out
Nearby sold comps map
Loading sold comps map…
Walkable amenities ~0.75 mi
Loading nearby amenities…
Taxation est. · year 1
- Rental income
- $44,664
- − Mortgage interest
- −$19,325
- − Property taxes
- −$6,390
- − Insurance
- −$2,522
- − Repairs & maintenance
- −$3,573
- − Management
- −$3,573
- − Depreciation
- −$10,036
- Taxable loss
- −$757
- Est. tax savings @ 24.0%
- +$182
- After-tax cash flow
- $4,843/yr
For passive investors: Depreciation is non-cash, so a rental often shows a tax loss while cash-flowing — sheltering income. Rental losses are passive: they offset passive income freely, and up to $25,000/yr can offset ordinary (W-2) income if you actively participate and your MAGI is under $100k (phasing out to $0 by $150k); unused losses carry forward. On sale, claimed depreciation is recaptured at up to 25%, and gains may owe capital-gains tax (a 1031 exchange can defer both). Figures are a year-1 estimate at your 24.0% rate — not tax advice; consult a CPA.
Schools (NCES district)
- District
- Lee
- NCES district ID
- 1201080
- Math proficiency
- 47% ▼ -11.00%
- Reading proficiency
- 50% ▼ -4.00%
- Median HH income
- $49,518
- Composite
- 41.49/100
- National rank
- #3458
- State rank
- #42 of 73 in FL
Livability — Cape Coral
- Score
- 77/100
- State rank
- #208
- US rank
- #3098
Category grades
Schools grade is shown separately in the Schools card above.
Census & demographics
- Census place
- Cape Coral, FL
- County
- Lee County · 788,662 people
- City population
- 217,388
- Metro
- Cape Coral-Fort Myers, FL
- Population (ZIP)
- 33,599
- Household income
- $71,190
- Rent vs Own
- Severe rent burden
- 1182.0
Population outlook (Lee County) Hauer SSP2
- Today (2025)
- 871,946 people
- By 2030
- 955,468 · +9.6%
- By 2040
- 1,113,587 · +27.7%
- By 2050
- 1,256,891 · +44.1%
- By 2075
- 1,560,270 · +78.9%
- By 2100
- 1,726,848 · +98.0%
Race, ethnicity, and origin ACS 2023
- Neighborhood character
- Predominantly White (76%)
- Race & ethnicity
- White 76% Hispanic / Latino 16% Two or more races 11% Black 3% Asian 2%
- Hispanic origin (detail)
- Mexican 2% Puerto Rican 2% Cuban 9%
- Common ancestry
- Romanian 4% Lithuanian 2% Slovak 2%
- Foreign-born
- 14% · Canada, China, Jamaica
- Languages at home
- 82% English-only · Spanish 13% Other Indo-European 1% Chinese 1%
Political lean MEDSL · Lee
- 2024 margin
- Strong R (+28.4) · D 35.5% · R 63.9%
- 2008→2024 swing
- -18.0pp toward R · 2008: -10.4pp · 2024: -28.4pp
- All cycles
- 2024: R+28.4 2020: R+19.2 2016: R+20.4 2012: R+16.6 2008: R+10.4
Not yet ingested
- Civics
- —
Market trends
- HPI YoY
- ▼ -190.05%
- Current HPI
- 266.3458
- Rent YoY
- ▼ -5.48%
- Metro
- Cape Coral-Fort Myers, FL
- State GDP YoY
- ▲ 3.28%
- F500 in state
- 36
Industry mix (Fortune 500 HQ in FL)
| Industry | F500 HQs | Revenue |
|---|---|---|
| Industrial Technology | 2 | $29B |
|
||
| Insurance | 2 | $17B |
|
||
| Retail | 1 | $60B |
|
||
| Technology Distribution | 1 | $58B |
|
||
| Homebuilding | 1 | $35B |
|
||
| Technology Manufacturing | 1 | $35B |
|
||
Price history
+103.4% since first listed5 events — show timeline
- 2026-05-01 Pending — FORTMLS
- 2026-04-28 Listed $345,000 FORTMLS
- 2024-03-15 Rental Removed $1,695 FORTMLS
- 2024-03-01 Listed for Rent $1,695 FORTMLS
- 2002-10-22 Sold (Public Records) $169,600 Public Records
Property tax history
+7.8%/yrLatest (2025): $6,390 · +20.3% YoY. Source: county tax records.
Cash-flow waterfall
monthlySold comps — $/sqft
last 12 mo · ≤1 miLoading sold comps…