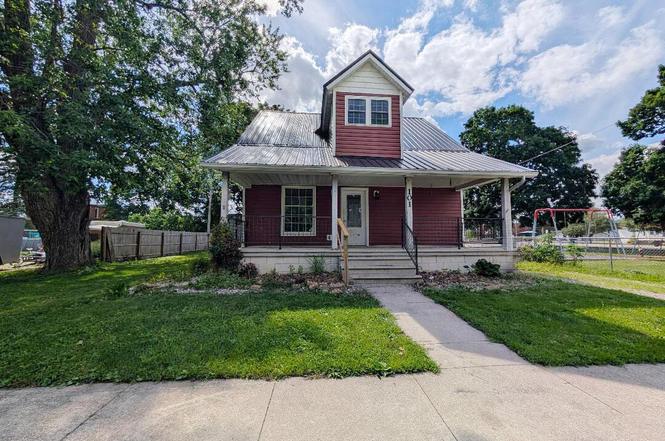
101 N Church St · Edon, OH
Flood risk 1/10 · Minimal
- FEMA flood zone
- X
- Chance of flooding over 30 yrs
- 0.0%
- Est. flood insurance / yr
- $473 – $860
Fire risk 1/10 · Minimal
- Est. fire insurance / yr
- $713 – $1,323
Heat risk 3/10 · Minor
- Hot days now (above 99°F)
- 7 days/yr
- Hot days in 30 yrs
- 17 days/yr
Wind risk 2/10 · Minimal
- Chance of severe wind over 30 yrs
- —
Air-quality risk 3/10 · Minor
- Unhealthy air days now
- 1 days/yr
- Unhealthy air days in 30 yrs
- 3 days/yr
Risk factors via First Street. Map © Google.
Why this score? — see what drove the B- grade
The composite is a weighted blend of 9 inputs, each scored 0–100. Each bar is that input's sub-score; the figure is the points it added to the 100-point composite (weight × sub-score).
- Cash flow +25.2/30.0
- ARV discount +15.0/15.0
- DSCR +8.3/10.0
- 1% rule +6.5/10.0
- Schools +5.6/10.0
- Livability +3.2/5.0
- Rent growth +2.5/5.0
- Condition / age +2.5/5.0
- Appreciation +0.0/10.0
$105,000
🖨 Deal sheet 📄 Offer letter ✓ Due diligence
Listing remarks MLS
Charm & updates abound in this adorable bungalow! Upgraded kitchen with massive island and vaulted ceiling (plus tons or storage and a double oven). Newer laminate flooring & replacement windows. Awesome bathroom with walk-in tile shower & separate jetted tub! Fenced yard, updated landscaping, and an incredible porch, too! Main floor office could be a 3rd bedroom. Metal roof done Oct '18.
Key facts
- Updated siding
- Separate jetted tub
- Laundry area
Tags
Property features AI
Exterior
- Parking: Driveway with gravel surface
- Utilities: Electricity connected (circuit breakers); Natural gas connected; Public water; Sanitary sewer
- Home design: Single-family residence; House with two levels (2 stories); Not attached to other structures
- Construction: Vinyl siding; Block foundation and crawl space; Metal and shingle roof
- Exterior features: Front porch; Lot approximately 0.14 acres
Interior
- Kitchen: Kitchen on main level (approx. 17 x 13)
- Bedrooms: Bedroom 2 on upper level (12 x 17); Bedroom 3 on upper level (11 x 16)
- Flooring: Laminate flooring
- Bathrooms: 1 full bathroom; 1 half bathroom (total 1.5 baths)
- Heating & cooling: Forced air heating
- Interior features: Vaulted ceilings; Primary bathroom with separate shower; Unfinished basement
- Laundry & utility: Laundry on main level
Neighborhood map
What this means for you Summary
Snapshot
- This is a 3-bed/1.5-bath single-family listed at $105k.
Deal economics
- At list price, monthly cash flow is $236 ($3k/yr) — positive.
- The deal already cash-flows at list — no discount required.
- Meets the 1% rule at list price ($1k rent vs $105k).
Location & tenants
- Location reads 65/100 on livability (#744 in OH) — a middle-class / working-renter tenant base. Strengths: cost of living A+, housing A+, schools A; Watch: crime D+, amenities F, commute F.
- Edon Northwest Local (rural): math 62% / reading 70% proficiency, ranked #207 of 656 in OH (top 32%) — acceptable for families but not a draw, mixed tenant base, ~2y average lease.
- Market conditions: 8 active listings in the ZIP; solid renter incomes; 40 units permitted in Williams County in 2024 (0 in 5+ unit buildings).
- This rent is only 16% of the median local income ($89k/yr) — well below the 30% rent-burden line; pricing power to push rent on renewal without tenant pushback.
Forward outlook
- Local home prices are declining (-3.0%/yr); year-one equity from $726 of loan paydown is wiped out by about $3k of value loss. Plan a longer hold.
- Williams County population projected at -14% by 2050 — secular population decline; favor cash flow + early exit over multi-decade hold.
Negotiation context
- Only 3 days on market — expect competitive offers; lowballing is unlikely to land.
- 4 sale attempts since 13y ago with the ask held roughly flat each time — persistent listings suggest the price (not the market) is what's stuck; bring a comps-based counter.
Risks & watch-outs
- Watch-outs: built in 1920 — expect roof / HVAC / electrical / plumbing capex.
Questions for the listing agent
- Built in 1920 — when were the roof, HVAC, electrical panel, plumbing, and water heater last replaced?
- Is there a deadline driving the sale (1031 exchange, divorce, estate, relocation)? That informs how much negotiation room exists.
- Schools are A-rated — typically a magnet for longer-tenancy family renters. What's the average tenant stay here, and is there a school-zone premium baked into asking?
- Crime grade is D in this area — have there been break-ins, vandalism, or insurance claims at this property in the last 3 years? What carrier currently insures it and at what premium?
- What's the average days-on-market for RENTAL listings here right now (not sales)? A rising rental-DOM trend means longer vacancies and softer asking-rent achievability than the comps imply.
- What's the recent tenant-quality profile in this submarket — average credit score on applications, eviction rate, late-payment / NSF rate, and stable-employment percentage? A property-management company in the area should have these aggregated.
- How much new for-sale + rental construction is in the pipeline within 1–3 miles? Heavy new supply typically softens prices + rents 12–24 months out; constrained supply supports both.
Investment metrics
- 1% rule
- 1.15% ✓
- Cap rate
- 8.99%
- Cash-on-cash
- 9.63%
- DSCR
- 1.43
- GRM
- 7.2
CMA / ARV
- ARV (on-the-fly)
- $161,588
- Comps found
- 6
Show comp detail 6 sales within ~0.75 mi
| Address | Dist | Beds/Ba | Sqft | Sold | Price | $/sf | Match |
|---|---|---|---|---|---|---|---|
| 303 Walz St | 0.26mi | 4/2.5 (+1) | 1,376 (-1%) | 2mo | $185,000 | $134 | 75 |
| 110 N Main St | 0.09mi | 4/1.0 (+1) | 1,440 (+3%) | 19mo | $149,900 | $104 | 67 |
| 116 E Indiana St | 0.05mi | 3/1.0 | 1,504 (+8%) | 24mo | $149,350 | $99 | 62 |
| 403 W Indiana St | 0.36mi | 3/1.0 | 1,300 (-7%) | 15mo | $105,000 | $81 | 57 |
| 401 N Summit St | 0.30mi | 4/2.0 (+1) | 1,509 (+8%) | 10mo | $235,000 | $156 | 57 |
| 801 W Indiana | 0.70mi | 3/2.0 | 1,408 (+1%) | 12mo | $162,900 | $116 | 53 |
Match score weights: distance 35% · size 25% · config 20% · recency 20%. Top-matched comps best support the ARV.
Projected returns pro-forma
-3.0% appreciation · 3.0% rent growth · sell at horizon
- IRR
- -1.8%
- Equity multiple
- 0.93×
- Total profit
- $-1,978
- Equity at exit
- $15,656
- IRR
- 7.9%
- Equity multiple
- 1.60×
- Total profit
- $17,680
- Equity at exit
- $9,078
Cash invested: $29,400 (down + closing). Projections, not guarantees.
Landlord ↔ Tenant lean methodology
- Overall (STATE)
- 73 Landlord-Friendly
- State Ohio
- 73 Landlord-Friendly · R+6
- County
- — inherits STATE
- City
- — inherits STATE
ZIP-level market 43518
- Home prices YoY
- -12.9%
- Active inventory
- 8
- Price-to-rent
- 7.2×
Monthly cashflow live
- Estimated rent
- $1,210 medium interval (Pro) →
- Mortgage (P&I)
- −$551
- Tax from tax record
- −$126 /mo · $1,509/yr
- Insurance
- −$44
- HOA
- −$0
- Vacancy / Maint / Mgmt
- −$254
- Net cashflow
- $236
Break-even live
UW: 25.0% down · 7.5% · 30yr · 1.5% tax · 5.0% vac · 8.0% maint · 8.0% mgmt
Financing live
Cash to close
- Down payment
- $26,250
- Closing costs
- $3,150
- Reserves months
- —
- Total cash needed
- —
Loan-product check · same deal, 3 products live
Conventional
25% down · 7.5% · 30yr
- Down + closing
- —
- Monthly P&I
- —
- Monthly cashflow
- —
- DSCR
- —
- Eligible?
- —
Personal DTI + credit; lowest rate.
DSCR
20% down · 8.5% · 30yr
- Down + closing
- —
- Monthly P&I
- —
- Monthly cashflow
- —
- DSCR
- —
- Eligible?
- —
No personal income docs; deal must DSCR.
Hard money
10% down · 12.0% · 12mo
- Down + closing
- —
- Monthly P&I
- —
- Monthly cashflow
- —
- DSCR
- —
- Eligible?
- —
Short-term bridge; refi at stabilization.
Listing history 4 events
-
2026-06-19days on market $105,000 Active 3 DOM
-
2026-06-18days on market $105,000 Active 2 DOM
-
2026-06-17remarks 699-char remark
-
2026-06-17$105,000 Active 1 DOM
ⓘ Source: listings_history table (triggers on properties + properties_extension) + one-shot
backfill from property_details.listing_events for pre-trigger history.
Tax reassessment forecast OH · Partial reset (capped growth)
- Current annual tax
- $1,509 · $126/mo
- Projected year-2 tax
- $1,573 · $131/mo
- Expected delta
- +$65/yr (+$5/mo · 4.3%)
ⓘ Screening estimate from a state-policy table — verify with the county assessor before closing.
Climate risk First Street
- Flood 1/10 Low FEMA zone X · 0% chance over 30 yrs
- Wildfire 1/10 Low
- Heat 3/10 Moderate 7 d/yr ≥99°F today · 17 d/yr by 30 yrs out
- Wind 2/10 Low
- Air quality 3/10 Moderate 1 unhealthy d/yr today · 3 by 30 yrs out
Nearby sold comps map
Loading sold comps map…
Walkable amenities ~0.75 mi
Loading nearby amenities…
Taxation est. · year 1
- Rental income
- $14,521
- − Mortgage interest
- −$5,882
- − Property taxes
- −$1,509
- − Insurance
- −$525
- − Repairs & maintenance
- −$1,162
- − Management
- −$1,162
- − Depreciation
- −$3,055
- Taxable income
- $1,228
- Est. tax owed @ 24.0%
- −$295
- After-tax cash flow
- $2,536/yr
For passive investors: Depreciation is non-cash, so a rental often shows a tax loss while cash-flowing — sheltering income. Rental losses are passive: they offset passive income freely, and up to $25,000/yr can offset ordinary (W-2) income if you actively participate and your MAGI is under $100k (phasing out to $0 by $150k); unused losses carry forward. On sale, claimed depreciation is recaptured at up to 25%, and gains may owe capital-gains tax (a 1031 exchange can defer both). Figures are a year-1 estimate at your 24.0% rate — not tax advice; consult a CPA.
Schools (NCES district)
- District
- Edon Northwest Local
- NCES district ID
- 3905062
- Math proficiency
- 62% ▼ -15.00%
- Reading proficiency
- 70% ▼ -10.00%
- Median HH income
- $45,130
- Composite
- 55.56/100
- National rank
- #1240
- State rank
- #207 of 656 in OH
Livability — Edon
- Score
- 65/100
- State rank
- #744
- US rank
- #13424
Category grades
Schools grade is shown separately in the Schools card above.
Census & demographics
- Census place
- Edon, OH
- County
- Williams · 37,585 people
- Population (ZIP)
- 3,003
- Household income
- $88,910
- Rent vs Own
Population outlook (Williams County) Hauer SSP2
- Today (2025)
- 36,125 people
- By 2030
- 35,264 · -2.4%
- By 2040
- 33,264 · -7.9%
- By 2050
- 31,072 · -14.0%
- By 2075
- 26,553 · -26.5%
- By 2100
- 21,318 · -41.0%
Race, ethnicity, and origin ACS 2023
- Neighborhood character
- Predominantly White (87%)
- Race & ethnicity
- White 87% Hispanic / Latino 9% Two or more races 4%
- Hispanic origin (detail)
- Mexican 6%
- Common ancestry
- Italian 3% Romanian 2% Portuguese 1%
- Foreign-born
- 1%
- Languages at home
- 99% English-only · Spanish 1%
Political lean MEDSL · Williams
- 2024 margin
- Solid R (+48.2) · D 25.4% · R 73.7%
- 2008→2024 swing
- -39.0pp toward R · 2008: -9.3pp · 2024: -48.2pp
- All cycles
- 2024: R+48.2 2020: R+46.2 2016: R+43.8 2012: R+16.3 2008: R+9.3
Not yet ingested
- Civics
- —
Market trends
- HPI YoY
- ▼ -37.70%
- Current HPI
- 253.3001
- Rent YoY
- —
- Metro
- —
- State GDP YoY
- ▲ 1.98%
- F500 in state
- 48
Industry mix (Fortune 500 HQ in OH)
| Industry | F500 HQs | Revenue |
|---|---|---|
| Insurance | 3 | $145B |
|
||
| Industrial Machinery | 3 | $49B |
|
||
| Financial Services | 3 | $24B |
|
||
| Consumer Goods | 2 | $93B |
|
||
| Aerospace / Defense | 2 | $47B |
|
||
| Utilities | 2 | $33B |
|
||
Price history
+218.2% since first listed17 events — show timeline
- 2026-06-14 Listed $105,000 NORIS
- 2025-10-14 Price Changed $97,300 NORIS
- 2025-10-14 Price Changed $83,500 NORIS
- 2025-10-14 Price Changed $78,000 NORIS
- 2019-12-05 Sold (Public Records) $97,300 Public Records
- 2019-12-04 Sold (MLS) $97,300 NORIS
- 2019-10-09 Listed $99,000 NORIS
- 2016-07-07 Sold (Public Records) $83,500 Public Records
- 2016-07-07 Sold (MLS) $83,500 NORIS
- 2016-07-06 Price Changed $88,900 NORIS
- 2016-03-30 Listed $88,900 NORIS
- 2014-06-16 Sold (Public Records) $78,000 Public Records
- 2014-06-13 Sold (MLS) $78,000 NORIS
- 2014-06-06 Price Changed $82,000 NORIS
- 2013-12-16 Listed $82,000 NORIS
- 2006-09-12 Sold (Public Records) $49,000 Public Records
- 2005-11-15 Sold (Public Records) $33,000 Public Records
Property tax history
+6.5%/yrLatest (2025): $1,509 · +0.0% YoY. Source: county tax records.
Cash-flow waterfall
monthlySold comps — $/sqft
last 12 mo · ≤1 miLoading sold comps…