37286 Canton Way · Caliente, CA
Flood risk 1/10 · Minimal
- FEMA flood zone
- X (unshaded)
- Chance of flooding over 30 yrs
- 0.0%
- Est. flood insurance / yr
- $507 – $1,088
Fire risk 8/10 · Major
- Est. fire insurance / yr
- $659 – $1,223
Heat risk 5/10 · Moderate
- Hot days now (above 95°F)
- 7 days/yr
- Hot days in 30 yrs
- 16 days/yr
Wind risk 1/10 · Minimal
- Chance of severe wind over 30 yrs
- —
Air-quality risk 10/10 · Severe
- Unhealthy air days now
- 22 days/yr
- Unhealthy air days in 30 yrs
- 30 days/yr
Risk factors via First Street. Map © Google.
Why this score? — see what drove the F grade
The composite is a weighted blend of 9 inputs, each scored 0–100. Each bar is that input's sub-score; the figure is the points it added to the 100-point composite (weight × sub-score).
- ARV discount +7.5/15.0
- Cash flow +7.4/30.0
- Appreciation +6.0/10.0
- Schools +3.4/10.0
- Rent growth +2.5/5.0
- Livability +2.5/5.0
- Condition / age +2.5/5.0
- 1% rule +1.5/10.0
- DSCR +1.5/10.0
$191,500
🖨 Deal sheet (PDF) 📄 Offer letter ✓ Due diligence
Listing remarks MLS
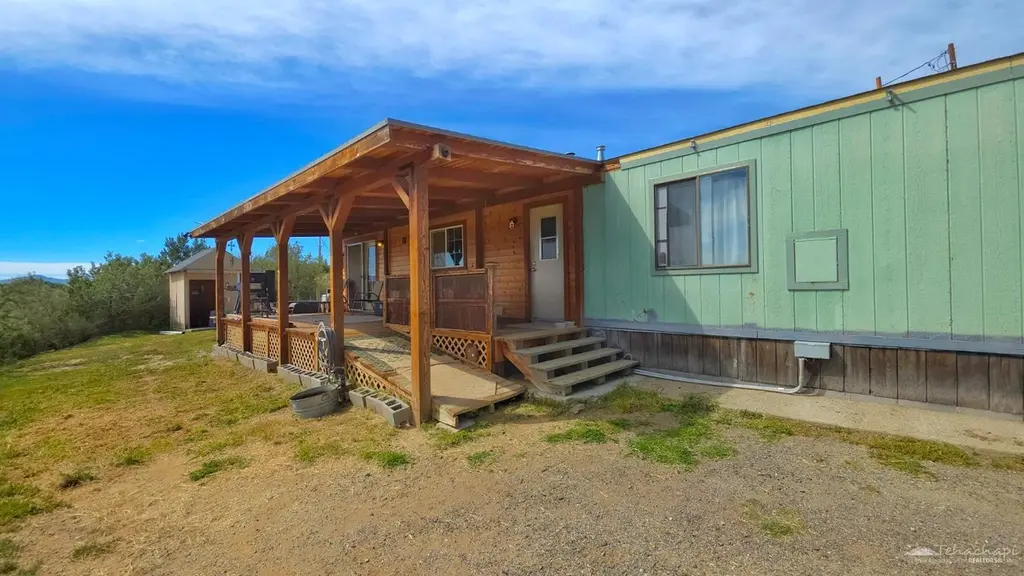
Priced to sell manufactured home and mobile home sitting on 20 acres tucked in the mountains of Twin Oaks! Property features include a stainless stove, ceiling fans, laundry room, water softener system, shared well, with the roof being installed approximately 9 years ago. Expand your living space and relax on the extended covered porch with breathtaking mountain and valley views! Detached over-sized shop has power and water at the exterior, perfect for storing vehicles, ATVs, tools and more. Extra storage space with three sheds, all with electricity, one can be used as a bonus room, equipped with a ceiling fan. Great opportunity to own two structures on one parcel in a private gated community. Located just off of the paved road for easy travels. Cash offers preferred. Call today for more information!
Key facts
- Stainless stove
- Laundry room
- 20.37 acre lot
Tags
Neighborhood map
What this means for you Summary
Snapshot
- This is a 2-bed/2.0-bath manufactured listed at $192k.
Deal economics
- At list price, monthly cash flow is $-247 ($-3k/yr) — negative.
- To cash-flow at today's rent, offer at most $148k (22.7% below list).
- To meet the 1% rule (rent ≥ 1% of price), the offer needs to be $125k (34.8% below list).
- Recommended offer: $125k (34.8% below list) — sets the bar for 1% rule.
Location & tenants
- Location reads: area grade F — affects rentability + tenant quality, not the cash-flow math above.
- Kern High (urban): math 21% / reading 51% proficiency, ranked #860 of 1,400 in CA (top 61%) — families likely to look elsewhere, expect single-tenant / working-renter base with shorter leases.
- Zoned schools: Piute Mountain Elementary (math 10% / reading 30%, grade F, #1,242 of 1,571 statewide, top 80%, 74 students, 70% FRL); Foothill High (reading 77%, 2,045 students, 90% FRL).
- Zoned-school proficiency averages 20% at this address vs 36% district-wide (-16 pts) — the specific schools serving this property underperform the Kern High average; the district grade overstates school quality for this exact location.
- Market conditions: 93 active listings in the ZIP; 3,244 units permitted in Kern County in 2024 (73 in 5+ unit buildings).
Forward outlook
- In year one you build about $5k of equity ($1k loan paydown + $4k appreciation (2.1% local appreciation)).
- Kern County population projected at +17% by 2050 — long-run rental-demand tailwind backs the buy-and-hold thesis.
- By year 7, paydown + projected appreciation supports a ~$34k cash-out refi (75% LTV) — recoverable capital for the next deal without selling this one.
Negotiation context
- It's been on market 106 days — a 9% lower offer ($174k) is reasonable based on typical stale-listing flexibility.
- 2 sale attempts; this cycle's ask has dropped $33k (15%) from the opening price — seller is motivated, your offer sets the floor, not the list.
Risks & watch-outs
- Climate carrying-cost: severe wildfire risk; extreme-heat days projected 7→16/yr by 2055 (HVAC capex compounding) — expect insurance premiums to compound above CPI over the hold.
Questions for the listing agent
- What do current leases actually rent for vs. the listed asking? Can we see a recent rent roll and the last 12 months of T-12 income?
- It's been on market 106 days. Have you received any prior offers? Is the seller open to a 35% concession, seller financing, or rate buy-down credit?
- Why hasn't it sold? Are there any deal-killer items the seller is aware of (foundation, flood, title, zoning, code violations)?
- Is there a deadline driving the sale (1031 exchange, divorce, estate, relocation)? That informs how much negotiation room exists.
- The area grade is low — what's the realistic commute time and amenity access for the typical tenant pool here? Any planned neighborhood developments (good or bad) we should know about?
- What's the average days-on-market for RENTAL listings here right now (not sales)? A rising rental-DOM trend means longer vacancies and softer asking-rent achievability than the comps imply.
- What's the recent tenant-quality profile in this submarket — average credit score on applications, eviction rate, late-payment / NSF rate, and stable-employment percentage? A property-management company in the area should have these aggregated.
- How much new for-sale + rental construction is in the pipeline within 1–3 miles? Heavy new supply typically softens prices + rents 12–24 months out; constrained supply supports both.
Investment metrics
- 1% rule
- 0.65% ✗
- Cap rate
- 4.75%
- Cash-on-cash
- -5.52%
- DSCR
- 0.75
- GRM
- 12.8
CMA / ARV
No comps found within radius.
Projected returns pro-forma
2.08% appreciation · 3.0% rent growth · sell at horizon
- IRR
- -0.6%
- Equity multiple
- 0.97×
- Total profit
- $-1,827
- Equity at exit
- $76,368
- IRR
- 3.7%
- Equity multiple
- 1.51×
- Total profit
- $27,315
- Equity at exit
- $110,615
Cash invested: $53,620 (down + closing). Projections, not guarantees.
Landlord ↔ Tenant lean methodology
- Overall (STATE)
- 18 Strongly Tenant-Friendly
- State California
- 18 Strongly Tenant-Friendly · D+13
- County
- — inherits STATE
- City
- — inherits STATE
ZIP-level market 93518
- Home prices YoY
- 0.6%
- Active inventory
- 93
- Price-to-rent
- 12.8×
Monthly cashflow live
- Estimated rent
- $1,249 medium interval (Pro) →
- Mortgage (P&I)
- −$1,004
- Tax from tax record
- −$149 /mo · $1,788/yr
- Insurance
- −$80
- HOA
- −$0
- Vacancy / Maint / Mgmt
- −$262
- Net cashflow
- $-247
Break-even live
Sensitivity live
| Price | -10% $-138 | -5% $-192 | +0% $-247 | +5% $-301 | +10% $-355 |
|---|---|---|---|---|---|
| Rent | -10% $-345 | -5% $-296 | +0% $-247 | +5% $-197 | +10% $-148 |
| Rate | -1.0pp $-150 | -0.5pp $-198 | base $-247 | +0.5pp $-296 | +1.0pp $-347 |
UW: 25.0% down · 7.5% · 30yr · 1.5% tax · 5.0% vac · 8.0% maint · 8.0% mgmt
Financing live
Cash to close
- Down payment
- $47,875
- Closing costs
- $5,745
- Reserves months
- —
- Total cash needed
- —
Loan-product check · same deal, 3 products live
Conventional
25% down · 7.5% · 30yr
- Down + closing
- —
- Monthly P&I
- —
- Monthly cashflow
- —
- DSCR
- —
- Eligible?
- —
Personal DTI + credit; lowest rate.
DSCR
20% down · 8.5% · 30yr
- Down + closing
- —
- Monthly P&I
- —
- Monthly cashflow
- —
- DSCR
- —
- Eligible?
- —
No personal income docs; deal must DSCR.
Hard money
10% down · 12.0% · 12mo
- Down + closing
- —
- Monthly P&I
- —
- Monthly cashflow
- —
- DSCR
- —
- Eligible?
- —
Short-term bridge; refi at stabilization.
Listing history 19 events
-
2026-06-21days on market $191,500 Active 106 DOM
-
2026-06-18days on market $191,500 Active 103 DOM
-
2026-06-17days on market $191,500 Active 102 DOM
-
2026-06-16days on market $191,500 Active 101 DOM
-
2026-06-15days on market $191,500 Active 100 DOM
-
2026-06-14days on market $191,500 Active 98 DOM
-
2026-06-13days on market $191,500 Active 97 DOM
-
2026-06-10days on market $191,500 Active 95 DOM
-
2026-06-09days on market $191,500 Active 94 DOM
-
2026-06-08days on market $191,500 Active 93 DOM
-
2026-06-07days on market $191,500 Active 92 DOM
-
2026-06-05pricedays on market $191,500 Active 89 DOM
-
2026-06-03days on market $224,900 Active 88 DOM
-
2026-06-03days on market $224,900 Active 87 DOM
-
2026-06-01days on market $224,900 Active 86 DOM
-
2026-05-31days on market $224,900 Active 85 DOM
-
2026-03-06$224,900 Active 811-char remark
Show marketing remark (811 chars)
Priced to sell manufactured home and mobile home sitting on 20 acres tucked in the mountains of Twin Oaks! Property features include a stainless stove, ceiling fans, laundry room, water softener system, shared well, with the roof being installed approximately 9 years ago. Expand your living space and relax on the extended covered porch with breathtaking mountain and valley views! Detached over-sized shop has power and water at the exterior, perfect for storing vehicles, ATVs, tools and more. Extra storage space with three sheds, all with electricity, one can be used as a bonus room, equipped with a ceiling fan. Great opportunity to own two structures on one parcel in a private gated community. Located just off of the paved road for easy travels. Cash offers preferred. Call today for more information!
-
2026-02-17$215,000 Active
-
2004-02-02soldstatus $450,000
ⓘ Source: listings_history table (triggers on properties + properties_extension) + one-shot
backfill from property_details.listing_events for pre-trigger history.
Tax reassessment forecast CA · Resets to sale price
- Current annual tax
- $1,788 · $149/mo
- Projected year-2 tax
- $1,788 · $149/mo
- Expected delta
- $0/yr ($0/mo · 0.0%)
ⓘ Screening estimate from a state-policy table — verify with the county assessor before closing.
Climate risk First Street
- Flood 1/10 Low FEMA zone X (unshaded) · 0% chance over 30 yrs
- Wildfire 8/10 Severe
- Heat 5/10 Major 7 d/yr ≥95°F today · 16 d/yr by 30 yrs out
- Wind 1/10 Low
- Air quality 10/10 Extreme 22 unhealthy d/yr today · 30 by 30 yrs out
Nearby sold comps map
Loading sold comps map…
Walkable amenities ~0.75 mi
Loading nearby amenities…
Taxation est. · year 1
- Rental income
- $14,984
- − Mortgage interest
- −$10,727
- − Property taxes
- −$1,788
- − Insurance
- −$958
- − Repairs & maintenance
- −$1,199
- − Management
- −$1,199
- − Depreciation
- −$5,571
- Taxable loss
- −$6,457
- Est. tax savings @ 24.0%
- +$1,550
- After-tax cash flow
- $-1,409/yr
For passive investors: Depreciation is non-cash, so a rental often shows a tax loss while cash-flowing — sheltering income. Rental losses are passive: they offset passive income freely, and up to $25,000/yr can offset ordinary (W-2) income if you actively participate and your MAGI is under $100k (phasing out to $0 by $150k); unused losses carry forward. On sale, claimed depreciation is recaptured at up to 25%, and gains may owe capital-gains tax (a 1031 exchange can defer both). Figures are a year-1 estimate at your 24.0% rate — not tax advice; consult a CPA.
Schools (NCES district)
- District
- Kern High
- NCES district ID
- 0619540
- Math proficiency
- 21% ▬ 0.00%
- Reading proficiency
- 51% ▲ 2.00%
- Median HH income
- $49,686
- Composite
- 33.68/100
- National rank
- #10443
- State rank
- #860 of 1400 in CA
Livability — Caliente
No livability data for this city. (Only ~50 U.S. cities are tracked.)
Census & demographics
- Population (ZIP)
- 1,115
Population outlook (Kern County) Hauer SSP2
- Today (2025)
- 947,286 people
- By 2030
- 978,984 · +3.3%
- By 2040
- 1,045,018 · +10.3%
- By 2050
- 1,105,232 · +16.7%
- By 2075
- 1,229,538 · +29.8%
- By 2100
- 1,238,059 · +30.7%
Race, ethnicity, and origin ACS 2023
- Neighborhood character
- Predominantly White (86%)
- Race & ethnicity
- White 86% Two or more races 12% Hispanic / Latino 11%
- Hispanic origin (detail)
- Mexican 2% Cuban 3% Dominican 3%
- Common ancestry
- Lithuanian 5% Slovak 4% Serbian 2%
- Foreign-born
- 6% · Canada, South Korea
- Languages at home
- 90% English-only · Spanish 10%
Political lean MEDSL · Kern
- 2024 margin
- Strong R (+21.1) · D 38.2% · R 59.3% · Other 2.5%
- 2008→2024 swing
- -3.3pp toward R · 2008: -17.8pp · 2024: -21.1pp
- All cycles
- 2024: R+21.1 2020: R+10.2 2016: R+15.0 2012: R+20.9 2008: R+17.8
Not yet ingested
- Civics
- —
Market trends
- HPI YoY
- ▲ 2.08%
- Current HPI
- 353.7648
- Rent YoY
- —
- Metro
- —
- State GDP YoY
- ▲ 3.21%
- F500 in state
- 116
Industry mix (Fortune 500 HQ in CA)
| Industry | F500 HQs | Revenue |
|---|---|---|
| Technology | 27 | $1,492B |
|
||
| Financial Services | 3 | $174B |
|
||
| Retail | 3 | $44B |
|
||
| Insurance | 3 | $26B |
|
||
| Media / Entertainment | 2 | $115B |
|
||
| Pharmaceuticals / Biotech | 2 | $62B |
|
||
Price history
-50.0% since first listed3 events — show timeline
- 2026-03-06 Listed $224,900 TAAR
- 2026-02-17 Listed $215,000 GEMLS
- 2004-02-02 Sold (Public Records) $450,000 Public Records
Property tax history
+4.0%/yrLatest (2025): $1,788 · +2.0% YoY. Source: county tax records.
Cash-flow waterfall
monthlySold comps — $/sqft
last 12 mo · ≤1 miLoading sold comps…