 Duplex
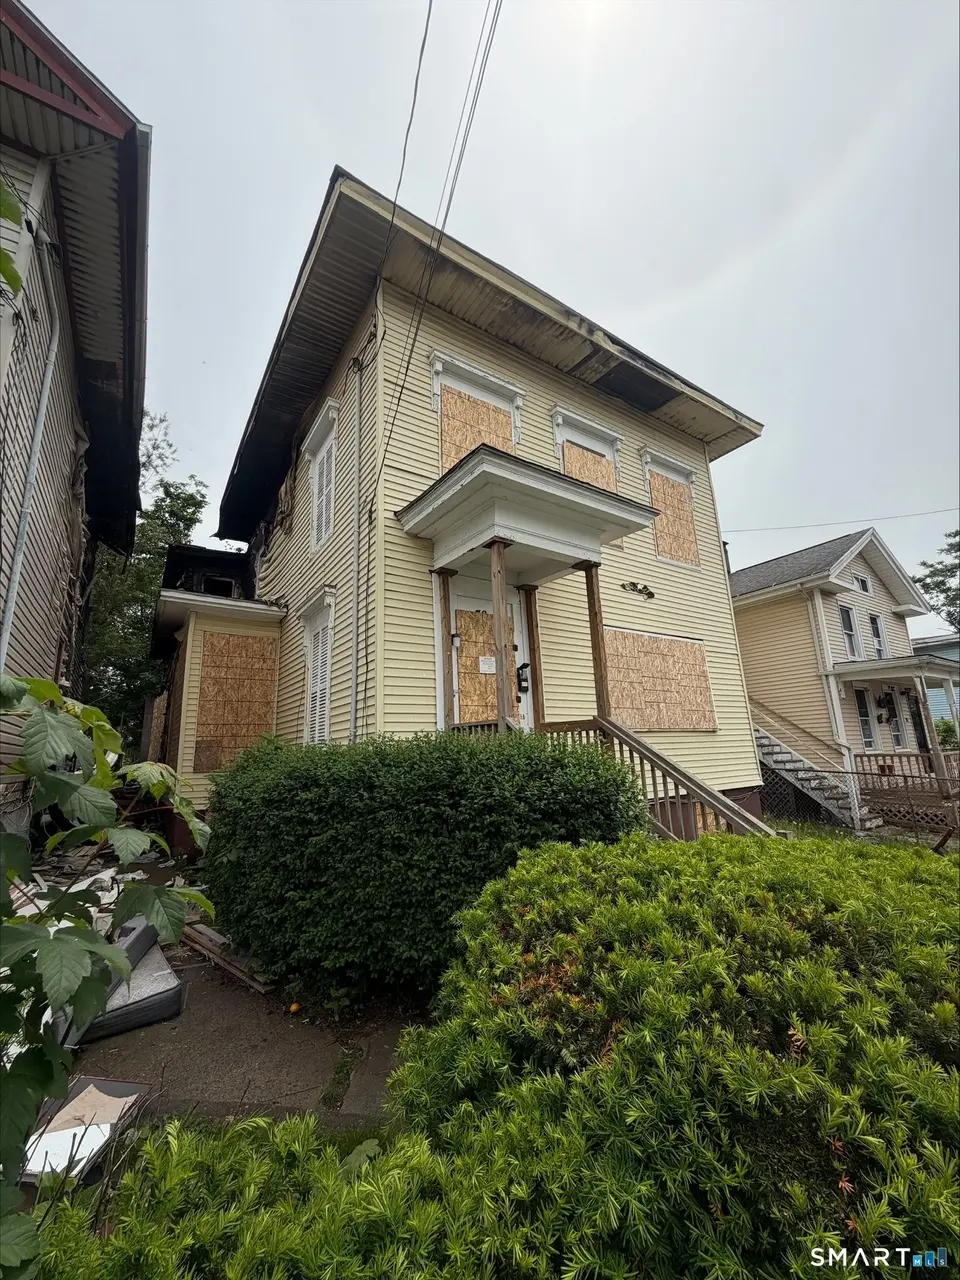
78 Pierpont St · New Haven, CT
Flood risk 1/10 · Minimal
- FEMA flood zone
- X (unshaded)
- Chance of flooding over 30 yrs
- 0.0%
- Est. flood insurance / yr
- $473 – $860
Fire risk 1/10 · Minimal
- Est. fire insurance / yr
- $829 – $1,539
Heat risk 7/10 · Major
- Hot days now (above 99°F)
- 7 days/yr
- Hot days in 30 yrs
- 16 days/yr
Wind risk 6/10 · Moderate
- Chance of severe wind over 30 yrs
- 61.0%
Air-quality risk 5/10 · Moderate
- Unhealthy air days now
- 6 days/yr
- Unhealthy air days in 30 yrs
- 8 days/yr
Risk factors via First Street. Map © Google.
Why this score? — see what drove the B+ grade
The composite is a weighted blend of 9 inputs, each scored 0–100. Each bar is that input's sub-score; the figure is the points it added to the 100-point composite (weight × sub-score).
- Cash flow +30.0/30.0
- ARV discount +15.0/15.0
- DSCR +10.0/10.0
- 1% rule +9.2/10.0
- Livability +4.0/5.0
- Rent growth +3.5/5.0
- Condition / age +2.5/5.0
- Schools +1.5/10.0
- Appreciation +0.0/10.0
$299,999
🖨 Deal sheet (PDF) 📄 Offer letter ✓ Due diligence
Multi-family units
County records classify this as Multi-Family (2-4 Unit). Listing-text estimate: 2 units. confirmed
Listing remarks MLS
Discover a fantastic investment opportunity in the heart of New Haven, CT! This property features 2 units with 3 BEDROOMS on each floor, providing ample space for a large family. Each floor also includes a well-appointed bathroom, enhancing convenience for occupants. This home is an ideal choice for those looking to generate additional income, With the potential to rent out one of the units while living in the other, you can effectively create a steady cash flow stream. Whether you're a savvy investor or a homeowner seeking financial flexibility, this property provides a smart solution to help you achieve your goals. Don't miss out on this chance to invest in a property with great potential and make the most of New Haven's vibrant rental market!
Key facts
- Spacious attic
- Two-family property
- 9-foot ceilings
Tags
Property features AI
Exterior
- Utilities: Public water connected; Public sewer connected; Natural gas available in street
- Home design: Multi-family 2-family property
- Construction: Concrete construction; Concrete foundation; Asphalt shingle roof; Built for multi-family use
- Exterior features: Level lot; Vinyl siding
Interior
- Bedrooms: 6 bedrooms
- Bathrooms: 2 full bathrooms
- Heating & cooling: Hot air heating; Wall unit cooling; 40-gallon natural gas hot water tank
- Interior features: 10 total rooms; Full basement; Walk-up attic
Neighborhood map
What this means for you Summary
Snapshot
- This is a 2 × 3-bed/1.0-bath units multifamily listed at $300k.
Deal economics
- At list price, monthly cash flow is $1k ($14k/yr) — positive. Per door: $595/mo.
- The deal already cash-flows at list — no discount required.
- Meets the 1% rule at list price ($4k rent vs $300k).
- Recommended offer: $295k (1.5% below list) — sets the bar for market timing.
- Cap rate 11.1% vs local median 4.8% in New Haven — top-decile yield for the area; either an underpriced asset or a hidden risk that comps aren't pricing in. Stress-test before assuming the spread holds.
Location & tenants
- Location reads 79/100 on livability (#31 in CT, #2,190 nationally) — a middle-class / working-renter tenant base. Strengths: amenities A+, commute A+, health & safety A+; Watch: employment D, crime F.
- New Haven School District (urban): math 12% / reading 25% proficiency, ranked #147 of 153 in CT (top 96%) — low school quality limits family demand, transient renter base, plan for 1-2y turnover; 66% free/reduced lunch — lower-income household profile, screen leases tightly.
- Zoned schools: Betsy Ross Arts Magnet School (math 12% / reading 27%, grade F, #161 of 175 statewide, top 93%, 327 students, 70% FRL) — zoned schools at 70% FRL track the district average.
- Market conditions: Rents rising fast (+4.1%/yr); 102 active listings in the ZIP; 1,059 units permitted in South Central Connecticut Planning Region in 2024 (779 in 5+ unit buildings).
- At $4,249/mo this rent would consume 105% of the median local household income ($48k/yr) (locally 2664% of renters already pay >50% of income on rent) — very limited rent-growth headroom before tenants either downsize or default.
Forward outlook
- Local home prices are declining (-3.0%/yr); year-one equity from $2k of loan paydown is wiped out by about $9k of value loss. Plan a longer hold.
- At projected returns (-3.0% appreciation + 4.1% rent growth), your $84k cash investment doubles in ~7 years — after that, you're playing with house money.
Negotiation context
- It's been on market 25 days — a 2% lower offer ($295k) is reasonable based on typical stale-listing flexibility.
- 11 sale attempts since 26y ago with the ask held roughly flat each time — persistent listings suggest the price (not the market) is what's stuck; bring a comps-based counter.
Risks & watch-outs
- Watch-outs: built in 1900 — expect roof / HVAC / electrical / plumbing capex.
- Climate carrying-cost: major wind risk, 61% chance of damaging wind over 30y; extreme-heat days projected 7→16/yr by 2055 (HVAC capex compounding) — expect insurance premiums to compound above CPI over the hold.
Questions for the listing agent
- Can we see the unit-by-unit rent roll, current vacancy, and any below-market leases? What's the average tenancy length?
- What capital expenditures (roof, boiler, parking lot, exteriors) have been made in the last 5 years, and what's planned in the next 2?
- Built in 1900 — when were the roof, HVAC, electrical panel, plumbing, and water heater last replaced?
- Is there a deadline driving the sale (1031 exchange, divorce, estate, relocation)? That informs how much negotiation room exists.
- Schools are D-rated, which usually means shorter tenancies and higher turnover. Who's the typical renter profile here, and what's been the actual vacancy rate?
- Crime grade is F in this area — have there been break-ins, vandalism, or insurance claims at this property in the last 3 years? What carrier currently insures it and at what premium?
- What's the average days-on-market for RENTAL listings here right now (not sales)? A rising rental-DOM trend means longer vacancies and softer asking-rent achievability than the comps imply.
- What's the recent tenant-quality profile in this submarket — average credit score on applications, eviction rate, late-payment / NSF rate, and stable-employment percentage? A property-management company in the area should have these aggregated.
- How much new apartment / multifamily construction is in the pipeline within 1–3 miles? Heavy new supply (>2% of stock underway) typically softens rents 12–24 months out; light construction supports rent growth.
Investment metrics
- 1% rule
- 1.42% ✓
- Cap rate
- 11.06%
- Cash-on-cash
- 17.01%
- DSCR
- 1.76
- GRM
- 5.9
CMA / ARV
- ARV (on-the-fly)
- $423,770
- Comps found
- 12
Show comp detail 12 sales within ~0.75 mi
| Address | Dist | Beds/Ba | Sqft | Sold | Price | $/sf | Match |
|---|---|---|---|---|---|---|---|
| 39 Houston St | 0.13mi | 8/3.0 | 2,863 (+5%) | 3mo | $500,000 | $175 | 80 |
| 33 Chapel St | 0.16mi | 7/2.0 (-1) | 2,976 (+9%) | 1mo | $480,000 | $161 | 72 |
| 160 Blatchley Ave | 0.28mi | 8/3.0 | 2,819 (+3%) | 8mo | $420,000 | $149 | 71 |
| 117 Lloyd St | 0.35mi | 7/3.0 (-1) | 2,737 (+0%) | 13mo | $400,000 | $146 | 64 |
| 115 Clay St | 0.42mi | 7/3.0 (-1) | 2,850 (+4%) | 5mo | $450,000 | $158 | 60 |
| 45 Haven St | 0.51mi | 9/3.0 (+1) | 2,665 (-2%) | 14mo | $505,000 | $189 | 51 |
| 284 Lombard St | 0.58mi | 8/3.0 | 3,059 (+12%) | 9mo | $400,000 | $131 | 42 |
| 423 Blatchley Ave | 0.58mi | 9/3.0 (+1) | 2,540 (-7%) | 14mo | $370,000 | $146 | 40 |
| 800 Quinnipiac Ave | 0.65mi | 7/3.0 (-1) | 3,126 (+14%) | 0mo | $725,000 | $232 | 37 |
| 193 Farren Ave | 0.51mi | 7/4.5 (-1) | 3,132 (+15%) | 3mo | $485,000 | $155 | 35 |
| 549 Lombard St | 0.68mi | 8/3.0 | 3,135 (+15%) | 6mo | $350,000 | $112 | 34 |
| 252 James St | 0.53mi | 7/3.0 (-1) | 3,071 (+12%) | 18mo | $365,000 | $119 | 31 |
Match score weights: distance 35% · size 25% · config 20% · recency 20%. Top-matched comps best support the ARV.
Projected returns pro-forma
-3.0% appreciation · 4.12% rent growth · sell at horizon
- IRR
- 9.6%
- Equity multiple
- 1.38×
- Total profit
- $32,193
- Equity at exit
- $44,731
- IRR
- 19.7%
- Equity multiple
- 2.74×
- Total profit
- $146,511
- Equity at exit
- $25,938
Cash invested: $84,000 (down + closing). Projections, not guarantees.
Landlord ↔ Tenant lean methodology
- Overall (STATE)
- 27 Tenant-Leaning
- State Connecticut
- 27 Tenant-Leaning · D+7
- County
- — inherits STATE
- City
- — inherits STATE
ZIP-level market 06513
- Home prices YoY
- -7.8%
- Rents YoY
- 4.1%
- Active inventory
- 102
- Price-to-rent
- 11.8×
Monthly cashflow live
- Estimated rent
- $4,249 high interval (Pro) →
- Mortgage (P&I)
- −$1,573
- Tax from tax record
- −$468 /mo · $5,612/yr
- Insurance
- −$125
- HOA
- −$0
- Vacancy / Maint / Mgmt
- −$892
- Net cashflow
- $1,191
Break-even live
Sensitivity live
| Price | -10% $1,361 | -5% $1,276 | +0% $1,191 | +5% $1,106 | +10% $1,021 |
|---|---|---|---|---|---|
| Rent | -10% $855 | -5% $1,023 | +0% $1,191 | +5% $1,359 | +10% $1,526 |
| Rate | -1.0pp $1,342 | -0.5pp $1,267 | base $1,191 | +0.5pp $1,113 | +1.0pp $1,034 |
2-unit breakdown (identical units grouped — click to expand)
| Units | Beds | Baths | Est. rent |
|---|---|---|---|
| 2× units | 3 | 1 | $4,250 |
| #1 | 3 | 1 | $2,125 |
| #2 | 3 | 1 | $2,125 |
| Total (2 units) | $4,249 | ||
UW: 25.0% down · 7.5% · 30yr · 1.5% tax · 5.0% vac · 8.0% maint · 8.0% mgmt
Financing live
Cash to close
- Down payment
- $75,000
- Closing costs
- $9,000
- Reserves months
- —
- Total cash needed
- —
Loan-product check · same deal, 3 products live
Conventional
25% down · 7.5% · 30yr
- Down + closing
- —
- Monthly P&I
- —
- Monthly cashflow
- —
- DSCR
- —
- Eligible?
- —
Personal DTI + credit; lowest rate.
DSCR
20% down · 8.5% · 30yr
- Down + closing
- —
- Monthly P&I
- —
- Monthly cashflow
- —
- DSCR
- —
- Eligible?
- —
No personal income docs; deal must DSCR.
Hard money
10% down · 12.0% · 12mo
- Down + closing
- —
- Monthly P&I
- —
- Monthly cashflow
- —
- DSCR
- —
- Eligible?
- —
Short-term bridge; refi at stabilization.
Listing history 44 events
-
2026-06-21days on market $299,999 Active 25 DOM
-
2026-06-18days on market $299,999 Active 22 DOM
-
2026-06-17days on market $299,999 Active 21 DOM
-
2026-06-16days on market $299,999 Active 20 DOM
-
2026-06-15days on market $299,999 Active 19 DOM
-
2026-06-14days on market $299,999 Active 17 DOM
-
2026-06-13days on market $299,999 Active 16 DOM
-
2026-06-10days on market $299,999 Active 14 DOM
-
2026-06-09days on market $299,999 Active 13 DOM
-
2026-06-08days on market $299,999 Active 12 DOM
-
2026-06-07days on market $299,999 Active 11 DOM
-
2026-06-05days on market $299,999 Active 8 DOM
-
2026-06-03days on market $299,999 Active 7 DOM
-
2026-06-03days on market $299,999 Active 6 DOM
-
2026-06-01days on market $299,999 Active 5 DOM
-
2026-05-31days on market $299,999 Active 4 DOM
-
2026-05-27$299,999 Active
-
2024-10-18soldstatus $320,000 Closed 756-char remark
Show marketing remark (756 chars)
Discover a fantastic investment opportunity in the heart of New Haven, CT! This property features 2 units with 3 BEDROOMS on each floor, providing ample space for a large family. Each floor also includes a well-appointed bathroom, enhancing convenience for occupants. This home is an ideal choice for those looking to generate additional income, With the potential to rent out one of the units while living in the other, you can effectively create a steady cash flow stream. Whether you're a savvy investor or a homeowner seeking financial flexibility, this property provides a smart solution to help you achieve your goals. Don't miss out on this chance to invest in a property with great potential and make the most of New Haven's vibrant rental market!
-
2024-08-29status Under Contract 756-char remark
Show marketing remark (756 chars)
Discover a fantastic investment opportunity in the heart of New Haven, CT! This property features 2 units with 3 BEDROOMS on each floor, providing ample space for a large family. Each floor also includes a well-appointed bathroom, enhancing convenience for occupants. This home is an ideal choice for those looking to generate additional income, With the potential to rent out one of the units while living in the other, you can effectively create a steady cash flow stream. Whether you're a savvy investor or a homeowner seeking financial flexibility, this property provides a smart solution to help you achieve your goals. Don't miss out on this chance to invest in a property with great potential and make the most of New Haven's vibrant rental market!
-
2024-08-20historical
-
2024-08-07$319,900 Active 756-char remark
Show marketing remark (756 chars)
Discover a fantastic investment opportunity in the heart of New Haven, CT! This property features 2 units with 3 BEDROOMS on each floor, providing ample space for a large family. Each floor also includes a well-appointed bathroom, enhancing convenience for occupants. This home is an ideal choice for those looking to generate additional income, With the potential to rent out one of the units while living in the other, you can effectively create a steady cash flow stream. Whether you're a savvy investor or a homeowner seeking financial flexibility, this property provides a smart solution to help you achieve your goals. Don't miss out on this chance to invest in a property with great potential and make the most of New Haven's vibrant rental market!
-
2024-08-07$319,900 Active
Show marketing remark (756 chars)
Discover a fantastic investment opportunity in the heart of New Haven, CT! This property features 2 units with 3 BEDROOMS on each floor, providing ample space for a large family. Each floor also includes a well-appointed bathroom, enhancing convenience for occupants. This home is an ideal choice for those looking to generate additional income, With the potential to rent out one of the units while living in the other, you can effectively create a steady cash flow stream. Whether you're a savvy investor or a homeowner seeking financial flexibility, this property provides a smart solution to help you achieve your goals. Don't miss out on this chance to invest in a property with great potential and make the most of New Haven's vibrant rental market!
-
2011-02-24soldstatus $60,000
-
2010-09-17$72,000
-
2010-06-02historical
-
2009-08-30$108,000
-
2008-04-15historical
-
2007-10-15$269,900
-
2006-09-15soldstatus $225,000
-
2006-09-14soldstatus $225,000
-
2006-09-14soldstatus $225,000
-
2006-03-24$225,000
-
2006-02-24$225,000
-
2005-04-04soldstatus $200,000
-
2005-03-31soldstatus $200,000
-
2005-02-18$200,000
-
2004-04-29soldstatus $71,500
-
2004-03-29soldstatus $71,500
-
2004-03-03$79,900
-
2000-10-03soldstatus $105,000
-
2000-07-03soldstatus $30,000
-
2000-06-29soldstatus $30,000
-
2000-04-29$29,900
-
1990-04-12soldstatus $90,000
ⓘ Source: listings_history table (triggers on properties + properties_extension) + one-shot
backfill from property_details.listing_events for pre-trigger history.
Tax reassessment forecast CT · Partial reset (capped growth)
- Current annual tax
- $5,612 · $468/mo
- Projected year-2 tax
- $6,016 · $501/mo
- Expected delta
- +$404/yr (+$34/mo · 7.2%)
ⓘ Screening estimate from a state-policy table — verify with the county assessor before closing.
Climate risk First Street
- Flood 1/10 Low FEMA zone X (unshaded) · 0% chance over 30 yrs
- Wildfire 1/10 Low
- Heat 7/10 Severe 7 d/yr ≥99°F today · 16 d/yr by 30 yrs out
- Wind 6/10 Major 61% chance of damaging wind over 30 yrs
- Air quality 5/10 Major 6 unhealthy d/yr today · 8 by 30 yrs out
Nearby sold comps map
Loading sold comps map…
Walkable amenities ~0.75 mi
Loading nearby amenities…
Taxation est. · year 1
- Rental income
- $50,988
- − Mortgage interest
- −$16,805
- − Property taxes
- −$5,612
- − Insurance
- −$1,500
- − Repairs & maintenance
- −$4,079
- − Management
- −$4,079
- − Depreciation
- −$8,727
- Taxable income
- $10,186
- Est. tax owed @ 24.0%
- −$2,445
- After-tax cash flow
- $11,845/yr
For passive investors: Depreciation is non-cash, so a rental often shows a tax loss while cash-flowing — sheltering income. Rental losses are passive: they offset passive income freely, and up to $25,000/yr can offset ordinary (W-2) income if you actively participate and your MAGI is under $100k (phasing out to $0 by $150k); unused losses carry forward. On sale, claimed depreciation is recaptured at up to 25%, and gains may owe capital-gains tax (a 1031 exchange can defer both). Figures are a year-1 estimate at your 24.0% rate — not tax advice; consult a CPA.
Schools (NCES district)
- District
- New Haven School District
- NCES district ID
- 0902790
- Math proficiency
- 12% ▼ -10.00%
- Reading proficiency
- 25% ▼ -10.00%
- Median HH income
- $38,058
- Composite
- 15.48/100
- National rank
- #9308
- State rank
- #147 of 153 in CT
Livability — New Haven
- Score
- 79/100
- State rank
- #31
- US rank
- #2190
Category grades
Schools grade is shown separately in the Schools card above.
Census & demographics
- Census place
- New Haven, CT
- County
- New Haven County · 688,236 people
- City population
- 132,813
- Metro
- New Haven-Milford, CT
- Population (ZIP)
- 38,888
- Household income
- $48,500
- Rent vs Own
- Severe rent burden
- 2664.0
Population outlook (South Central Connecticut County) Hauer SSP2
- By 2040
- 608,362
Race, ethnicity, and origin ACS 2023
- Neighborhood character
- Diverse neighborhood (Simpson 0.66)
- Race & ethnicity
- Hispanic / Latino 47% White 26% Black 22% Two or more races 12% Asian 1%
- Hispanic origin (detail)
- Mexican 7% Puerto Rican 25% Dominican 2%
- Common ancestry
- Romanian 2% Lithuanian 1% Slovak 1%
- Foreign-born
- 17% · Canada, Jamaica, South Korea
- Languages at home
- 56% English-only · Spanish 39% Other Indo-European 1% Russian/Polish/Slavic 1%
Political lean MEDSL · South Central Connecticut
- 2024 margin
- Strong D (+20.1) · D 59.0% · R 38.9% · Other 2.1%
- All cycles
- 2024: D+20.1
Not yet ingested
- Civics
- —
Market trends
- HPI YoY
- ▼ -30.87%
- Current HPI
- 364.006
- Rent YoY
- ▲ 4.12%
- Metro
- New Haven-Milford, CT
- State GDP YoY
- ▲ 1.06%
- F500 in state
- 38
Industry mix (Fortune 500 HQ in CT)
| Industry | F500 HQs | Revenue |
|---|---|---|
| Industrial Machinery | 4 | $38B |
|
||
| Insurance | 3 | $71B |
|
||
| Financial Services | 2 | $25B |
|
||
| Transportation / Logistics | 2 | $18B |
|
||
| Healthcare | 1 | $247B |
|
||
| Telecommunications | 1 | $55B |
|
||
Price history
+233.3% since first listed28 events — show timeline
- 2026-05-27 Listed $299,999 Smart MLS
- 2024-10-18 Sold (MLS) $320,000 Smart MLS
- 2024-08-29 Pending — Smart MLS
- 2024-08-20 Listing Removed — Smart MLS
- 2024-08-07 Listed $319,900 Smart MLS
- 2024-08-07 Listed $319,900 Smart MLS
- 2011-02-24 Sold (MLS) $60,000 Smart MLS
- 2010-09-17 Listed $72,000 Smart MLS
- 2010-06-02 Listing Removed — Smart MLS
- 2009-08-30 Listed $108,000 Smart MLS
- 2008-04-15 Listing Removed — Smart MLS
- 2007-10-15 Listed $269,900 Smart MLS
- 2006-09-15 Sold (Public Records) $225,000 Public Records
- 2006-09-14 Sold (MLS) $225,000 Smart MLS
- 2006-09-14 Sold (MLS) $225,000 Smart MLS
- 2006-03-24 Listed $225,000 Smart MLS
- 2006-02-24 Listed $225,000 Smart MLS
- 2005-04-04 Sold (Public Records) $200,000 Public Records
- 2005-03-31 Sold (MLS) $200,000 Smart MLS
- 2005-02-18 Listed $200,000 Smart MLS
- 2004-04-29 Sold (Public Records) $71,500 Public Records
- 2004-03-29 Sold (MLS) $71,500 Smart MLS
- 2004-03-03 Listed $79,900 Smart MLS
- 2000-10-03 Sold (Public Records) $105,000 Public Records
- 2000-07-03 Sold (Public Records) $30,000 Public Records
- 2000-06-29 Sold (MLS) $30,000 Smart MLS
- 2000-04-29 Listed $29,900 Smart MLS
- 1990-04-12 Sold (Public Records) $90,000 Public Records
Property tax history
+11.9%/yrLatest (2023): $5,612 · -6.4% YoY. Source: county tax records.
Cash-flow waterfall
monthlySold comps — $/sqft
last 12 mo · ≤1 miLoading sold comps…