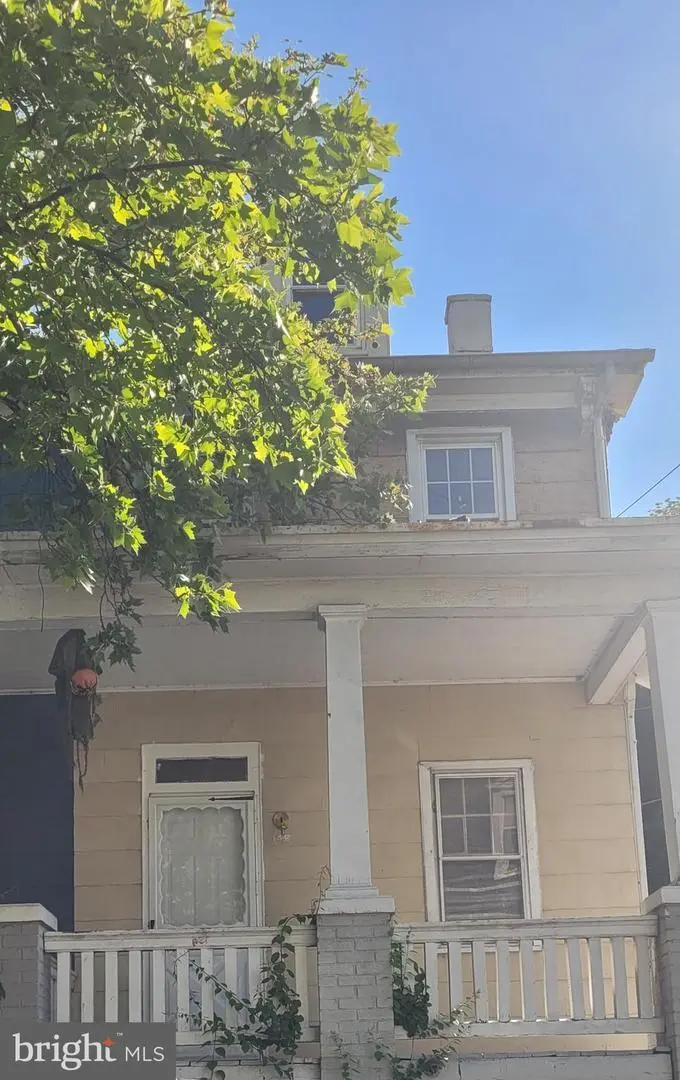
351 S 2nd St · Steelton, PA
Flood risk 6/10 · Moderate
- FEMA flood zone
- X (unshaded)
- Chance of flooding over 30 yrs
- 0.73%
- Est. flood insurance / yr
- $473 – $860
Fire risk 1/10 · Minimal
- Est. fire insurance / yr
- $511 – $949
Heat risk 5/10 · Moderate
- Hot days now (above 101°F)
- 7 days/yr
- Hot days in 30 yrs
- 16 days/yr
Wind risk 3/10 · Minor
- Chance of severe wind over 30 yrs
- 5.0%
Air-quality risk 3/10 · Minor
- Unhealthy air days now
- 3 days/yr
- Unhealthy air days in 30 yrs
- 5 days/yr
Risk factors via First Street. Map © Google.
Why this score? — see what drove the D+ grade
The composite is a weighted blend of 9 inputs, each scored 0–100. Each bar is that input's sub-score; the figure is the points it added to the 100-point composite (weight × sub-score).
- Cash flow +19.8/30.0
- ARV discount +6.7/15.0
- DSCR +6.3/10.0
- 1% rule +5.2/10.0
- Livability +3.4/5.0
- Rent growth +2.5/5.0
- Condition / age +2.5/5.0
- Schools +0.5/10.0
- Appreciation +0.0/10.0
$137,000
🖨 Deal sheet 📄 Offer letter ✓ Due diligence
Listing remarks
Great investment property! SOLD AS IS Outside of the house has been repainted. Some upgrades have been made, updated kitchen and floors Large Corner lot with fenced in yard. Lots of opportunities. Great investment property.
Key facts
- Built 1900
- Listed 24 days
Property features AI
Finance
- Other: Full poured concrete basement with interior access; Above-grade finished area approximately 1,356 (source: assessor); Property assessed values available (land and improvement)
Exterior
- Parking: On-street parking
- Utilities: Public water; Public sewer
- Home design: Semi-detached; Fee simple ownership
- Construction: Frame construction; Block foundation; Asbestos shingle roof
- Exterior features: Not in a federal flood zone
Interior
- Kitchen: Stove
- Bedrooms: Three bedrooms on the first upper level; One bedroom on the second upper level
- Flooring: Luxury vinyl plank flooring
- Bathrooms: One full bathroom (all upper levels)
- Heating & cooling: Forced air heating; Natural gas heating fuel
- Interior features: Eat-in kitchen; Traditional floor plan; Drywall walls and ceilings
Neighborhood map
What this means for you Summary
Snapshot
- This is a 3-bed/1.0-bath townhouse listed at $137k.
Deal economics
- At list price, monthly cash flow is $163 ($2k/yr) — positive.
- The deal already cash-flows at list — no discount required.
- Meets the 1% rule at list price ($1k rent vs $137k).
- Recommended offer: $135k (1.5% below list) — sets the bar for market timing.
Location & tenants
- Location reads 67/100 on livability (#971 in PA) — a middle-class / working-renter tenant base. Strengths: cost of living A+, housing A+, health & safety A+; Watch: employment C-, crime F, amenities F.
- Steelton-Highspire SD (suburban): math 2% / reading 9% proficiency, ranked #538 of 539 in PA (top 100%) — low school quality limits family demand, transient renter base, plan for 1-2y turnover; 68% free/reduced lunch — lower-income household profile, screen leases tightly.
- Zoned schools: Steelton-Highspire Hs (math 2% / reading 6%, grade F, #434 of 437 statewide, top 99%, 599 students, 100% FRL) — zoned schools average 100% FRL vs 68% district-wide (32 pts higher); higher-poverty schools than district average — tighter screening recommended.
- Market conditions: 68 active listings in the ZIP; 11 comparable units currently listed for rent nearby; rentals at typical pace (median 14d on market — plan ~3-4 weeks tenant-placement turnaround); 540 units permitted in Dauphin County in 2024 (194 in 5+ unit buildings).
Forward outlook
- Local home prices are declining (-3.0%/yr); year-one equity from $947 of loan paydown is wiped out by about $4k of value loss. Plan a longer hold.
Negotiation context
- It's been on market 24 days — a 2% lower offer ($135k) is reasonable based on typical stale-listing flexibility.
Risks & watch-outs
- Watch-outs: built in 1900 — expect roof / HVAC / electrical / plumbing capex.
- Climate carrying-cost: major flood risk; extreme-heat days projected 7→16/yr by 2055 (HVAC capex compounding) — expect insurance premiums to compound above CPI over the hold.
Questions for the listing agent
- Built in 1900 — when were the roof, HVAC, electrical panel, plumbing, and water heater last replaced?
- Is there a deadline driving the sale (1031 exchange, divorce, estate, relocation)? That informs how much negotiation room exists.
- Schools are F-rated, which usually means shorter tenancies and higher turnover. Who's the typical renter profile here, and what's been the actual vacancy rate?
- Crime grade is F in this area — have there been break-ins, vandalism, or insurance claims at this property in the last 3 years? What carrier currently insures it and at what premium?
- The area grade is low — what's the realistic commute time and amenity access for the typical tenant pool here? Any planned neighborhood developments (good or bad) we should know about?
- What's the average days-on-market for RENTAL listings here right now (not sales)? A rising rental-DOM trend means longer vacancies and softer asking-rent achievability than the comps imply.
- What's the recent tenant-quality profile in this submarket — average credit score on applications, eviction rate, late-payment / NSF rate, and stable-employment percentage? A property-management company in the area should have these aggregated.
- How much new for-sale + rental construction is in the pipeline within 1–3 miles? Heavy new supply typically softens prices + rents 12–24 months out; constrained supply supports both.
Investment metrics
- 1% rule
- 1.02% ✓
- Cap rate
- 7.72%
- Cash-on-cash
- 5.11%
- DSCR
- 1.23
- GRM
- 8.2
CMA / ARV
- ARV (on-the-fly)
- $134,606
- Comps found
- 12
Show comp detail 12 sales within ~0.75 mi
| Address | Dist | Beds/Ba | Sqft | Sold | Price | $/sf | Match |
|---|---|---|---|---|---|---|---|
| 544 Spruce St | 0.34mi | 3/1.0 | 1,260 (+0%) | 1mo | $120,000 | $95 | 84 |
| 337 S 3rd St | 0.04mi | 4/1.0 (+1) | 1,353 (+8%) | 3mo | $165,000 | $122 | 78 |
| 644 S 2nd St | 0.38mi | 3/1.0 | 1,290 (+2%) | 1mo | $152,000 | $118 | 77 |
| 535 Saint Marys Dr | 0.29mi | 3/— | 1,320 (+5%) | 2mo | $130,000 | $98 | 77 |
| 533 Saint Marys Dr | 0.28mi | 3/1.0 | 1,369 (+9%) | 1mo | $140,000 | $102 | 71 |
| 713 S Front St | 0.45mi | 3/1.0 | 1,296 (+3%) | 7mo | $113,500 | $88 | 69 |
| 335 Poplar St | 0.44mi | 3/1.0 | 1,347 (+7%) | 1mo | $110,500 | $82 | 67 |
| 554 S 2nd St | 0.27mi | 3/1.0 | 1,086 (-14%) | 7mo | $125,000 | $115 | 59 |
| 334 Swatara St | 0.27mi | 3/1.0 | 1,076 (-14%) | 6mo | $115,000 | $107 | 58 |
| 337 Swatara St | 0.30mi | 4/1.0 (+1) | 1,425 (+13%) | 3mo | $171,000 | $120 | 57 |
| 23 S 2nd St | 0.39mi | 3/1.0 | 1,418 (+13%) | 7mo | $99,000 | $70 | 55 |
| 617 Monroe St | 0.62mi | 4/1.5 (+1) | 1,099 (-13%) | 0mo | $185,000 | $168 | 43 |
Match score weights: distance 35% · size 25% · config 20% · recency 20%. Top-matched comps best support the ARV.
Projected returns pro-forma
-3.0% appreciation · 3.0% rent growth · sell at horizon
- IRR
- -8.3%
- Equity multiple
- 0.69×
- Total profit
- $-11,771
- Equity at exit
- $20,427
- IRR
- 1.2%
- Equity multiple
- 1.08×
- Total profit
- $3,225
- Equity at exit
- $11,845
Cash invested: $38,360 (down + closing). Projections, not guarantees.
Landlord ↔ Tenant lean methodology
- Overall (STATE)
- 62 Landlord-Friendly
- State Pennsylvania
- 62 Landlord-Friendly · EVEN
- County
- — inherits STATE
- City
- — inherits STATE
ZIP-level market 17113
- Home prices YoY
- -16.3%
- Active inventory
- 68
- Price-to-rent
- 8.2×
Monthly cashflow live
- Estimated rent
- $1,396 high interval (Pro) →
- Mortgage (P&I)
- −$718
- Tax from tax record
- −$164 /mo · $1,967/yr
- Insurance
- −$57
- HOA
- −$0
- Vacancy / Maint / Mgmt
- −$293
- Net cashflow
- $163
Break-even live
UW: 25.0% down · 7.5% · 30yr · 1.5% tax · 5.0% vac · 8.0% maint · 8.0% mgmt
Financing live
Cash to close
- Down payment
- $34,250
- Closing costs
- $4,110
- Reserves months
- —
- Total cash needed
- —
Loan-product check · same deal, 3 products live
Conventional
25% down · 7.5% · 30yr
- Down + closing
- —
- Monthly P&I
- —
- Monthly cashflow
- —
- DSCR
- —
- Eligible?
- —
Personal DTI + credit; lowest rate.
DSCR
20% down · 8.5% · 30yr
- Down + closing
- —
- Monthly P&I
- —
- Monthly cashflow
- —
- DSCR
- —
- Eligible?
- —
No personal income docs; deal must DSCR.
Hard money
10% down · 12.0% · 12mo
- Down + closing
- —
- Monthly P&I
- —
- Monthly cashflow
- —
- DSCR
- —
- Eligible?
- —
Short-term bridge; refi at stabilization.
Rent comps 11 comps
| Address | Beds | Baths | Sqft | Rent | $/sqft | DOM | Units | Dist |
|---|---|---|---|---|---|---|---|---|
| 25 Chestnut St Steelton, PA | 3.0 | 1.0 | 1146 | $1,250 | $1.09 | 14d | 1 | 0.14mi |
| 640 S 2nd St Steelton, PA | 3.0 | 1.5 | 1290 | $1,400 | $1.09 | 23d | 1 | 0.35mi |
| 322 Pine St Unit 2 Steelton, PA | 3.0 | 1.0 | 1100 | $995 | $0.90 | 43d | 1 | 0.53mi |
| 316 N 2nd St Steelton, PA | 3.0 | 1.5 | 1524 | $1,600 | $1.05 | 14d | 1 | 0.75mi |
| 314 Lincoln St Steelton, PA | 3.0 | 1.0 | 1264 | $1,595 | $1.26 | 14d | 1 | 0.76mi |
| 325 Lincoln St Steelton, PA | 3.0 | 1.0 | 1186 | $1,250 | $1.05 | 14d | 1 | 0.78mi |
| 971 Monroe St Harrisburg, PA | 2.0 | 1.5 | 1120 | $1,600 | $1.43 | 14d | 1 | 0.86mi |
| 508 N 2nd St Steelton, PA | 3.0 | 1.5 | 1360 | $1,450 | $1.07 | 14d | 1 | 0.89mi |
| 465 Sunday Dr Harrisburg, PA | 3.0 | 2.5 | 1540 | $1,895 | $1.23 | 14d | 1 | 0.92mi |
| 589 Yale St Harrisburg, PA | 2.0 | 2.0 | 911 | $1,549 | $1.70 | 14d | 1 | 1.15mi |
| 110 Ross Ave New Cumberland, PA | 2.0 | 1.5 | 1194 | $1,650 | $1.38 | 43d | 1 | 1.36mi |
Listing history 17 events
-
2026-06-18days on market $137,000 Active 24 DOM
-
2026-06-17days on market $137,000 Active 23 DOM
-
2026-06-16days on market $137,000 Active 22 DOM
-
2026-06-15days on market $137,000 Active 21 DOM
-
2026-06-14days on market $137,000 Active 19 DOM
-
2026-06-10days on market $137,000 Active 16 DOM
-
2026-06-09days on market $137,000 Active 15 DOM
-
2026-06-09remarks 226-char remark
-
2026-06-08days on market $137,000 Active 14 DOM
-
2026-06-07days on market $137,000 Active 13 DOM
-
2026-06-05days on market $137,000 Active 10 DOM
-
2026-06-03days on market $137,000 Active 9 DOM
-
2026-06-02days on market $137,000 Active 8 DOM
-
2026-06-01days on market $137,000 Active 7 DOM
-
2026-05-31days on market $137,000 Active 6 DOM
-
2026-05-31days on market $137,000 Active 5 DOM
-
2026-05-18historical $137,000
ⓘ Source: listings_history table (triggers on properties + properties_extension) + one-shot
backfill from property_details.listing_events for pre-trigger history.
Tax reassessment forecast PA · Partial reset (capped growth)
- Current annual tax
- $1,967 · $164/mo
- Projected year-2 tax
- $2,066 · $172/mo
- Expected delta
- +$99/yr (+$8/mo · 5.0%)
ⓘ Screening estimate from a state-policy table — verify with the county assessor before closing.
Climate risk First Street
- Flood 6/10 Major FEMA zone X (unshaded) · 73% chance over 30 yrs
- Wildfire 1/10 Low
- Heat 5/10 Major 7 d/yr ≥101°F today · 16 d/yr by 30 yrs out
- Wind 3/10 Moderate 5% chance of damaging wind over 30 yrs
- Air quality 3/10 Moderate 3 unhealthy d/yr today · 5 by 30 yrs out
Nearby sold comps map
Loading sold comps map…
Walkable amenities ~0.75 mi
Loading nearby amenities…
Taxation est. · year 1
- Rental income
- $16,753
- − Mortgage interest
- −$7,674
- − Property taxes
- −$1,967
- − Insurance
- −$685
- − Repairs & maintenance
- −$1,340
- − Management
- −$1,340
- − Depreciation
- −$3,985
- Taxable loss
- −$239
- Est. tax savings @ 24.0%
- +$57
- After-tax cash flow
- $2,019/yr
For passive investors: Depreciation is non-cash, so a rental often shows a tax loss while cash-flowing — sheltering income. Rental losses are passive: they offset passive income freely, and up to $25,000/yr can offset ordinary (W-2) income if you actively participate and your MAGI is under $100k (phasing out to $0 by $150k); unused losses carry forward. On sale, claimed depreciation is recaptured at up to 25%, and gains may owe capital-gains tax (a 1031 exchange can defer both). Figures are a year-1 estimate at your 24.0% rate — not tax advice; consult a CPA.
Schools (NCES district)
- District
- Steelton-Highspire SD
- NCES district ID
- 4222800
- Math proficiency
- 2% ▼ -4.00%
- Reading proficiency
- 9% ▼ -12.00%
- Median HH income
- $40,685
- Composite
- 4.98/100
- National rank
- #10040
- State rank
- #538 of 539 in PA
Livability — Steelton
- Score
- 67/100
- State rank
- #971
- US rank
- #10606
Category grades
Schools grade is shown separately in the Schools card above.
Census & demographics
- Census place
- Steelton, PA
- County
- Dauphin County · 247,857 people
- City population
- 19,401
- Metro
- Harrisburg-Carlisle, PA
- Population (ZIP)
- 11,724
- Household income
- $68,244
- Rent vs Own
- Severe rent burden
- 338.0
Population outlook (Dauphin County) Hauer SSP2
- Today (2025)
- 281,628 people
- By 2030
- 283,549 · +0.7%
- By 2040
- 285,385 · +1.3%
- By 2050
- 286,188 · +1.6%
- By 2075
- 291,053 · +3.3%
- By 2100
- 282,374 · +0.3%
Race, ethnicity, and origin ACS 2023
- Neighborhood character
- Diverse neighborhood (Simpson 0.67)
- Race & ethnicity
- White 48% Hispanic / Latino 24% Black 22% Two or more races 19% Native American 2% Asian 2%
- Hispanic origin (detail)
- Mexican 7% Puerto Rican 11% Cuban 2%
- Common ancestry
- Romanian 1% Lithuanian 1% Iranian 1%
- Foreign-born
- 7% · Canada, India
- Languages at home
- 80% English-only · Spanish 17% Other Indo-European 1% Russian/Polish/Slavic 1%
Political lean MEDSL · Dauphin
- 2024 margin
- Lean D (+5.9) · D 52.4% · R 46.5% · Other 1.1%
- 2008→2024 swing
- -3.1pp toward R · 2008: 9.1pp · 2024: 5.9pp
- All cycles
- 2024: D+5.9 2020: D+8.5 2016: D+2.8 2012: D+6.0 2008: D+9.1
Not yet ingested
- Civics
- —
Market trends
- HPI YoY
- ▼ -54.73%
- Current HPI
- 281.6906
- Rent YoY
- —
- Metro
- Harrisburg-Carlisle, PA
- State GDP YoY
- ▲ 1.68%
- F500 in state
- 34
Industry mix (Fortune 500 HQ in PA)
| Industry | F500 HQs | Revenue |
|---|---|---|
| Healthcare | 2 | $309B |
|
||
| Insurance | 2 | $27B |
|
||
| Telecommunications / Media | 1 | $124B |
|
||
| Industrial Distribution | 1 | $22B |
|
||
| Financial Services | 1 | $20B |
|
||
| Chemicals / Materials | 1 | $18B |
|
||
Price history
1 event — show timeline
- 2026-05-18 Coming Soon $137,000 BRIGHT MLS
Property tax history
+1.2%/yrLatest (2026): $1,967 · +7.2% YoY. Source: county tax records.
Cash-flow waterfall
monthlySold comps — $/sqft
last 12 mo · ≤1 miLoading sold comps…