None · Charleston, MS
Flood risk 2/10 · Minimal
- FEMA flood zone
- X (unshaded)
- Chance of flooding over 30 yrs
- 0.09%
- Est. flood insurance / yr
- $507 – $1,088
Fire risk 3/10 · Minor
- Est. fire insurance / yr
- $1,241 – $2,305
Heat risk 7/10 · Major
- Hot days now (above 109°F)
- 7 days/yr
- Hot days in 30 yrs
- 21 days/yr
Wind risk 6/10 · Moderate
- Chance of severe wind over 30 yrs
- 27.0%
Air-quality risk 1/10 · Minimal
- Unhealthy air days now
- 0 days/yr
- Unhealthy air days in 30 yrs
- 0 days/yr
Risk factors via First Street. Map © Google.
Why this score? — see what drove the B grade
The composite is a weighted blend of 9 inputs, each scored 0–100. Each bar is that input's sub-score; the figure is the points it added to the 100-point composite (weight × sub-score).
- Cash flow +30.0/30.0
- 1% rule +10.0/10.0
- DSCR +10.0/10.0
- ARV discount +7.5/15.0
- Appreciation +4.9/10.0
- Livability +3.2/5.0
- Rent growth +2.5/5.0
- Condition / age +2.5/5.0
- Schools +0.4/10.0
$75,000
🖨 Deal sheet 📄 Offer letter ✓ Due diligence
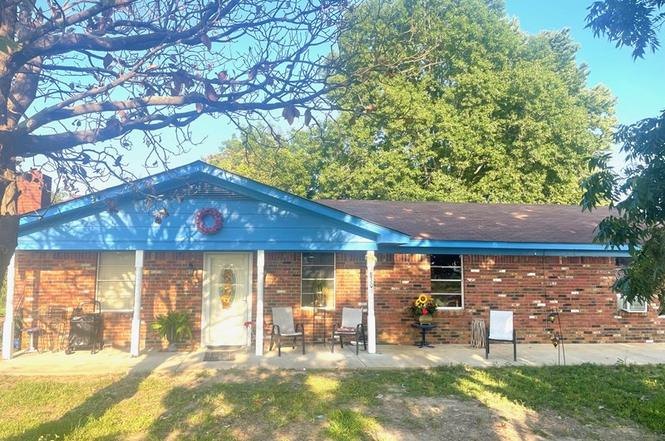
Listing remarks
Check out this fixer upper in Tallahatchie County right off of HWY 35S half way between Charleston and Holcomb. This property has great potential to be a nice family home or rental property with a little elbow grease. Home being sold as is. Give me a call for more info and a private showing.
Key facts
- Built 1967
- Listed 680 days
Tags
Property features AI
Exterior
- Utilities: Septic tank
- Home design: Single-story residential property; No subdivision specified
- Construction: Brick construction; Slab foundation
- Exterior features: Composition roof
Interior
- Kitchen: Electric range; Oven; Refrigerator; Dishwasher not listed
- Flooring: Ceramic tile; Vinyl
- Heating & cooling: Propane heating; Window air conditioning units
- Interior features: Electric range; Oven; Refrigerator; Dryer
- Laundry & utility: Dryer
Neighborhood map
What this means for you Summary
Snapshot
- This is a 4-bed/1.0-bath single-family listed at $75k.
Deal economics
- At list price, monthly cash flow is $433 ($5k/yr) — positive.
- The deal already cash-flows at list — no discount required.
- Meets the 1% rule at list price ($1k rent vs $75k).
- Recommended offer: $66k (12.0% below list) — sets the bar for market timing.
Location & tenants
- Location reads 63/100 on livability (#165 in MS) — a middle-class / working-renter tenant base. Strengths: crime A+, cost of living A+, housing A; Watch: health & safety D+, schools F, amenities F.
- East Tallahatchie Consol School District (town): math 6% / reading 6% proficiency, ranked #127 of 130 in MS (top 98%) — low school quality limits family demand, transient renter base, plan for 1-2y turnover; 84% free/reduced lunch — lower-income household profile, screen leases tightly.
- Market conditions: 3 active listings in the ZIP; 1 units permitted in Tallahatchie County in 2024 (0 in 5+ unit buildings).
Forward outlook
- In year one you build about $356 of equity ($519 loan paydown + $-163 appreciation (-0.2% local appreciation)).
- Tallahatchie County population projected at -19% by 2050 — secular population decline; favor cash flow + early exit over multi-decade hold.
- At projected returns (-0.2% appreciation + 3.0% rent growth), your $21k cash investment doubles in ~4 years — after that, you're playing with house money.
Negotiation context
- It's been on market 681 days — a 12% lower offer ($66k) is reasonable based on typical stale-listing flexibility.
- 2 sale attempts since 2y ago with the ask held roughly flat each time — persistent listings suggest the price (not the market) is what's stuck; bring a comps-based counter.
Risks & watch-outs
- Climate carrying-cost: major wind risk, 27% chance of damaging wind over 30y; extreme-heat days projected 7→21/yr by 2055 (HVAC capex compounding) — expect insurance premiums to compound above CPI over the hold.
Questions for the listing agent
- It's been on market 681 days. Have you received any prior offers? Is the seller open to a 12% concession, seller financing, or rate buy-down credit?
- Built in 1967 — when were the roof, HVAC, electrical panel, plumbing, and water heater last replaced?
- Why hasn't it sold? Are there any deal-killer items the seller is aware of (foundation, flood, title, zoning, code violations)?
- Is there a deadline driving the sale (1031 exchange, divorce, estate, relocation)? That informs how much negotiation room exists.
- Schools are F-rated, which usually means shorter tenancies and higher turnover. Who's the typical renter profile here, and what's been the actual vacancy rate?
- What's the average days-on-market for RENTAL listings here right now (not sales)? A rising rental-DOM trend means longer vacancies and softer asking-rent achievability than the comps imply.
- What's the recent tenant-quality profile in this submarket — average credit score on applications, eviction rate, late-payment / NSF rate, and stable-employment percentage? A property-management company in the area should have these aggregated.
- How much new for-sale + rental construction is in the pipeline within 1–3 miles? Heavy new supply typically softens prices + rents 12–24 months out; constrained supply supports both.
Investment metrics
- 1% rule
- 1.61% ✓
- Cap rate
- 13.22%
- Cash-on-cash
- 24.74%
- DSCR
- 2.10
- GRM
- 5.2
CMA / ARV
No comps found within radius.
Projected returns pro-forma
-0.22% appreciation · 3.0% rent growth · sell at horizon
- IRR
- 24.5%
- Equity multiple
- 2.17×
- Total profit
- $24,633
- Equity at exit
- $20,968
- IRR
- 28.7%
- Equity multiple
- 4.14×
- Total profit
- $66,013
- Equity at exit
- $24,568
Cash invested: $21,000 (down + closing). Projections, not guarantees.
Landlord ↔ Tenant lean methodology
- Overall (STATE)
- 90 Strongly Landlord-Friendly
- State Mississippi
- 90 Strongly Landlord-Friendly · R+11
- County
- — inherits STATE
- City
- — inherits STATE
ZIP-level market 38920
- Home prices YoY
- -0.3%
- Active inventory
- 3
- Price-to-rent
- 5.2×
Monthly cashflow live
- Estimated rent
- $1,204 medium interval (Pro) →
- Mortgage (P&I)
- −$393
- Tax est. 1.5%
- −$94 /mo · $1,125/yr
- Insurance
- −$31
- HOA
- −$0
- Vacancy / Maint / Mgmt
- −$253
- Net cashflow
- $433
Break-even live
UW: 25.0% down · 7.5% · 30yr · 1.5% tax · 5.0% vac · 8.0% maint · 8.0% mgmt
Financing live
Cash to close
- Down payment
- $18,750
- Closing costs
- $2,250
- Reserves months
- —
- Total cash needed
- —
Loan-product check · same deal, 3 products live
Conventional
25% down · 7.5% · 30yr
- Down + closing
- —
- Monthly P&I
- —
- Monthly cashflow
- —
- DSCR
- —
- Eligible?
- —
Personal DTI + credit; lowest rate.
DSCR
20% down · 8.5% · 30yr
- Down + closing
- —
- Monthly P&I
- —
- Monthly cashflow
- —
- DSCR
- —
- Eligible?
- —
No personal income docs; deal must DSCR.
Hard money
10% down · 12.0% · 12mo
- Down + closing
- —
- Monthly P&I
- —
- Monthly cashflow
- —
- DSCR
- —
- Eligible?
- —
Short-term bridge; refi at stabilization.
Listing history 17 events
-
2026-06-18days on market $75,000 Active 681 DOM
-
2026-06-17days on market $75,000 Active 680 DOM
-
2026-06-16days on market $75,000 Active 679 DOM
-
2026-06-15days on market $75,000 Active 678 DOM
-
2026-06-13days on market $75,000 Active 676 DOM
-
2026-06-12days on market $75,000 Active 675 DOM
-
2026-06-09days on market $75,000 Active 672 DOM
-
2026-06-08days on market $75,000 Active 671 DOM
-
2026-06-07days on market $75,000 Active 670 DOM
-
2026-06-05days on market $75,000 Active 668 DOM
-
2026-06-04days on market $75,000 Active 666 DOM
-
2026-06-02days on market $75,000 Active 665 DOM
-
2026-06-01days on market $75,000 Active 664 DOM
-
2026-05-31days on market $75,000 Active 663 DOM
-
2024-10-16historical
-
2024-08-06$75,000 Active
-
2024-08-06$75,000 Active
ⓘ Source: listings_history table (triggers on properties + properties_extension) + one-shot
backfill from property_details.listing_events for pre-trigger history.
Climate risk First Street
- Flood 2/10 Low FEMA zone X (unshaded) · 9% chance over 30 yrs
- Wildfire 3/10 Moderate
- Heat 7/10 Severe 7 d/yr ≥109°F today · 21 d/yr by 30 yrs out
- Wind 6/10 Major 27% chance of damaging wind over 30 yrs
- Air quality 1/10 Low 0 unhealthy d/yr today · 0 by 30 yrs out
Nearby sold comps map
Loading sold comps map…
Walkable amenities ~0.75 mi
Loading nearby amenities…
Taxation est. · year 1
- Rental income
- $14,448
- − Mortgage interest
- −$4,201
- − Property taxes
- −$1,125
- − Insurance
- −$375
- − Repairs & maintenance
- −$1,156
- − Management
- −$1,156
- − Depreciation
- −$2,182
- Taxable income
- $4,254
- Est. tax owed @ 24.0%
- −$1,021
- After-tax cash flow
- $4,174/yr
For passive investors: Depreciation is non-cash, so a rental often shows a tax loss while cash-flowing — sheltering income. Rental losses are passive: they offset passive income freely, and up to $25,000/yr can offset ordinary (W-2) income if you actively participate and your MAGI is under $100k (phasing out to $0 by $150k); unused losses carry forward. On sale, claimed depreciation is recaptured at up to 25%, and gains may owe capital-gains tax (a 1031 exchange can defer both). Figures are a year-1 estimate at your 24.0% rate — not tax advice; consult a CPA.
Schools (NCES district)
- District
- East Tallahatchie Consol School District
- NCES district ID
- 2801410
- Math proficiency
- 6% ▼ -14.00%
- Reading proficiency
- 6% ▼ -12.00%
- Median HH income
- $30,874
- Composite
- 4.48/100
- National rank
- #10053
- State rank
- #127 of 130 in MS
Livability — Charleston
- Score
- 63/100
- State rank
- #165
- US rank
- #15983
Category grades
Schools grade is shown separately in the Schools card above.
Census & demographics
- Population (ZIP)
- 528
Population outlook (Tallahatchie County) Hauer SSP2
- Today (2025)
- 13,680 people
- By 2030
- 13,261 · -3.1%
- By 2040
- 12,205 · -10.8%
- By 2050
- 11,028 · -19.4%
- By 2075
- 8,367 · -38.8%
- By 2100
- 6,277 · -54.1%
Race, ethnicity, and origin ACS 2023
- Neighborhood character
- Diverse neighborhood (Simpson 0.59)
- Race & ethnicity
- White 52% Black 37% Two or more races 11%
- Common ancestry
- Serbian 7%
Political lean MEDSL · Tallahatchie
- 2024 margin
- Lean D (+5.9) · D 52.5% · R 46.5%
- 2008→2024 swing
- -13.1pp toward R · 2008: 19.0pp · 2024: 5.9pp
- All cycles
- 2024: D+5.9 2020: D+10.8 2016: D+14.9 2012: D+21.3 2008: D+19.0
Not yet ingested
- Civics
- —
Market trends
- HPI YoY
- ▼ -0.22%
- Current HPI
- 61.197
- Rent YoY
- —
- Metro
- —
- State GDP YoY
- —
- F500 in state
- 0
Price history
+0.0% since first listed3 events — show timeline
- 2024-10-16 Listing Removed — MLSU
- 2024-08-06 Listed $75,000 GBOR
- 2024-08-06 Listed $75,000 MLSU
Cash-flow waterfall
monthlySold comps — $/sqft
last 12 mo · ≤1 miLoading sold comps…