 🌊 Lakefront
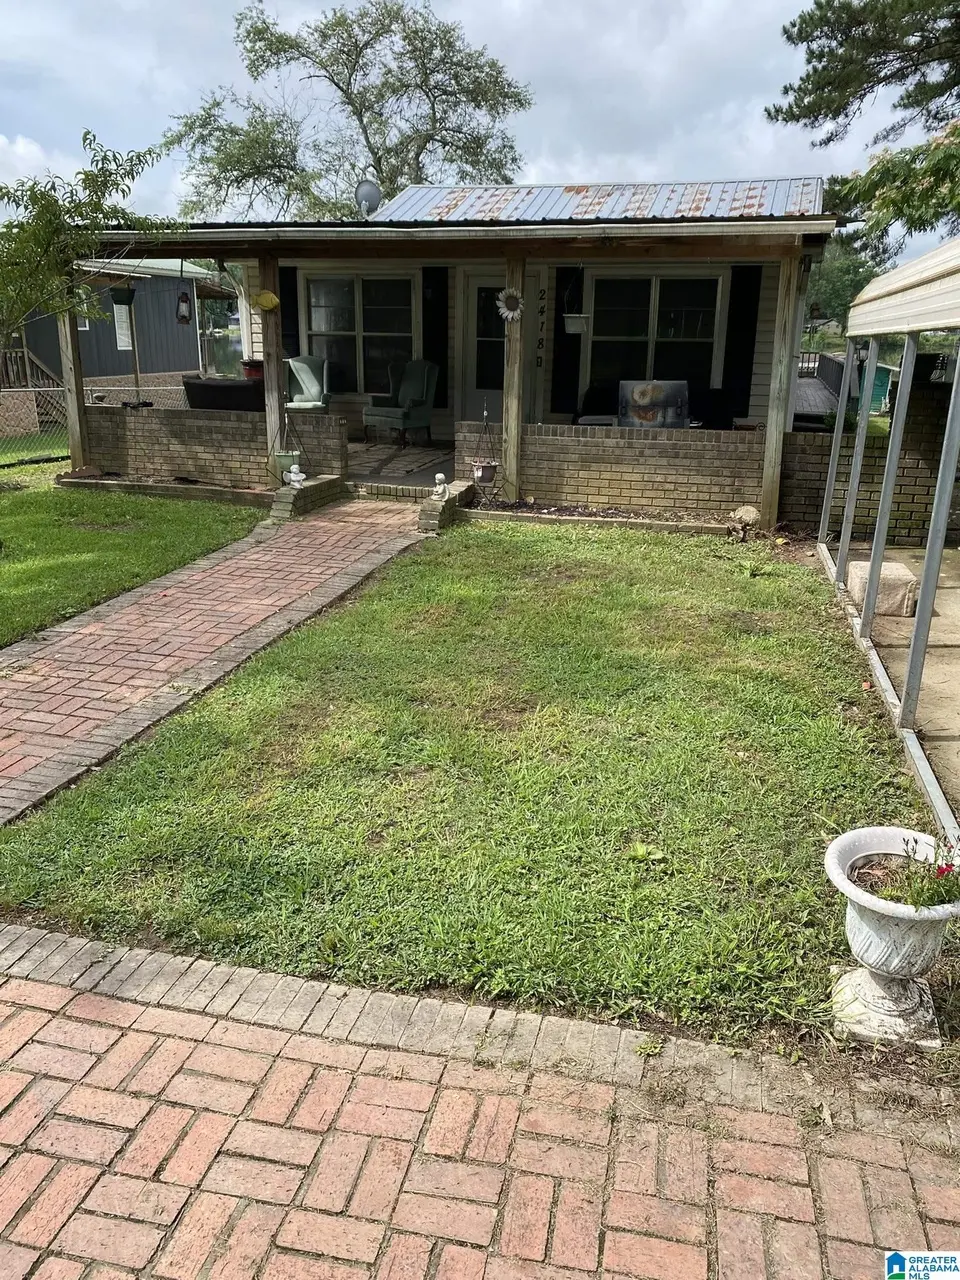
2478 Shore Dr · Ashville, AL
Flood risk 6/10 · Moderate
- FEMA flood zone
- X (unshaded)
- Chance of flooding over 30 yrs
- 0.71%
- Est. flood insurance / yr
- $507 – $1,088
Fire risk 5/10 · Moderate
- Est. fire insurance / yr
- $916 – $1,700
Heat risk 6/10 · Moderate
- Hot days now (above 107°F)
- 7 days/yr
- Hot days in 30 yrs
- 19 days/yr
Wind risk 6/10 · Moderate
- Chance of severe wind over 30 yrs
- 27.0%
Air-quality risk 2/10 · Minimal
- Unhealthy air days now
- 1 days/yr
- Unhealthy air days in 30 yrs
- 3 days/yr
Risk factors via First Street. Map © Google.
Why this score? — see what drove the B grade
The composite is a weighted blend of 9 inputs, each scored 0–100. Each bar is that input's sub-score; the figure is the points it added to the 100-point composite (weight × sub-score).
- Cash flow +30.0/30.0
- ARV discount +15.0/15.0
- DSCR +10.0/10.0
- 1% rule +7.7/10.0
- Schools +3.2/10.0
- Livability +2.9/5.0
- Rent growth +2.5/5.0
- Condition / age +2.5/5.0
- Appreciation +0.0/10.0
$149,900
🖨 Deal sheet (PDF) 📄 Offer letter ✓ Due diligence
Listing remarks
Waterfront! Pier and boat house! Want to play on water right outside your back door? Come check out this fixer upper that has a lot of potential. Home is in need of some new flooring and paint but has bones to be a great get away place for the weekends or live there as the present owners do. Nice pier with covered deck and a boat house for your water toys. Come check out this waterfront home! Close to community boat launch and swimming beach! Must give 24 hour notice to show as it is occupied!
Key facts
- Pier and boat house
- Covered deck
- Swimming beach
Tags
Property features AI
Finance
- Other: Property in Pinedale Shores subdivision
- Financial info: Monthly garbage fee $35; Fire fee included
- HOA & community: Association fee $75 yearly (includes common grounds maintenance)
Exterior
- Parking: Driveway parking; Off-street parking; 2-space carport
- Utilities: Public water; Connected sewer; Spectrum internet service available; Electric water heater
- Home design: Single-family residence (existing); Lake/water view; Waterfront property on Pinedale Shores with approximately 50' frontage; Slab foundation; Vinyl siding
- Construction: Vinyl siding construction; Slab foundation
- Exterior features: Private boat house; Private dock; Fenced yard; Storage building; Porch; Covered and open patio; Covered and open deck; Garden/patio
Interior
- Kitchen: Cooktop (gas); Electric oven; Laminate countertops
- Bedrooms: Master bedroom (main level); Additional bedrooms on main level
- Flooring: Carpet; Subflooring
- Bathrooms: Two full bathrooms; Garden tub, separate shower, and tub/shower combo
- Heating & cooling: Heat pump heating; Propane gas heating available; Heat pump cooling
- Interior features: Handiman special; Ceilings: other (see remarks); Gas fireplace with insert in the living room; One fireplace
- Laundry & utility: Main-level laundry room; Washer hookup; Electric dryer hookup; Electric water heater
Neighborhood map
What this means for you Summary
Snapshot
- This is a 3-bed/2.0-bath single-family listed at $150k.
Deal economics
- At list price, monthly cash flow is $621 ($7k/yr) — positive.
- The deal already cash-flows at list — no discount required.
- Meets the 1% rule at list price ($2k rent vs $150k).
- Recommended offer: $148k (1.5% below list) — sets the bar for market timing.
- Cap rate 11.3% vs local median 3.7% in Ashville — top-decile yield for the area; either an underpriced asset or a hidden risk that comps aren't pricing in. Stress-test before assuming the spread holds.
Location & tenants
- Location reads 57/100 on livability (#385 in AL) — a working-class tenant base; expect higher turnover. Strengths: cost of living A+, housing A+; Watch: employment D, crime F, amenities F.
- St Clair County (rural): math 21% / reading 52% proficiency, ranked #33 of 129 in AL (top 26%) — families likely to look elsewhere, expect single-tenant / working-renter base with shorter leases.
- Zoned schools: Ashville Elementary School (math 27% / reading 57%, grade F, #213 of 627 statewide, top 37%, 506 students, 72% FRL); Ashville Middle School (math 19% / reading 50%, grade F, #90 of 257 statewide, top 38%, 370 students, 77% FRL); Ashville High School (math 27% / reading 27%, grade F, #90 of 305 statewide, top 35%, 385 students, 74% FRL) — zoned schools average 74% FRL vs 41% district-wide (33 pts higher); higher-poverty schools than district average — tighter screening recommended.
- Market conditions: 58 active listings in the ZIP; 1 comparable units currently listed for rent nearby; 557 units permitted in St. Clair County in 2024 (0 in 5+ unit buildings).
Forward outlook
- Local home prices are declining (-3.0%/yr); year-one equity from $1k of loan paydown is wiped out by about $4k of value loss. Plan a longer hold.
- St. Clair County population projected at +11% by 2050 — modest demand growth; plan on rents tracking national, not racing it.
- At projected returns (-3.0% appreciation + 3.0% rent growth), your $42k cash investment doubles in ~7 years — after that, you're playing with house money.
Negotiation context
- It's been on market 20 days — a 2% lower offer ($148k) is reasonable based on typical stale-listing flexibility.
- Current owner paid $74k; list at $150k implies a 103% gain — meaningful room to come down on a strong offer.
Risks & watch-outs
- Watch-outs: built in 1958 — expect roof / HVAC / electrical / plumbing capex.
- Climate carrying-cost: major flood risk; major wind risk, 27% chance of damaging wind over 30y; moderate wildfire risk; extreme-heat days projected 7→19/yr by 2055 (HVAC capex compounding) — expect insurance premiums to compound above CPI over the hold.
Questions for the listing agent
- Built in 1958 — when were the roof, HVAC, electrical panel, plumbing, and water heater last replaced?
- What does the HOA fee cover, when was the last increase, and are there any pending special assessments or reserve-fund shortfalls?
- Is there a deadline driving the sale (1031 exchange, divorce, estate, relocation)? That informs how much negotiation room exists.
- Schools are D-rated, which usually means shorter tenancies and higher turnover. Who's the typical renter profile here, and what's been the actual vacancy rate?
- Crime grade is F in this area — have there been break-ins, vandalism, or insurance claims at this property in the last 3 years? What carrier currently insures it and at what premium?
- This sits on a lake — are riparian / water-frontage rights deeded with the parcel? Any dock permits, shoreline easements, or HOA water-use restrictions?
- What's the documented flood / surge / shoreline-erosion history here (FEMA AND non-FEMA — e.g., storm surge, creek backup, septic-field saturation)?
- Any water-quality or seasonal algae-bloom issues that affect tenant satisfaction or short-term-rental demand?
- What's the average days-on-market for RENTAL listings here right now (not sales)? A rising rental-DOM trend means longer vacancies and softer asking-rent achievability than the comps imply.
- What's the recent tenant-quality profile in this submarket — average credit score on applications, eviction rate, late-payment / NSF rate, and stable-employment percentage? A property-management company in the area should have these aggregated.
- How much new for-sale + rental construction is in the pipeline within 1–3 miles? Heavy new supply typically softens prices + rents 12–24 months out; constrained supply supports both.
Investment metrics
- 1% rule
- 1.27% ✓
- Cap rate
- 11.26%
- Cash-on-cash
- 17.75%
- DSCR
- 1.79
- GRM
- 6.6
CMA / ARV
- ARV (on-the-fly)
- $187,920
- Comps found
- 3
Show comp detail 3 sales within ~0.75 mi
| Address | Dist | Beds/Ba | Sqft | Sold | Price | $/sf | Match |
|---|---|---|---|---|---|---|---|
| 334 Shore Dr | 0.38mi | 3/2.0 | 1,520 (+5%) | 22mo | $146,000 | $96 | 56 |
| 3124 Shore Dr | 0.32mi | 4/2.0 (+1) | 1,300 (-10%) | 23mo | $142,000 | $109 | 44 |
| 3618 Shore Dr | 0.62mi | 3/1.0 | 1,664 (+15%) | 19mo | $123,000 | $74 | 26 |
Match score weights: distance 35% · size 25% · config 20% · recency 20%. Top-matched comps best support the ARV.
Projected returns pro-forma
-3.0% appreciation · 3.0% rent growth · sell at horizon
- IRR
- 9.2%
- Equity multiple
- 1.36×
- Total profit
- $15,179
- Equity at exit
- $22,351
- IRR
- 18.3%
- Equity multiple
- 2.52×
- Total profit
- $63,854
- Equity at exit
- $12,961
Cash invested: $41,972 (down + closing). Projections, not guarantees.
Landlord ↔ Tenant lean methodology
- Overall (STATE)
- 90 Strongly Landlord-Friendly
- State Alabama
- 90 Strongly Landlord-Friendly · R+15
- County
- — inherits STATE
- City
- — inherits STATE
ZIP-level market 35953
- Home prices YoY
- -15.2%
- Active inventory
- 58
- Price-to-rent
- 6.6×
Monthly cashflow live
- Estimated rent
- $1,900 medium interval (Pro) →
- Mortgage (P&I)
- −$786
- Tax from tax record
- −$26 /mo · $308/yr
- Insurance
- −$62
- HOA
- −$6
- Vacancy / Maint / Mgmt
- −$399
- Net cashflow
- $621
Break-even live
Sensitivity live
| Price | -10% $706 | -5% $663 | +0% $621 | +5% $407 | +10% $355 |
|---|---|---|---|---|---|
| Rent | -10% $471 | -5% $546 | +0% $621 | +5% $696 | +10% $771 |
| Rate | -1.0pp $696 | -0.5pp $659 | base $621 | +0.5pp $582 | +1.0pp $542 |
UW: 25.0% down · 7.5% · 30yr · 1.5% tax · 5.0% vac · 8.0% maint · 8.0% mgmt
Financing live
Cash to close
- Down payment
- $37,475
- Closing costs
- $4,497
- Reserves months
- —
- Total cash needed
- —
Loan-product check · same deal, 3 products live
Conventional
25% down · 7.5% · 30yr
- Down + closing
- —
- Monthly P&I
- —
- Monthly cashflow
- —
- DSCR
- —
- Eligible?
- —
Personal DTI + credit; lowest rate.
DSCR
20% down · 8.5% · 30yr
- Down + closing
- —
- Monthly P&I
- —
- Monthly cashflow
- —
- DSCR
- —
- Eligible?
- —
No personal income docs; deal must DSCR.
Hard money
10% down · 12.0% · 12mo
- Down + closing
- —
- Monthly P&I
- —
- Monthly cashflow
- —
- DSCR
- —
- Eligible?
- —
Short-term bridge; refi at stabilization.
Rent comps 1 comps
| Address | Beds | Baths | Sqft | Rent | $/sqft | DOM | Units | Dist |
|---|---|---|---|---|---|---|---|---|
| 4560 Shore Dr Ashville, AL | 2.0 | 1.0 | 1400 | $1,900 | $1.36 | 3d | 1 | 0.69mi |
HOA detail
- Monthly dues
- $6 · $72/yr
- Likely covers
- water
Listing history 13 events
-
2026-06-22days on market $149,900 Active 20 DOM
-
2026-06-18days on market $149,900 Active 17 DOM
-
2026-06-17days on market $149,900 Active 16 DOM
-
2026-06-16days on market $149,900 Active 15 DOM
-
2026-06-15days on market $149,900 Active 14 DOM
-
2026-06-13days on market $149,900 Active 12 DOM
-
2026-06-10days on market $149,900 Active 9 DOM
-
2026-06-09days on market $149,900 Active 8 DOM
-
2026-06-08days on market $149,900 Active 7 DOM
-
2026-06-07days on market $149,900 Active 6 DOM
-
2026-06-03days on market $149,900 Active 2 DOM
-
2026-06-02remarks 498-char remark
-
2026-06-02$149,900 Active 1 DOM
ⓘ Source: listings_history table (triggers on properties + properties_extension) + one-shot
backfill from property_details.listing_events for pre-trigger history.
Tax reassessment forecast AL · Resets to sale price
- Current annual tax
- $308 · $26/mo
- Projected year-2 tax
- $615 · $51/mo
- Expected delta
- +$306/yr (+$26/mo · 99.3%)
ⓘ Screening estimate from a state-policy table — verify with the county assessor before closing.
Climate risk First Street
- Flood 6/10 Major FEMA zone X (unshaded) · 71% chance over 30 yrs
- Wildfire 5/10 Major
- Heat 6/10 Major 7 d/yr ≥107°F today · 19 d/yr by 30 yrs out
- Wind 6/10 Major 27% chance of damaging wind over 30 yrs
- Air quality 2/10 Low 1 unhealthy d/yr today · 3 by 30 yrs out
Nearby sold comps map
Loading sold comps map…
Walkable amenities ~0.75 mi
Loading nearby amenities…
Taxation est. · year 1
- Rental income
- $22,800
- − Mortgage interest
- −$8,397
- − Property taxes
- −$308
- − Insurance
- −$750
- − Repairs & maintenance
- −$1,824
- − Management
- −$1,824
- − HOA
- −$72
- − Depreciation
- −$4,361
- Taxable income
- $5,265
- Est. tax owed @ 24.0%
- −$1,264
- After-tax cash flow
- $6,186/yr
For passive investors: Depreciation is non-cash, so a rental often shows a tax loss while cash-flowing — sheltering income. Rental losses are passive: they offset passive income freely, and up to $25,000/yr can offset ordinary (W-2) income if you actively participate and your MAGI is under $100k (phasing out to $0 by $150k); unused losses carry forward. On sale, claimed depreciation is recaptured at up to 25%, and gains may owe capital-gains tax (a 1031 exchange can defer both). Figures are a year-1 estimate at your 24.0% rate — not tax advice; consult a CPA.
Schools (NCES district)
- District
- St Clair County
- NCES district ID
- 0103062
- Math proficiency
- 21% ▼ -34.00%
- Reading proficiency
- 52% ▬ 0.00%
- Median HH income
- $53,324
- Composite
- 31.79/100
- National rank
- #5887
- State rank
- #33 of 129 in AL
Livability — Ashville
- Score
- 57/100
- State rank
- #385
- US rank
- #21873
Category grades
Schools grade is shown separately in the Schools card above.
Census & demographics
- Population (ZIP)
- 7,020
Population outlook (St. Clair County) Hauer SSP2
- Today (2025)
- 94,158 people
- By 2030
- 97,008 · +3.0%
- By 2040
- 101,615 · +7.9%
- By 2050
- 104,537 · +11.0%
- By 2075
- 109,350 · +16.1%
- By 2100
- 106,785 · +13.4%
Race, ethnicity, and origin ACS 2023
- Neighborhood character
- Predominantly White (88%)
- Race & ethnicity
- White 88% Black 8% Two or more races 2% Hispanic / Latino 2% Native American 1%
- Common ancestry
- Italian 4% Serbian 1% Slovak 1%
- Foreign-born
- 1% · Canada
- Languages at home
- 97% English-only · Spanish 3%
Political lean MEDSL · St. Clair
- 2024 margin
- Solid R (+64.1) · D 17.6% · R 81.7%
- 2008→2024 swing
- -0.9pp no change · 2008: -63.2pp · 2024: -64.1pp
- All cycles
- 2024: R+64.1 2020: R+64.0 2016: R+68.6 2012: R+66.1 2008: R+63.2
Not yet ingested
- Civics
- —
Market trends
- HPI YoY
- ▼ -32.36%
- Current HPI
- 180.043
- Rent YoY
- —
- Metro
- —
- State GDP YoY
- ▲ 2.94%
- F500 in state
- 4
Industry mix (Fortune 500 HQ in AL)
| Industry | F500 HQs | Revenue |
|---|---|---|
| Financial Services | 1 | $8B |
|
||
| Healthcare | 1 | $5B |
|
||
Price history
+102.6% since first listed2 events — show timeline
- 2026-05-31 Listed $149,900 Greater Alabama MLS
- 2018-10-03 Sold (Public Records) $74,000 Public Records
Property tax history
+2.5%/yrLatest (2025): $308 · +2.0% YoY. Source: county tax records.
Cash-flow waterfall
monthlySold comps — $/sqft
last 12 mo · ≤1 miLoading sold comps…