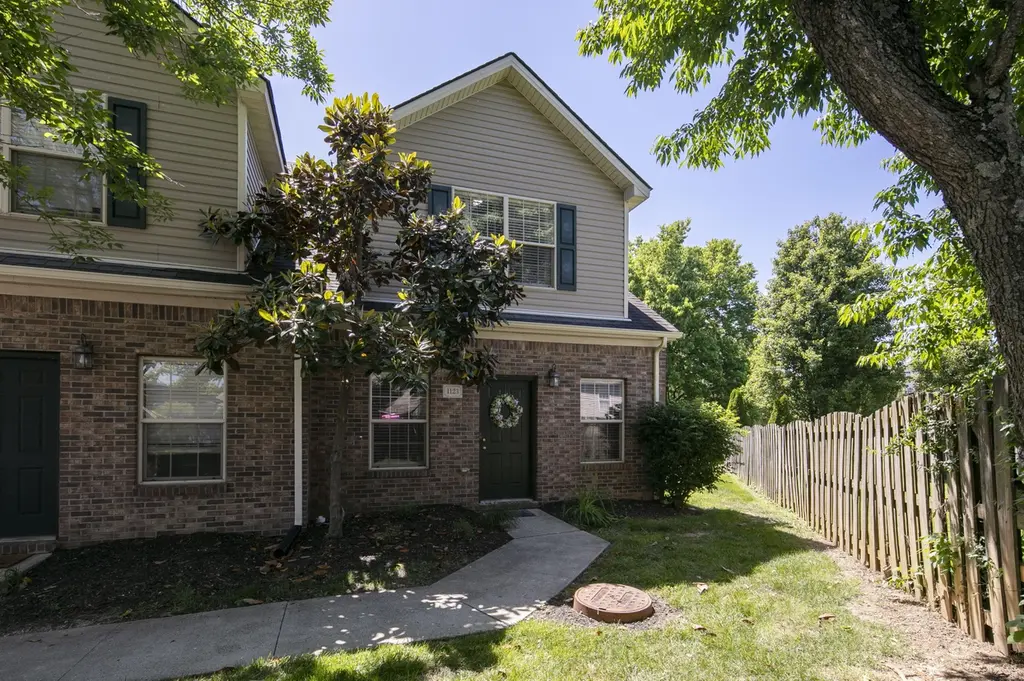
1123 Oatlands Park · Lexington-Fayette, KY
Flood risk 1/10 · Minimal
- FEMA flood zone
- X (unshaded)
- Chance of flooding over 30 yrs
- 0.0%
- Est. flood insurance / yr
- $507 – $1,088
Fire risk 2/10 · Minimal
- Est. fire insurance / yr
- $839 – $1,559
Heat risk 4/10 · Minor
- Hot days now (above 102°F)
- 7 days/yr
- Hot days in 30 yrs
- 19 days/yr
Wind risk 2/10 · Minimal
- Chance of severe wind over 30 yrs
- 3.0%
Air-quality risk 1/10 · Minimal
- Unhealthy air days now
- 0 days/yr
- Unhealthy air days in 30 yrs
- 0 days/yr
Risk factors via First Street. Map © Google.
Why this score? — see what drove the D+ grade
The composite is a weighted blend of 9 inputs, each scored 0–100. Each bar is that input's sub-score; the figure is the points it added to the 100-point composite (weight × sub-score).
- Cash flow +14.5/30.0
- ARV discount +14.1/15.0
- DSCR +4.4/10.0
- 1% rule +3.6/10.0
- Schools +3.4/10.0
- Rent growth +3.1/5.0
- Livability +2.5/5.0
- Condition / age +2.5/5.0
- Appreciation +0.0/10.0
$269,999
🖨 Deal sheet (PDF) 📄 Offer letter ✓ Due diligence
Listing remarks MLS
Location-Location-Location! Spacious and luxurious brick condo/townhome(1951 sq. ft.)Built by David Tipton Homes, located near Hamburg with plenty of shopping and restaurants! 3 oversized bedrooms, 2 baths, 1st. floor master, large kitchen (with all appliances), vaulted and tray ceilings, seperate laundry room, fireplace, ceramic tile, walk-in closets,covered parking space and fenced in back yard! Upgrading is available for this upscale townhome! Get your order in now to pick out floor plans, colors, flooring etc. *Lauren plan $129,900 and Hollywood plan $131,900 (extra 1/2 bath). **This picture is a representation of what the home will look like at completion. Builder will provide a two year comprehensive ten year builders structual warranty.
Key facts
- $100 HOA
- Parking
- Built 2005
Tags
Property features AI
Finance
- HOA & community: Community association with monthly fee
Exterior
- Parking: Detached carport; Off-street parking
- Utilities: Public water; Public sewer; Cable connected; Electricity connected; Sewer connected
- Home design: Two levels; Total building area approximately 1,950
- Construction: Brick veneer and vinyl siding; Shingle roof; Slab foundation
- Exterior features: Wood fencing; Not waterfront; No notable view
Interior
- Kitchen: Dishwasher; Refrigerator; Oven
- Bedrooms: Total rooms: 8
- Flooring: Laminate flooring; Tile flooring
- Bathrooms: 2 full bathrooms
- Heating & cooling: Heat pump for heating and cooling
- Interior features: Eat-in kitchen; Ceiling fans; Soaking tub; Fireplace; Blinds and window screens
- Laundry & utility: Laundry on lower level
Neighborhood map
What this means for you Summary
Snapshot
- This is a 3-bed/2.0-bath townhouse listed at $270k.
Deal economics
- At list price, monthly cash flow is $60 ($723/yr) — positive.
- The deal already cash-flows at list — no discount required.
- To meet the 1% rule (rent ≥ 1% of price), the offer needs to be $231k (14.5% below list).
- Recommended offer: $231k (14.5% below list) — sets the bar for 1% rule.
- Cap rate 6.6% vs local median 3.8% in Lexington-Fayette — top-decile yield for the area; either an underpriced asset or a hidden risk that comps aren't pricing in. Stress-test before assuming the spread holds.
Location & tenants
- Location reads: area grade D — affects rentability + tenant quality, not the cash-flow math above.
- Fayette County (urban): math 35% / reading 45% proficiency, ranked #27 of 165 in KY (top 16%) — families likely to look elsewhere, expect single-tenant / working-renter base with shorter leases.
- Zoned schools: Garrett Morgan Elementary (math 42% / reading 44%, grade F, #165 of 676 statewide, top 25%, 756 students, 33% FRL); Edythe Jones Hayes Middle School (math 47% / reading 60%, grade C+, #13 of 217 statewide, top 6%, 1,081 students, 37% FRL); Frederick Douglass High School (math 36% / reading 42%, grade F, #51 of 254 statewide, top 21%, 1,667 students, 43% FRL).
- Market conditions: Rents rising (+2.2%/yr); 280 active listings in the ZIP; 7 comparable units currently listed for rent nearby; rentals at typical pace (median 16d on market — plan ~3-4 weeks tenant-placement turnaround); solid renter incomes; 1,036 units permitted in Fayette County in 2024 (542 in 5+ unit buildings).
Forward outlook
- Local home prices are declining (-3.0%/yr); year-one equity from $2k of loan paydown is wiped out by about $8k of value loss. Plan a longer hold.
- Fayette County population projected at +35% by 2050 — long-run rental-demand tailwind backs the buy-and-hold thesis.
Negotiation context
- It's been on market 38 days — a 3% lower offer ($262k) is reasonable based on typical stale-listing flexibility.
- 2 sale attempts since 22y ago with the ask held roughly flat each time — persistent listings suggest the price (not the market) is what's stuck; bring a comps-based counter.
- Current owner paid $130k; list at $270k implies a 108% gain — meaningful room to come down on a strong offer.
Questions for the listing agent
- It's been on market 38 days. Have you received any prior offers? Is the seller open to a 14% concession, seller financing, or rate buy-down credit?
- What does the HOA fee cover, when was the last increase, and are there any pending special assessments or reserve-fund shortfalls?
- Is there a deadline driving the sale (1031 exchange, divorce, estate, relocation)? That informs how much negotiation room exists.
- The area grade is low — what's the realistic commute time and amenity access for the typical tenant pool here? Any planned neighborhood developments (good or bad) we should know about?
- What's the average days-on-market for RENTAL listings here right now (not sales)? A rising rental-DOM trend means longer vacancies and softer asking-rent achievability than the comps imply.
- What's the recent tenant-quality profile in this submarket — average credit score on applications, eviction rate, late-payment / NSF rate, and stable-employment percentage? A property-management company in the area should have these aggregated.
- How much new for-sale + rental construction is in the pipeline within 1–3 miles? Heavy new supply typically softens prices + rents 12–24 months out; constrained supply supports both.
Investment metrics
- 1% rule
- 0.86% ✗
- Cap rate
- 6.56%
- Cash-on-cash
- 0.96%
- DSCR
- 1.04
- GRM
- 9.7
CMA / ARV
- ARV (on-the-fly)
- $316,400
- Comps found
- 6
Show comp detail 6 sales within ~0.75 mi
| Address | Dist | Beds/Ba | Sqft | Sold | Price | $/sf | Match |
|---|---|---|---|---|---|---|---|
| 1104 Oatlands Park | 0.06mi | 3/2.0 | 1,808 (0%) | 10mo | $252,000 | $139 | 89 |
| 3826 Polo Club Blvd | 0.09mi | 3/2.5 | 1,808 (0%) | 23mo | $285,000 | $158 | 75 |
| 1118 Oatlands Park | 0.05mi | 3/2.0 | 1,950 (+8%) | 20mo | $260,000 | $133 | 68 |
| 3665 Amick Way | 0.72mi | 3/2.5 | 1,875 (+4%) | 9mo | $355,000 | $189 | 51 |
| 3625 Amick Way | 0.73mi | 3/2.5 | 1,665 (-8%) | 2mo | $291,500 | $175 | 50 |
| 3613 Amick Way | 0.74mi | 3/2.5 | 1,665 (-8%) | 9mo | $318,000 | $191 | 43 |
Match score weights: distance 35% · size 25% · config 20% · recency 20%. Top-matched comps best support the ARV.
Projected returns pro-forma
-3.0% appreciation · 2.22% rent growth · sell at horizon
- IRR
- -15.6%
- Equity multiple
- 0.45×
- Total profit
- $-41,743
- Equity at exit
- $40,258
- IRR
- -8.5%
- Equity multiple
- 0.49×
- Total profit
- $-38,788
- Equity at exit
- $23,345
Cash invested: $75,600 (down + closing). Projections, not guarantees.
Landlord ↔ Tenant lean methodology
- Overall (STATE)
- 83 Strongly Landlord-Friendly
- State Kentucky
- 83 Strongly Landlord-Friendly · R+16
- County
- — inherits STATE
- City
- — inherits STATE
ZIP-level market 40509
- Home prices YoY
- -20.6%
- Rents YoY
- 2.2%
- Active inventory
- 280
- Price-to-rent
- 9.7×
Monthly cashflow live
- Estimated rent
- $2,309 high interval (Pro) →
- Mortgage (P&I)
- −$1,416
- Tax from tax record
- −$135 /mo · $1,624/yr
- Insurance
- −$112
- HOA
- −$100
- Vacancy / Maint / Mgmt
- −$485
- Net cashflow
- $60
Break-even live
Sensitivity live
| Price | -10% $213 | -5% $137 | +0% $60 | +5% $-16 | +10% $-93 |
|---|---|---|---|---|---|
| Rent | -10% $-122 | -5% $-31 | +0% $60 | +5% $151 | +10% $243 |
| Rate | -1.0pp $196 | -0.5pp $129 | base $60 | +0.5pp $-10 | +1.0pp $-81 |
UW: 25.0% down · 7.5% · 30yr · 1.5% tax · 5.0% vac · 8.0% maint · 8.0% mgmt
Financing live
Cash to close
- Down payment
- $67,500
- Closing costs
- $8,100
- Reserves months
- —
- Total cash needed
- —
Loan-product check · same deal, 3 products live
Conventional
25% down · 7.5% · 30yr
- Down + closing
- —
- Monthly P&I
- —
- Monthly cashflow
- —
- DSCR
- —
- Eligible?
- —
Personal DTI + credit; lowest rate.
DSCR
20% down · 8.5% · 30yr
- Down + closing
- —
- Monthly P&I
- —
- Monthly cashflow
- —
- DSCR
- —
- Eligible?
- —
No personal income docs; deal must DSCR.
Hard money
10% down · 12.0% · 12mo
- Down + closing
- —
- Monthly P&I
- —
- Monthly cashflow
- —
- DSCR
- —
- Eligible?
- —
Short-term bridge; refi at stabilization.
Rent comps 7 comps
| Address | Beds | Baths | Sqft | Rent | $/sqft | DOM | Units | Dist |
|---|---|---|---|---|---|---|---|---|
| 4176 Todds Rd Lexington, KY | 1.0–3.0 | 1.0–2.0 | 1245 | $2,100 | $1.69 | 15d | 15 | 0.31mi |
| 3644 Iron Lace Dr Lexington, KY | 4.0 | 2.5 | 1688 | $2,295 | $1.36 | 15d | 1 | 0.64mi |
| 3548 Stolen Horse Trce Lexington, KY | 4.0 | 2.5 | 2500 | $2,995 | $1.20 | 25d | 1 | 0.70mi |
| 467 Hays Blvd Lexington, KY | 2.0–3.0 | 2.5 | 1436 | $1,947 | $1.36 | 15d | 3 | 1.02mi |
| 4636 Marcus Trl Lexington, KY | 4.0 | 2.5 | 2440 | $2,500 | $1.02 | 15d | 1 | 1.05mi |
| 1409 Pleasant Ridge Dr Lexington, KY | 4.0 | 2.5 | 1694 | $3,250 | $1.92 | 25d | 1 | 1.23mi |
| 421 Forest Hill Dr Lexington, KY | 3.0 | 2.5 | 2151 | $2,295 | $1.07 | 25d | 1 | 1.32mi |
HOA detail
- Monthly dues
- $100 · $1,200/yr
Listing history 21 events
-
2026-06-22days on market $269,999 Active 38 DOM
-
2026-06-18days on market $269,999 Active 35 DOM
-
2026-06-17days on market $269,999 Active 34 DOM
-
2026-06-16days on market $269,999 Active 33 DOM
-
2026-06-15days on market $269,999 Active 32 DOM
-
2026-06-14days on market $269,999 Active 30 DOM
-
2026-06-13pricedays on market $269,999 Active 29 DOM
-
2026-06-10days on market $280,000 Active 27 DOM
-
2026-06-09days on market $280,000 Active 26 DOM
-
2026-06-08days on market $280,000 Active 25 DOM
-
2026-06-07days on market $280,000 Active 24 DOM
-
2026-06-05days on market $280,000 Active 21 DOM
-
2026-06-03days on market $280,000 Active 20 DOM
-
2026-06-02days on market $280,000 Active 19 DOM
-
2026-06-01days on market $280,000 Active 18 DOM
-
2026-05-31days on market $280,000 Active 17 DOM
-
2026-05-31days on market $280,000 Active 16 DOM
-
2026-05-05$280,000 Active
-
2005-08-29soldstatus $129,900 753-char remark
Show marketing remark (753 chars)
Location-Location-Location! Spacious and luxurious brick condo/townhome(1951 sq. ft.)Built by David Tipton Homes, located near Hamburg with plenty of shopping and restaurants! 3 oversized bedrooms, 2 baths, 1st. floor master, large kitchen (with all appliances), vaulted and tray ceilings, seperate laundry room, fireplace, ceramic tile, walk-in closets,covered parking space and fenced in back yard! Upgrading is available for this upscale townhome! Get your order in now to pick out floor plans, colors, flooring etc. *Lauren plan $129,900 and Hollywood plan $131,900 (extra 1/2 bath). **This picture is a representation of what the home will look like at completion. Builder will provide a two year comprehensive ten year builders structual warranty.
-
2004-10-15historical 753-char remark
Show marketing remark (753 chars)
Location-Location-Location! Spacious and luxurious brick condo/townhome(1951 sq. ft.)Built by David Tipton Homes, located near Hamburg with plenty of shopping and restaurants! 3 oversized bedrooms, 2 baths, 1st. floor master, large kitchen (with all appliances), vaulted and tray ceilings, seperate laundry room, fireplace, ceramic tile, walk-in closets,covered parking space and fenced in back yard! Upgrading is available for this upscale townhome! Get your order in now to pick out floor plans, colors, flooring etc. *Lauren plan $129,900 and Hollywood plan $131,900 (extra 1/2 bath). **This picture is a representation of what the home will look like at completion. Builder will provide a two year comprehensive ten year builders structual warranty.
-
2004-03-15$129,900 753-char remark
Show marketing remark (753 chars)
Location-Location-Location! Spacious and luxurious brick condo/townhome(1951 sq. ft.)Built by David Tipton Homes, located near Hamburg with plenty of shopping and restaurants! 3 oversized bedrooms, 2 baths, 1st. floor master, large kitchen (with all appliances), vaulted and tray ceilings, seperate laundry room, fireplace, ceramic tile, walk-in closets,covered parking space and fenced in back yard! Upgrading is available for this upscale townhome! Get your order in now to pick out floor plans, colors, flooring etc. *Lauren plan $129,900 and Hollywood plan $131,900 (extra 1/2 bath). **This picture is a representation of what the home will look like at completion. Builder will provide a two year comprehensive ten year builders structual warranty.
ⓘ Source: listings_history table (triggers on properties + properties_extension) + one-shot
backfill from property_details.listing_events for pre-trigger history.
Tax reassessment forecast KY · Resets to sale price
- Current annual tax
- $1,624 · $135/mo
- Projected year-2 tax
- $2,322 · $193/mo
- Expected delta
- +$698/yr (+$58/mo · 43.0%)
ⓘ Screening estimate from a state-policy table — verify with the county assessor before closing.
Climate risk First Street
- Flood 1/10 Low FEMA zone X (unshaded) · 0% chance over 30 yrs
- Wildfire 2/10 Low
- Heat 4/10 Moderate 7 d/yr ≥102°F today · 19 d/yr by 30 yrs out
- Wind 2/10 Low 3% chance of damaging wind over 30 yrs
- Air quality 1/10 Low 0 unhealthy d/yr today · 0 by 30 yrs out
Nearby sold comps map
Loading sold comps map…
Walkable amenities ~0.75 mi
Loading nearby amenities…
Taxation est. · year 1
- Rental income
- $27,705
- − Mortgage interest
- −$15,124
- − Property taxes
- −$1,624
- − Insurance
- −$1,350
- − Repairs & maintenance
- −$2,216
- − Management
- −$2,216
- − HOA
- −$1,200
- − Depreciation
- −$7,855
- Taxable loss
- −$3,880
- Est. tax savings @ 24.0%
- +$931
- After-tax cash flow
- $1,654/yr
For passive investors: Depreciation is non-cash, so a rental often shows a tax loss while cash-flowing — sheltering income. Rental losses are passive: they offset passive income freely, and up to $25,000/yr can offset ordinary (W-2) income if you actively participate and your MAGI is under $100k (phasing out to $0 by $150k); unused losses carry forward. On sale, claimed depreciation is recaptured at up to 25%, and gains may owe capital-gains tax (a 1031 exchange can defer both). Figures are a year-1 estimate at your 24.0% rate — not tax advice; consult a CPA.
Schools (NCES district)
- District
- Fayette County
- NCES district ID
- 2101860
- Math proficiency
- 35% ▼ -16.00%
- Reading proficiency
- 45% ▼ -13.00%
- Median HH income
- $49,245
- Composite
- 34.38/100
- National rank
- #5211
- State rank
- #27 of 165 in KY
Livability — Lexington-Fayette
No livability data for this city. (Only ~50 U.S. cities are tracked.)
Census & demographics
- Census place
- Lexington-Fayette, KY
- County
- Fayette County · 317,143 people
- City population
- 321,882
- Metro
- Lexington-Fayette, KY
- Population (ZIP)
- 47,036
- Household income
- $94,804
- Rent vs Own
- Severe rent burden
- 1763.0
Population outlook (Fayette County) Hauer SSP2
- Today (2025)
- 363,454 people
- By 2030
- 388,270 · +6.8%
- By 2040
- 438,688 · +20.7%
- By 2050
- 490,667 · +35.0%
- By 2075
- 625,394 · +72.1%
- By 2100
- 721,354 · +98.5%
Race, ethnicity, and origin ACS 2023
- Neighborhood character
- Predominantly White (67%)
- Race & ethnicity
- White 67% Black 14% Two or more races 8% Asian 7% Hispanic / Latino 7%
- Hispanic origin (detail)
- Mexican 4%
- Common ancestry
- Italian 2% Slovak 2% Romanian 2%
- Foreign-born
- 12% · Canada, China
- Languages at home
- 84% English-only · Spanish 6% Other Indo-European 3% Other Asian/Pacific 2%
Political lean MEDSL · Fayette
- 2024 margin
- D (+18.1) · D 58.0% · R 39.9% · Other 2.1%
- 2008→2024 swing
- +13.3pp toward D · 2008: 4.8pp · 2024: 18.1pp
- All cycles
- 2024: D+18.1 2020: D+20.8 2016: D+9.5 2012: D+1.0 2008: D+4.8
Not yet ingested
- Civics
- —
Market trends
- HPI YoY
- ▼ -58.72%
- Current HPI
- 226.8663
- Rent YoY
- ▲ 2.22%
- Metro
- Lexington-Fayette, KY
- State GDP YoY
- ▲ 1.81%
- F500 in state
- 4
Industry mix (Fortune 500 HQ in KY)
| Industry | F500 HQs | Revenue |
|---|---|---|
| Healthcare | 1 | $118B |
|
||
| Food / Beverage | 1 | $7B |
|
||
Price history
+115.6% since first listed4 events — show timeline
- 2026-05-05 Listed $280,000 ImagineMLS
- 2005-08-29 Sold (MLS) $129,900 ImagineMLS
- 2004-10-15 Listing Removed — ImagineMLS
- 2004-03-15 Listed $129,900 ImagineMLS
Property tax history
+1.8%/yrLatest (2015): $1,624 · +1.8% YoY. Source: county tax records.
Cash-flow waterfall
monthlySold comps — $/sqft
last 12 mo · ≤1 miLoading sold comps…