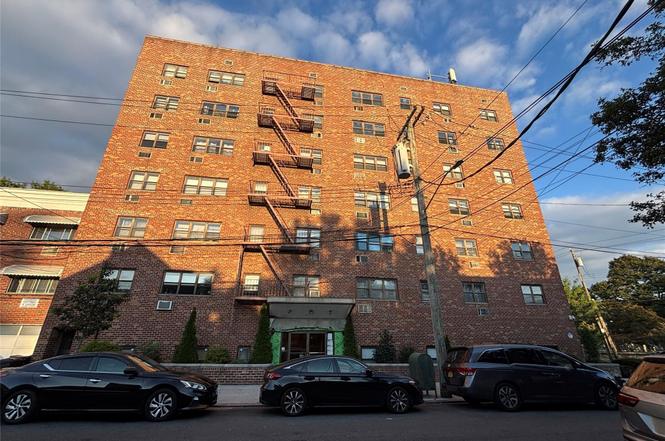
4200 Herkimer Pl Unit 7E · New York, NY
Flood risk 1/10 · Minimal
- FEMA flood zone
- X (unshaded)
- Chance of flooding over 30 yrs
- 0.0%
- Est. flood insurance / yr
- $507 – $1,088
Fire risk 2/10 · Minimal
- Est. fire insurance / yr
- $691 – $1,283
Heat risk 6/10 · Moderate
- Hot days now (above 99°F)
- 6 days/yr
- Hot days in 30 yrs
- 13 days/yr
Wind risk 6/10 · Moderate
- Chance of severe wind over 30 yrs
- 27.0%
Air-quality risk 3/10 · Minor
- Unhealthy air days now
- 3 days/yr
- Unhealthy air days in 30 yrs
- 4 days/yr
Risk factors via First Street. Map © Google.
Why this score? — see what drove the D- grade
The composite is a weighted blend of 9 inputs, each scored 0–100. Each bar is that input's sub-score; the figure is the points it added to the 100-point composite (weight × sub-score).
- 1% rule +10.0/10.0
- ARV discount +7.5/15.0
- Schools +5.0/10.0
- Cash flow +4.1/30.0
- Livability +3.8/5.0
- Rent growth +2.5/5.0
- Condition / age +2.5/5.0
- DSCR +0.0/10.0
- Appreciation +0.0/10.0
$139,000
🖨 Deal sheet 📄 Offer letter ✓ Due diligence
Listing remarks
Welcome to The Executive House in the heart of Woodlawn Heights! This sun-drenched one-bedroom co-op sits on the top floor with no neighbors above you — offering peace, quiet, and pretty views. Inside, the home is spacious, inviting, and freshly updated with gleaming refinished hardwood floors and a fresh coat of Benjamin Moore White Dove paint. An alcove entry creates the perfect spot for a home office or reading nook, while the oversized bedroom easily accommodates a California king bedroom set. Storage won’t be an issue with an abundance of closet space throughout. The building offers the convenience of a live-in super and an unbeatable location. The express bus to NYC stops
Key facts
- Live-in super
- Top floor
- Elevator building
Tags
Property features AI
Finance
- HOA & community: Managed by RockBridge Property Management
Exterior
- Parking: Has garage; No carport
- Utilities: Public sewer; Utilities: see remarks
- Home design: Stock cooperative
- Construction: Brick construction
- Exterior features: Brick exterior; Not waterfront
Interior
- Kitchen: Gas cooktop; Gas oven; Refrigerator
- Bedrooms: 4 rooms total
- Bathrooms: 1 full bathroom
- Heating & cooling: Oil heating; Wall/window air conditioning units
- Interior features: Chandelier; Elevator; Entrance foyer; Galley-style kitchen
- Laundry & utility: Common area laundry
Neighborhood map
What this means for you Summary
Snapshot
- This is a 1-bed/1.0-bath condo listed at $139k.
Deal economics
- At list price, monthly cash flow is $-382 ($-5k/yr) — negative.
- The deal already cash-flows at list — no discount required.
- Meets the 1% rule at list price ($2k rent vs $139k).
- Recommended offer: $122k (12.0% below list) — sets the bar for market timing.
Location & tenants
- Location reads 75/100 on livability (#268 in NY, #4,188 nationally) — a middle-class / working-renter tenant base. Strengths: amenities A+, commute A+, health & safety A; Watch: crime F, cost of living F.
- Market conditions: 66 active listings in the ZIP; 9 comparable units currently listed for rent nearby; rentals at typical pace (median 24d on market — plan ~3-4 weeks tenant-placement turnaround); 44% of comp listings sitting > 30 days — soft ceiling on asking rent; solid renter incomes; 6,929 units permitted in Bronx County in 2024 (6,829 in 5+ unit buildings).
Forward outlook
- Local home prices are declining (-3.0%/yr); year-one equity from $961 of loan paydown is wiped out by about $4k of value loss. Plan a longer hold.
- Bronx County population projected at +21% by 2050 — long-run rental-demand tailwind backs the buy-and-hold thesis.
Negotiation context
- It's been on market 177 days — a 12% lower offer ($122k) is reasonable based on typical stale-listing flexibility.
- 4 sale attempts since 25y ago; this cycle's ask has dropped $26k (16%) from the opening price — seller is motivated, your offer sets the floor, not the list.
Risks & watch-outs
- Watch-outs: HOA is 53% of rent.
- Climate carrying-cost: major wind risk, 27% chance of damaging wind over 30y; extreme-heat days projected 6→13/yr by 2055 (HVAC capex compounding) — expect insurance premiums to compound above CPI over the hold.
Questions for the listing agent
- What do current leases actually rent for vs. the listed asking? Can we see a recent rent roll and the last 12 months of T-12 income?
- It's been on market 177 days. Have you received any prior offers? Is the seller open to a 12% concession, seller financing, or rate buy-down credit?
- Built in 1967 — when were the roof, HVAC, electrical panel, plumbing, and water heater last replaced?
- What does the HOA fee cover, when was the last increase, and are there any pending special assessments or reserve-fund shortfalls?
- Any open or pending special assessments — roof, HVAC, plumbing, elevator, façade? What's the per-unit balance and payoff schedule, and is the seller paying it off at close or rolling it to the buyer?
- Why hasn't it sold? Are there any deal-killer items the seller is aware of (foundation, flood, title, zoning, code violations)?
- Is there a deadline driving the sale (1031 exchange, divorce, estate, relocation)? That informs how much negotiation room exists.
- Schools are B-rated — typically a magnet for longer-tenancy family renters. What's the average tenant stay here, and is there a school-zone premium baked into asking?
- Crime grade is F in this area — have there been break-ins, vandalism, or insurance claims at this property in the last 3 years? What carrier currently insures it and at what premium?
- The area grade is low — what's the realistic commute time and amenity access for the typical tenant pool here? Any planned neighborhood developments (good or bad) we should know about?
- What's the average days-on-market for RENTAL listings here right now (not sales)? A rising rental-DOM trend means longer vacancies and softer asking-rent achievability than the comps imply.
- What's the recent tenant-quality profile in this submarket — average credit score on applications, eviction rate, late-payment / NSF rate, and stable-employment percentage? A property-management company in the area should have these aggregated.
- How much new apartment / multifamily construction is in the pipeline within 1–3 miles? Heavy new supply (>2% of stock underway) typically softens rents 12–24 months out; light construction supports rent growth.
Investment metrics
- 1% rule
- 1.59% ✓
- Cap rate
- 2.99%
- Cash-on-cash
- -11.79%
- DSCR
- 0.48
- GRM
- 5.2
CMA / ARV
No comps found within radius.
Projected returns pro-forma
-3.0% appreciation · 3.0% rent growth · sell at horizon
- IRR
- -36.9%
- Equity multiple
- -0.19×
- Total profit
- $-46,129
- Equity at exit
- $20,725
- IRR
- -46.4%
- Equity multiple
- -0.76×
- Total profit
- $-68,475
- Equity at exit
- $12,018
Cash invested: $38,920 (down + closing). Projections, not guarantees.
Landlord ↔ Tenant lean methodology
- Overall (CITY)
- 0 Strongly Tenant-Friendly
- State New York
- 15 Strongly Tenant-Friendly · D+10
- County
- — inherits STATE
- City New York
- 0 Strongly Tenant-Friendly · D+34
ZIP-level market 10470
- Home prices YoY
- -28.6%
- Active inventory
- 66
- Price-to-rent
- 5.2×
Monthly cashflow live
- Estimated rent
- $2,213 high interval (Pro) →
- Mortgage (P&I)
- −$729
- Tax est. 1.5%
- −$174 /mo · $2,085/yr
- Insurance
- −$58
- HOA est. from 1 same-building comp
- −$1,170
- Vacancy / Maint / Mgmt
- −$465
- Net cashflow
- $-382
Break-even live
UW: 25.0% down · 7.5% · 30yr · 1.5% tax · 5.0% vac · 8.0% maint · 8.0% mgmt
Financing live
Cash to close
- Down payment
- $34,750
- Closing costs
- $4,170
- Reserves months
- —
- Total cash needed
- —
Loan-product check · same deal, 3 products live
Conventional
25% down · 7.5% · 30yr
- Down + closing
- —
- Monthly P&I
- —
- Monthly cashflow
- —
- DSCR
- —
- Eligible?
- —
Personal DTI + credit; lowest rate.
DSCR
20% down · 8.5% · 30yr
- Down + closing
- —
- Monthly P&I
- —
- Monthly cashflow
- —
- DSCR
- —
- Eligible?
- —
No personal income docs; deal must DSCR.
Hard money
10% down · 12.0% · 12mo
- Down + closing
- —
- Monthly P&I
- —
- Monthly cashflow
- —
- DSCR
- —
- Eligible?
- —
Short-term bridge; refi at stabilization.
Rent comps 9 comps
| Address | Beds | Baths | Sqft | Rent | $/sqft | DOM | Units | Dist |
|---|---|---|---|---|---|---|---|---|
| 675 McLean Ave Unit 006H Yonkers, NY | 1.0 | 1.0 | 577 | $2,071 | $3.59 | 4d | 1 | 0.85mi |
| 135 Wakefield Ave Yonkers, NY | 2.0 | 1.0 | 850 | $3,000 | $3.53 | 43d | 2 | 1.10mi |
| 216 1st St Unit 1 Yonkers, NY | 1.0 | 1.0 | 600 | $2,000 | $3.33 | 43d | 1 | 1.24mi |
| 57 Putnam Ave Yonkers, NY | 2.0 | 1.0 | 900 | $3,000 | $3.33 | 22d | 1 | 1.29mi |
| 57 Putnam Ave Yonkers, NY | 2.0 | 1.0 | 900 | $3,000 | $3.33 | 11d | 1 | 1.29mi |
| 249 McLean Ave Unit 1B Yonkers, NY | 1.0 | 1.0 | 700 | $2,500 | $3.57 | 18d | 1 | 1.36mi |
| 255 Bronx River Rd Unit 4R Yonkers, NY | 1.0 | 1.0 | 800 | $2,250 | $2.81 | 24d | 1 | 1.38mi |
| 130 Harrison Ave Yonkers, NY | 1.0 | 1.0 | 650 | $1,900 | $2.92 | 43d | 1 | 1.39mi |
| 277 Bronx River Rd Apt 3M Yonkers, NY | — | 1.0 | 550 | $1,700 | $3.09 | 43d | 1 | 1.42mi |
HOA detail condo
- Monthly dues
- $0 · $0/yr
- Assessments
- None detected in remarks — confirm with the listing agent.
Listing history 24 events
-
2026-06-18days on market $139,000 Active 177 DOM
-
2026-06-17pricedays on market $139,000 Active 176 DOM
-
2026-06-15days on market $149,000 Active 174 DOM
-
2026-06-13days on market $149,000 Active 172 DOM
-
2026-06-10days on market $149,000 Active 168 DOM
-
2026-06-08days on market $149,000 Active 167 DOM
-
2026-06-04days on market $149,000 Active 163 DOM
-
2026-06-03days on market $149,000 Active 162 DOM
-
2026-06-01days on market $149,000 Active 160 DOM
-
2026-05-31days on market $149,000 Active 159 DOM
-
2026-05-01price $149,000
-
2026-05-01status Active
-
2026-01-09status Pending
-
2025-10-29price $135,000
-
2025-09-02$165,000 Active
-
2025-06-11historical
-
2025-04-29price $140,000
-
2025-02-21price $149,900
-
2024-12-10price $160,000
-
2024-07-24price $170,000
-
2024-06-11$180,000 Active
-
2024-06-10historical
-
2001-05-22historical
-
2001-01-22
ⓘ Source: listings_history table (triggers on properties + properties_extension) + one-shot
backfill from property_details.listing_events for pre-trigger history.
Climate risk First Street
- Flood 1/10 Low FEMA zone X (unshaded) · 0% chance over 30 yrs
- Wildfire 2/10 Low
- Heat 6/10 Major 6 d/yr ≥99°F today · 13 d/yr by 30 yrs out
- Wind 6/10 Major 27% chance of damaging wind over 30 yrs
- Air quality 3/10 Moderate 3 unhealthy d/yr today · 4 by 30 yrs out
Nearby sold comps map
Loading sold comps map…
Walkable amenities ~0.75 mi
Loading nearby amenities…
Taxation est. · year 1
- Rental income
- $26,554
- − Mortgage interest
- −$7,786
- − Property taxes
- −$2,085
- − Insurance
- −$695
- − Repairs & maintenance
- −$2,124
- − Management
- −$2,124
- − HOA
- −$14,040
- − Depreciation
- −$4,044
- Taxable loss
- −$6,344
- Est. tax savings @ 24.0%
- +$1,523
- After-tax cash flow
- $-3,067/yr
For passive investors: Depreciation is non-cash, so a rental often shows a tax loss while cash-flowing — sheltering income. Rental losses are passive: they offset passive income freely, and up to $25,000/yr can offset ordinary (W-2) income if you actively participate and your MAGI is under $100k (phasing out to $0 by $150k); unused losses carry forward. On sale, claimed depreciation is recaptured at up to 25%, and gains may owe capital-gains tax (a 1031 exchange can defer both). Figures are a year-1 estimate at your 24.0% rate — not tax advice; consult a CPA.
Schools (NCES district)
No district data.
Livability — New York
- Score
- 75/100
- State rank
- #268
- US rank
- #4188
Category grades
Schools grade is shown separately in the Schools card above.
Census & demographics
- Census place
- New York, NY
- County
- Bronx County · 1,197,324 people
- City population
- 7,731,280
- Metro
- New York-Newark-Jersey City, NY-NJ-PA
- Population (ZIP)
- 16,004
- Household income
- $90,046
- Rent vs Own
- Severe rent burden
- 805.0
Population outlook (Bronx County) Hauer SSP2
- Today (2025)
- 1,607,353 people
- By 2030
- 1,681,852 · +4.6%
- By 2040
- 1,824,421 · +13.5%
- By 2050
- 1,945,470 · +21.0%
- By 2075
- 2,187,887 · +36.1%
- By 2100
- 2,244,136 · +39.6%
Race, ethnicity, and origin ACS 2023
- Neighborhood character
- Highly diverse neighborhood (Simpson 0.71)
- Race & ethnicity
- White 38% Black 30% Hispanic / Latino 24% Two or more races 9% Asian 3% Native American 1%
- Hispanic origin (detail)
- Puerto Rican 9% Dominican 9%
- Common ancestry
- Romanian 1% Lithuanian 1% Slovak 1%
- Foreign-born
- 32% · Canada, Jamaica
- Languages at home
- 72% English-only · Spanish 17% Other Indo-European 5% French/Haitian/Cajun 2%
Political lean MEDSL · Bronx
- 2024 margin
- Solid D (+45.4) · D 72.7% · R 27.3%
- 2008→2024 swing
- -32.3pp toward R · 2008: 77.8pp · 2024: 45.4pp
- All cycles
- 2024: D+45.4 2020: D+67.6 2016: D+79.1 2012: D+82.9 2008: D+77.8
Not yet ingested
- Civics
- —
Market trends
- HPI YoY
- ▼ -114.64%
- Current HPI
- 286.9195
- Rent YoY
- —
- Metro
- New York-Newark-Jersey City, NY-NJ-PA
- State GDP YoY
- ▲ 2.60%
- F500 in state
- 92
Industry mix (Fortune 500 HQ in NY)
| Industry | F500 HQs | Revenue |
|---|---|---|
| Financial Services | 10 | $950B |
|
||
| Consumer Goods | 9 | $162B |
|
||
| Insurance | 4 | $225B |
|
||
| Telecommunications | 2 | $144B |
|
||
| Pharmaceuticals | 2 | $112B |
|
||
| Media / Entertainment | 2 | $69B |
|
||
Price history
-17.2% since first listed14 events — show timeline
- 2026-05-01 Price Changed $149,000 OneKey® MLS as Distributed by MLS Grid
- 2026-05-01 Relisted — OneKey® MLS as Distributed by MLS Grid
- 2026-01-09 Pending — OneKey® MLS as Distributed by MLS Grid
- 2025-10-29 Price Changed $135,000 OneKey® MLS as Distributed by MLS Grid
- 2025-09-02 Listed $165,000 OneKey® MLS as Distributed by MLS Grid
- 2025-06-11 Listing Removed — OneKey® MLS as Distributed by MLS Grid
- 2025-04-29 Price Changed $140,000 OneKey® MLS as Distributed by MLS Grid
- 2025-02-21 Price Changed $149,900 OneKey® MLS as Distributed by MLS Grid
- 2024-12-10 Price Changed $160,000 OneKey® MLS as Distributed by MLS Grid
- 2024-07-24 Price Changed $170,000 OneKey® MLS as Distributed by MLS Grid
- 2024-06-11 Listed $180,000 OneKey® MLS as Distributed by MLS Grid
- 2024-06-10 Coming Soon — OneKey® MLS as Distributed by MLS Grid
- 2001-05-22 Delisted — HGMLS
- 2001-01-22 Listed — HGMLS
Cash-flow waterfall
monthlySold comps — $/sqft
last 12 mo · ≤1 miLoading sold comps…