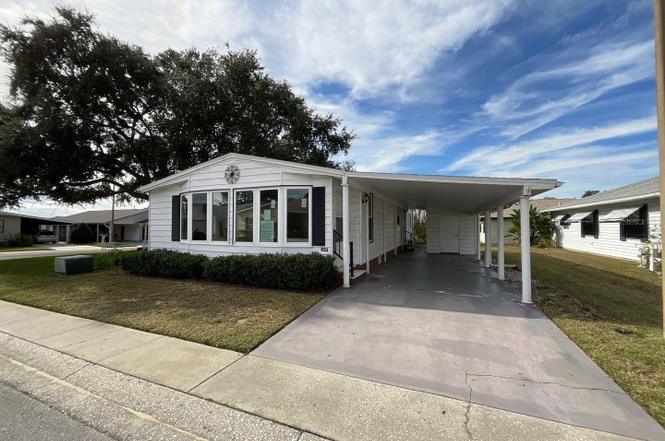
3208 Pebble Bend Dr · Lakeland, FL
Flood risk 1/10 · Minimal
- FEMA flood zone
- X (unshaded)
- Chance of flooding over 30 yrs
- 0.0%
- Est. flood insurance / yr
- $507 – $1,088
Fire risk 4/10 · Minor
- Est. fire insurance / yr
- $947 – $1,759
Heat risk 8/10 · Major
- Hot days now (above 108°F)
- 7 days/yr
- Hot days in 30 yrs
- 23 days/yr
Wind risk 9/10 · Severe
- Chance of severe wind over 30 yrs
- 99.0%
Air-quality risk 2/10 · Minimal
- Unhealthy air days now
- 1 days/yr
- Unhealthy air days in 30 yrs
- 1 days/yr
Risk factors via First Street. Map © Google.
Why this score? — see what drove the B grade
The composite is a weighted blend of 9 inputs, each scored 0–100. Each bar is that input's sub-score; the figure is the points it added to the 100-point composite (weight × sub-score).
- Cash flow +30.0/30.0
- 1% rule +10.0/10.0
- DSCR +10.0/10.0
- ARV discount +7.5/15.0
- Livability +3.9/5.0
- Schools +3.5/10.0
- Rent growth +3.2/5.0
- Condition / age +2.5/5.0
- Appreciation +0.0/10.0
$99,900
🖨 Deal sheet 📄 Offer letter ✓ Due diligence
Listing remarks
Auction Property. Welcome to this charming 2/2 manufactured home perfectly situated on a shady corner lot in the desirable Highland Fairways gated community. Designed with an open floor plan, the home offers a warm and inviting atmosphere ideal for both everyday living and entertaining. The spacious family room is filled with natural light from large bay windows, and a separate living and dining combination provides additional flexibility for hosting guests or enjoying quiet meals at home. The primary suite is a private retreat featuring an en-suite bath and a walk-in closet for ample storage. Outside is an attached carport and storage shed offering extra space for tools, hobbies, or golf g
Key facts
- Open floor plan
- Attached carport
- Clubhouse
Tags
Property features AI
Finance
- Other: Homestead exempt; Unfurnished
- Financial info: Lease restrictions apply
- HOA & community: Monthly HOA fee of $239.50; HOA amenities include clubhouse, fitness center, golf course, pool, recreation facilities, and tennis courts; Association approval required; Pets allowed; Senior community
Exterior
- Parking: Carport with 1 space
- Utilities: Public water; Public sewer; Electricity available
- Home design: Manufactured double-wide home; Single-story; East-facing entry
- Construction: Vinyl siding; Shingle roof; Crawlspace foundation
- Exterior features: Mature landscaping; Asphalt road access
Interior
- Kitchen: Dishwasher; Range; Refrigerator
- Bedrooms: 2 bedrooms
- Flooring: Carpet; Other
- Bathrooms: 2 full bathrooms
- Heating & cooling: Central heating (electric); Central air conditioning
- Interior features: Living room and dining room combo; Walk-in closets; Family room
- Laundry & utility: Laundry room inside
Neighborhood map
What this means for you Summary
Snapshot
- This is a 2-bed/2.0-bath manufactured listed at $100k.
Deal economics
- At list price, monthly cash flow is $437 ($5k/yr) — positive.
- The deal already cash-flows at list — no discount required.
- Meets the 1% rule at list price ($2k rent vs $100k).
- Recommended offer: $91k (9.0% below list) — sets the bar for market timing.
Location & tenants
- Location reads 77/100 on livability (#206 in FL, #3,179 nationally) — a middle-class / working-renter tenant base. Strengths: cost of living A+, housing A+, health & safety A+; Watch: employment D+, amenities F, commute F.
- Polk (suburban): math 39% / reading 43% proficiency, ranked #62 of 73 in FL (top 85%) — families likely to look elsewhere, expect single-tenant / working-renter base with shorter leases.
- Market conditions: Rents rising (+2.8%/yr); 504 active listings in the ZIP; 19 comparable units currently listed for rent nearby; rentals leasing fast (median 14d on market — plan ~1-2 weeks tenant-placement turnaround); 10,384 units permitted in Polk County in 2024 (1,716 in 5+ unit buildings).
- This rent runs 31% of the median local income ($70k/yr) — at the standard rent-burdened threshold; future hikes will face affordability resistance.
Forward outlook
- Local home prices are declining (-3.0%/yr); year-one equity from $691 of loan paydown is wiped out by about $3k of value loss. Plan a longer hold.
- Polk County population projected at +33% by 2050 — long-run rental-demand tailwind backs the buy-and-hold thesis.
- At projected returns (-3.0% appreciation + 2.8% rent growth), your $28k cash investment doubles in ~7 years — after that, you're playing with house money.
Negotiation context
- It's been on market 117 days — a 9% lower offer ($91k) is reasonable based on typical stale-listing flexibility.
- 5 sale attempts since 14y ago; this cycle's ask has dropped $49k (33%) from the opening price — seller is motivated, your offer sets the floor, not the list.
- Current owner paid $49k; list at $100k implies a 104% gain — meaningful room to come down on a strong offer.
Risks & watch-outs
- Climate carrying-cost: severe wind risk, 99% chance of damaging wind over 30y; extreme-heat days projected 7→23/yr by 2055 (HVAC capex compounding) — expect insurance premiums to compound above CPI over the hold.
Questions for the listing agent
- It's been on market 117 days. Have you received any prior offers? Is the seller open to a 9% concession, seller financing, or rate buy-down credit?
- What does the HOA fee cover, when was the last increase, and are there any pending special assessments or reserve-fund shortfalls?
- Why hasn't it sold? Are there any deal-killer items the seller is aware of (foundation, flood, title, zoning, code violations)?
- Is there a deadline driving the sale (1031 exchange, divorce, estate, relocation)? That informs how much negotiation room exists.
- What's the average days-on-market for RENTAL listings here right now (not sales)? A rising rental-DOM trend means longer vacancies and softer asking-rent achievability than the comps imply.
- What's the recent tenant-quality profile in this submarket — average credit score on applications, eviction rate, late-payment / NSF rate, and stable-employment percentage? A property-management company in the area should have these aggregated.
- How much new for-sale + rental construction is in the pipeline within 1–3 miles? Heavy new supply typically softens prices + rents 12–24 months out; constrained supply supports both.
Investment metrics
- 1% rule
- 1.81% ✓
- Cap rate
- 11.54%
- Cash-on-cash
- 18.75%
- DSCR
- 1.83
- GRM
- 4.6
CMA / ARV
No comps found within radius.
Projected returns pro-forma
-3.0% appreciation · 2.78% rent growth · sell at horizon
- IRR
- 10.4%
- Equity multiple
- 1.41×
- Total profit
- $11,454
- Equity at exit
- $14,895
- IRR
- 19.4%
- Equity multiple
- 2.61×
- Total profit
- $45,037
- Equity at exit
- $8,638
Cash invested: $27,972 (down + closing). Projections, not guarantees.
Landlord ↔ Tenant lean methodology
- Overall (STATE)
- 87 Strongly Landlord-Friendly
- State Florida
- 87 Strongly Landlord-Friendly · R+3
- County
- — inherits STATE
- City
- — inherits STATE
ZIP-level market 33810
- Rents YoY
- 2.8%
- Active inventory
- 504
- Price-to-rent
- 4.6×
Monthly cashflow live
- Estimated rent
- $1,806 high interval (Pro) →
- Mortgage (P&I)
- −$524
- Tax from tax record
- −$186 /mo · $2,226/yr
- Insurance
- −$42
- HOA
- −$239
- Vacancy / Maint / Mgmt
- −$379
- Net cashflow
- $437
Break-even live
UW: 25.0% down · 7.5% · 30yr · 1.5% tax · 5.0% vac · 8.0% maint · 8.0% mgmt
Financing live
Cash to close
- Down payment
- $24,975
- Closing costs
- $2,997
- Reserves months
- —
- Total cash needed
- —
Loan-product check · same deal, 3 products live
Conventional
25% down · 7.5% · 30yr
- Down + closing
- —
- Monthly P&I
- —
- Monthly cashflow
- —
- DSCR
- —
- Eligible?
- —
Personal DTI + credit; lowest rate.
DSCR
20% down · 8.5% · 30yr
- Down + closing
- —
- Monthly P&I
- —
- Monthly cashflow
- —
- DSCR
- —
- Eligible?
- —
No personal income docs; deal must DSCR.
Hard money
10% down · 12.0% · 12mo
- Down + closing
- —
- Monthly P&I
- —
- Monthly cashflow
- —
- DSCR
- —
- Eligible?
- —
Short-term bridge; refi at stabilization.
Rent comps 19 comps
| Address | Beds | Baths | Sqft | Rent | $/sqft | DOM | Units | Dist |
|---|---|---|---|---|---|---|---|---|
| 3211 Julia Ct Lakeland, FL | 2.0 | 2.0 | 938 | $1,395 | $1.49 | 23d | 1 | 0.35mi |
| 3122 Julia Ct Lakeland, FL | 2.0 | 1.0 | 1097 | $1,450 | $1.32 | 3d | 1 | 0.38mi |
| 1846 Masters Ln Lakeland, FL | 2.0 | 2.0 | 1487 | $1,800 | $1.21 | 21d | 1 | 0.42mi |
| 1906 Griffin Rd Lakeland, FL | 1.0–3.0 | 1.0–2.0 | 1148 | $2,049 | $1.78 | 3d | 11 | 0.42mi |
| 3852 Hampton Hills Dr Lakeland, FL | 3.0 | 2.0 | 1861 | $1,950 | $1.05 | 10d | 1 | 0.57mi |
| 4111 Solamor St Lakeland, FL | 3.0 | 2.0 | 1619 | $2,400 | $1.48 | 14d | 1 | 0.81mi |
| 3842 Hampstead Ln Lakeland, FL | 3.0 | 2.5 | 1633 | $1,800 | $1.10 | 13d | 1 | 0.89mi |
| 3867 Hampstead Ln Lakeland, FL | 3.0 | 2.5 | 1633 | $1,795 | $1.10 | 3d | 1 | 0.92mi |
| 3824 Exeter Ln Lakeland, FL | 3.0 | 2.5 | 1771 | $1,795 | $1.01 | 2d | 1 | 0.93mi |
| 3805 Exeter Ln Lakeland, FL | 3.0 | 2.5 | 1771 | $1,900 | $1.07 | 14d | 1 | 0.96mi |
| 4083 Dover Terrace Dr Unit 4083 Lakeland, FL | 3.0 | 2.5 | 1771 | $1,975 | $1.12 | 23d | 1 | 1.06mi |
| 3205 J and J Manor Rd Lakeland, FL | 3.0 | 2.0 | 1568 | $1,900 | $1.21 | 3d | 1 | 1.16mi |
| 4240 Summer Landing Dr Lakeland, FL | 2.0–3.0 | 2.0 | 1083 | $1,450 | $1.34 | 13d | 2 | 1.27mi |
| 4240 Summer Landing Dr #106 Lakeland, FL | 3.0 | 2.0 | 1038 | $1,700 | $1.64 | 23d | 1 | 1.27mi |
| 1545 Kennedy Blvd Lakeland, FL | 1.0–3.0 | 1.0–2.0 | 997 | $1,682 | $1.69 | 2d | 24 | 1.28mi |
| 4500 Williamstown Blvd Lakeland, FL | 3.0 | 1.0–2.0 | 1062 | $1,508 | $1.42 | 23d | 1 | 1.37mi |
| 1211 Robert King High Dr Lakeland, FL | 3.0 | 1.5 | 1050 | $1,625 | $1.55 | 23d | 1 | 1.40mi |
| 2340 Shasta St Lakeland, FL | 3.0–5.0 | 2.0–3.0 | 2098 | $2,185 | $1.04 | 3d | 3 | 1.46mi |
| 1510 Galloway Oaks Dr Lakeland, FL | 2.0–3.0 | 2.0 | 1066 | $1,376 | $1.29 | 21d | 8 | 1.49mi |
HOA detail
- Monthly dues
- $239 · $2,868/yr
- Likely covers
- security
Listing history 24 events
-
2026-05-13status Pending
-
2026-04-20price $99,900
-
2026-03-31price $116,100
-
2026-03-27price $129,000
-
2026-03-16price $134,100
-
2026-02-20price $141,550
-
2026-01-16$149,000 Active
-
2024-07-09price $150,000
-
2024-07-02price $190,000
-
2024-05-11price $210,000
-
2024-03-22$225,000 Active
-
2016-06-24historical
-
2016-04-14price $94,000
-
2016-03-19status Active
-
2016-03-16historical
-
2016-03-12price $99,900
-
2016-02-17price $105,000
-
2016-02-01price $110,000
-
2016-01-28$118,000 Active
-
2012-06-27soldstatus $49,000
-
2012-03-01$55,000
-
2003-06-05soldstatus $70,000
-
1996-03-28soldstatus $51,000
-
1995-12-14soldstatus $61,000
ⓘ Source: listings_history table (triggers on properties + properties_extension) + one-shot
backfill from property_details.listing_events for pre-trigger history.
Tax reassessment forecast FL · Resets to sale price
- Current annual tax
- $2,226 · $186/mo
- Projected year-2 tax
- $2,226 · $186/mo
- Expected delta
- $0/yr ($0/mo · 0.0%)
ⓘ Screening estimate from a state-policy table — verify with the county assessor before closing.
Climate risk First Street
- Flood 1/10 Low FEMA zone X (unshaded) · 0% chance over 30 yrs
- Wildfire 4/10 Moderate
- Heat 8/10 Severe 7 d/yr ≥108°F today · 23 d/yr by 30 yrs out
- Wind 9/10 Extreme 99% chance of damaging wind over 30 yrs
- Air quality 2/10 Low 1 unhealthy d/yr today · 1 by 30 yrs out
Nearby sold comps map
Loading sold comps map…
Walkable amenities ~0.75 mi
Loading nearby amenities…
Taxation est. · year 1
- Rental income
- $21,676
- − Mortgage interest
- −$5,596
- − Property taxes
- −$2,226
- − Insurance
- −$500
- − Repairs & maintenance
- −$1,734
- − Management
- −$1,734
- − HOA
- −$2,868
- − Depreciation
- −$2,906
- Taxable income
- $4,112
- Est. tax owed @ 24.0%
- −$987
- After-tax cash flow
- $4,257/yr
For passive investors: Depreciation is non-cash, so a rental often shows a tax loss while cash-flowing — sheltering income. Rental losses are passive: they offset passive income freely, and up to $25,000/yr can offset ordinary (W-2) income if you actively participate and your MAGI is under $100k (phasing out to $0 by $150k); unused losses carry forward. On sale, claimed depreciation is recaptured at up to 25%, and gains may owe capital-gains tax (a 1031 exchange can defer both). Figures are a year-1 estimate at your 24.0% rate — not tax advice; consult a CPA.
Schools (NCES district)
- District
- Polk
- NCES district ID
- 1201590
- Math proficiency
- 39% ▼ -11.00%
- Reading proficiency
- 43% ▼ -4.00%
- Median HH income
- $43,979
- Composite
- 34.74/100
- National rank
- #5132
- State rank
- #62 of 73 in FL
Livability — Lakeland
- Score
- 77/100
- State rank
- #206
- US rank
- #3179
Category grades
Schools grade is shown separately in the Schools card above.
Census & demographics
- Census place
- Lakeland, FL
- County
- Polk County · 740,051 people
- City population
- 277,690
- Metro
- Lakeland-Winter Haven, FL
- Population (ZIP)
- 55,137
- Household income
- $69,986
- Rent vs Own
- Severe rent burden
- 1208.0
Population outlook (Polk County) Hauer SSP2
- Today (2025)
- 752,975 people
- By 2030
- 804,621 · +6.9%
- By 2040
- 906,117 · +20.3%
- By 2050
- 1,000,476 · +32.9%
- By 2075
- 1,197,520 · +59.0%
- By 2100
- 1,271,518 · +68.9%
Race, ethnicity, and origin ACS 2023
- Neighborhood character
- Diverse neighborhood (Simpson 0.58)
- Race & ethnicity
- White 59% Hispanic / Latino 23% Black 12% Two or more races 10% Asian 2%
- Hispanic origin (detail)
- Mexican 5% Puerto Rican 9% Cuban 5%
- Common ancestry
- Italian 2% Lithuanian 2% Slovak 1%
- Foreign-born
- 9% · Canada, Jamaica
- Languages at home
- 79% English-only · Spanish 17% French/Haitian/Cajun 1% Tagalog/Filipino 1%
Political lean MEDSL · Polk
- 2024 margin
- Strong R (+20.7) · D 39.2% · R 59.9%
- 2008→2024 swing
- -14.6pp toward R · 2008: -6.1pp · 2024: -20.7pp
- All cycles
- 2024: R+20.7 2020: R+14.4 2016: R+14.1 2012: R+6.8 2008: R+6.1
Not yet ingested
- Civics
- —
Market trends
- HPI YoY
- ▼ -194.94%
- Current HPI
- 320.7366
- Rent YoY
- ▲ 2.78%
- Metro
- Lakeland-Winter Haven, FL
- State GDP YoY
- ▲ 3.28%
- F500 in state
- 36
Industry mix (Fortune 500 HQ in FL)
| Industry | F500 HQs | Revenue |
|---|---|---|
| Industrial Technology | 2 | $29B |
|
||
| Insurance | 2 | $17B |
|
||
| Retail | 1 | $60B |
|
||
| Technology Distribution | 1 | $58B |
|
||
| Homebuilding | 1 | $35B |
|
||
| Technology Manufacturing | 1 | $35B |
|
||
Price history
+63.8% since first listed24 events — show timeline
- 2026-05-13 Pending — Stellar MLS as Distributed by MLS Grid
- 2026-04-20 Price Changed $99,900 Stellar MLS as Distributed by MLS Grid
- 2026-03-31 Price Changed $116,100 Stellar MLS as Distributed by MLS Grid
- 2026-03-27 Price Changed $129,000 Stellar MLS as Distributed by MLS Grid
- 2026-03-16 Price Changed $134,100 Stellar MLS as Distributed by MLS Grid
- 2026-02-20 Price Changed $141,550 Stellar MLS as Distributed by MLS Grid
- 2026-01-16 Listed $149,000 Stellar MLS as Distributed by MLS Grid
- 2024-07-09 Price Changed $150,000 Stellar MLS as Distributed by MLS Grid
- 2024-07-02 Price Changed $190,000 Stellar MLS as Distributed by MLS Grid
- 2024-05-11 Price Changed $210,000 Stellar MLS as Distributed by MLS Grid
- 2024-03-22 Listed $225,000 Stellar MLS as Distributed by MLS Grid
- 2016-06-24 Listing Removed — Stellar MLS as Distributed by MLS Grid
- 2016-04-14 Price Changed $94,000 Stellar MLS as Distributed by MLS Grid
- 2016-03-19 Relisted — Stellar MLS as Distributed by MLS Grid
- 2016-03-16 Listing Removed — Stellar MLS as Distributed by MLS Grid
- 2016-03-12 Price Changed $99,900 Stellar MLS as Distributed by MLS Grid
- 2016-02-17 Price Changed $105,000 Stellar MLS as Distributed by MLS Grid
- 2016-02-01 Price Changed $110,000 Stellar MLS as Distributed by MLS Grid
- 2016-01-28 Listed $118,000 Stellar MLS as Distributed by MLS Grid
- 2012-06-27 Sold (MLS) $49,000 Stellar MLS as Distributed by MLS Grid
- 2012-03-01 Listed $55,000 Stellar MLS as Distributed by MLS Grid
- 2003-06-05 Sold (Public Records) $70,000 Public Records
- 1996-03-28 Sold (Public Records) $51,000 Public Records
- 1995-12-14 Sold (Public Records) $61,000 Public Records
Property tax history
+12.8%/yrLatest (2025): $2,226 · +1061.5% YoY. Source: county tax records.
Cash-flow waterfall
monthlySold comps — $/sqft
last 12 mo · ≤1 miLoading sold comps…