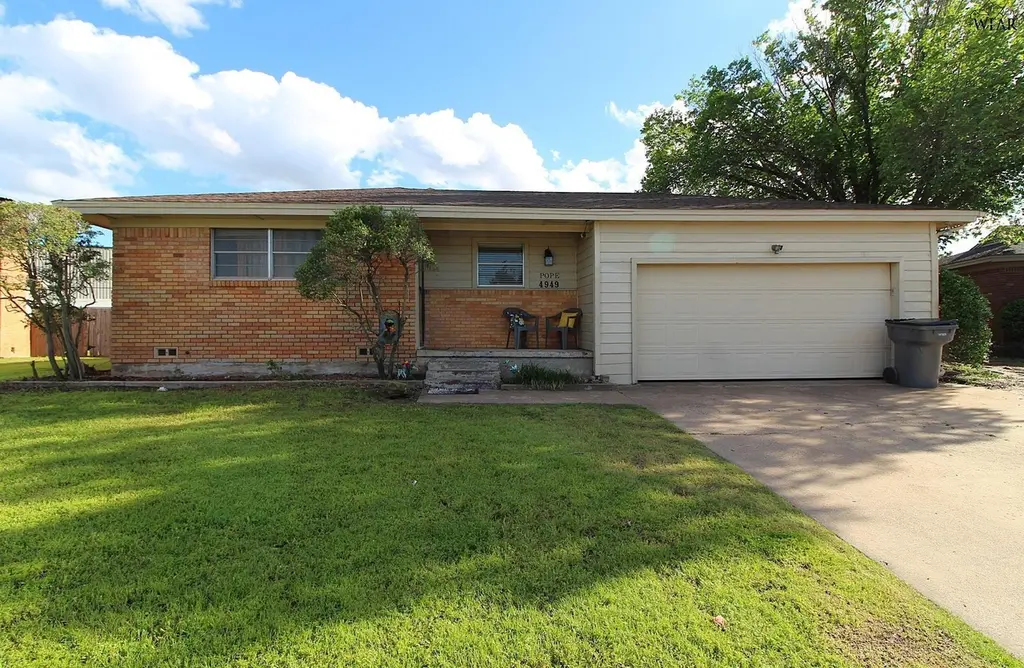
4949 S Lake Park Dr · Wichita Falls, TX
Flood risk 7/10 · Major
- FEMA flood zone
- X (shaded)
- Chance of flooding over 30 yrs
- 0.77%
- Est. flood insurance / yr
- $507 – $1,088
Fire risk 7/10 · Major
- Est. fire insurance / yr
- $1,222 – $2,270
Heat risk 7/10 · Major
- Hot days now (above 109°F)
- 7 days/yr
- Hot days in 30 yrs
- 21 days/yr
Wind risk 4/10 · Minor
- Chance of severe wind over 30 yrs
- 10.0%
Air-quality risk 1/10 · Minimal
- Unhealthy air days now
- 0 days/yr
- Unhealthy air days in 30 yrs
- 0 days/yr
Risk factors via First Street. Map © Google.
Why this score? — see what drove the D grade
The composite is a weighted blend of 9 inputs, each scored 0–100. Each bar is that input's sub-score; the figure is the points it added to the 100-point composite (weight × sub-score).
- Cash flow +14.4/30.0
- ARV discount +9.1/15.0
- 1% rule +4.9/10.0
- DSCR +4.4/10.0
- Livability +3.5/5.0
- Schools +2.7/10.0
- Rent growth +2.5/5.0
- Condition / age +2.5/5.0
- Appreciation +0.0/10.0
$175,000
🖨 Deal sheet 📄 Offer letter ✓ Due diligence
Listing remarks MLS
Lovely on Lake Park! This generationally owned 3bd, 1.5bth home features TWO living areas, hardwood floors, remodeled bth, vintage details, distinctive design touches. The property also includes brick fireplace, 2 car garage, large covered patio, defined planting beds, mature landscaping, HUGE fenced backyard, over 1/4 acre, & adjacent to Bill Bartley Branch YMCA. Highly motivated seller - bring an offer! Call today to schedule your tour!
Key facts
- Brick fireplace
- Two living areas
- Large covered patio
Tags
Neighborhood map
What this means for you Summary
Snapshot
- This is a 3-bed/2.0-bath single-family listed at $175k.
Deal economics
- At list price, monthly cash flow is $-31 ($-367/yr) — negative.
- To cash-flow at today's rent, offer at most $170k (3.1% below list).
- To meet the 1% rule (rent ≥ 1% of price), the offer needs to be $173k (1.1% below list).
- Recommended offer: $154k (12.0% below list) — sets the bar for market timing.
- Cap rate 6.5% vs local median 4.7% in Wichita Falls — top-decile yield for the area; either an underpriced asset or a hidden risk that comps aren't pricing in. Stress-test before assuming the spread holds.
Location & tenants
- Location reads 69/100 on livability (#437 in TX) — a middle-class / working-renter tenant base. Strengths: cost of living A+, housing A+; Watch: health & safety C-, employment D+, schools D.
- Wichita Falls ISD (urban): math 31% / reading 33% proficiency, ranked #585 of 826 in TX (top 71%) — families likely to look elsewhere, expect single-tenant / working-renter base with shorter leases.
- Market conditions: 75 active listings in the ZIP; 5 comparable units currently listed for rent nearby; rentals lingering (median 44d on market — plan ~5-8 weeks vacancy on turnover, expect pricing pressure); 100% of comp listings sitting > 30 days — soft ceiling on asking rent; 231 units permitted in Wichita County in 2024 (10 in 5+ unit buildings).
- This rent runs 35% of the median local income ($60k/yr) — at the standard rent-burdened threshold; future hikes will face affordability resistance.
Forward outlook
- Local home prices are declining (-3.0%/yr); year-one equity from $1k of loan paydown is wiped out by about $5k of value loss. Plan a longer hold.
- Wichita County population projected to shrink 7% by 2050 — rents likely to lag national; underwrite the cash flow, not the appreciation.
Negotiation context
- It's been on market 198 days — a 12% lower offer ($154k) is reasonable based on typical stale-listing flexibility.
Risks & watch-outs
- Watch-outs: flood insurance adds $66/mo; built in 1959 — expect roof / HVAC / electrical / plumbing capex.
- Climate carrying-cost: major flood risk; major wildfire risk; extreme-heat days projected 7→21/yr by 2055 (HVAC capex compounding) — expect insurance premiums to compound above CPI over the hold.
Questions for the listing agent
- What do current leases actually rent for vs. the listed asking? Can we see a recent rent roll and the last 12 months of T-12 income?
- It's been on market 198 days. Have you received any prior offers? Is the seller open to a 12% concession, seller financing, or rate buy-down credit?
- Built in 1959 — when were the roof, HVAC, electrical panel, plumbing, and water heater last replaced?
- What's the actual annual flood-insurance premium (NFIP or private), and is the property in a SFHA with mandatory coverage?
- Why hasn't it sold? Are there any deal-killer items the seller is aware of (foundation, flood, title, zoning, code violations)?
- Is there a deadline driving the sale (1031 exchange, divorce, estate, relocation)? That informs how much negotiation room exists.
- Schools are D-rated, which usually means shorter tenancies and higher turnover. Who's the typical renter profile here, and what's been the actual vacancy rate?
- Crime grade is D in this area — have there been break-ins, vandalism, or insurance claims at this property in the last 3 years? What carrier currently insures it and at what premium?
- The area grade is low — what's the realistic commute time and amenity access for the typical tenant pool here? Any planned neighborhood developments (good or bad) we should know about?
- What's the average days-on-market for RENTAL listings here right now (not sales)? A rising rental-DOM trend means longer vacancies and softer asking-rent achievability than the comps imply.
- What's the recent tenant-quality profile in this submarket — average credit score on applications, eviction rate, late-payment / NSF rate, and stable-employment percentage? A property-management company in the area should have these aggregated.
- How much new for-sale + rental construction is in the pipeline within 1–3 miles? Heavy new supply typically softens prices + rents 12–24 months out; constrained supply supports both.
Investment metrics
- 1% rule
- 0.99% ✗
- Cap rate
- 6.54%
- Cash-on-cash
- 0.88%
- DSCR
- 1.04
- GRM
- 8.4
CMA / ARV
- ARV (median comp)
- $181,560
- List price
- $175,000
- Delta
- -3.61%
- Verdict
- FAIR
- Comps
- 8 within 1.0 mi
Show comp detail 4 sales within ~0.75 mi
| Address | Dist | Beds/Ba | Sqft | Sold | Price | $/sf | Match |
|---|---|---|---|---|---|---|---|
| 5030 Edgecliff Dr | 0.23mi | 3/2.0 | 1,616 (+2%) | 16mo | $222,500 | $138 | 72 |
| 1709 Cliffside Dr | 0.40mi | 3/2.0 | 1,485 (-6%) | 8mo | $175,000 | $118 | 65 |
| 4815 Earl | 0.48mi | 3/2.0 | 1,471 (-7%) | 17mo | $209,900 | $143 | 52 |
| 4806 Marsha Ln | 0.55mi | 3/2.0 | 1,352 (-14%) | 21mo | $157,500 | $116 | 33 |
Match score weights: distance 35% · size 25% · config 20% · recency 20%. Top-matched comps best support the ARV.
Projected returns pro-forma
-3.0% appreciation · 3.0% rent growth · sell at horizon
- IRR
- -17.4%
- Equity multiple
- 0.38×
- Total profit
- $-30,165
- Equity at exit
- $26,093
- IRR
- -9.3%
- Equity multiple
- 0.42×
- Total profit
- $-28,202
- Equity at exit
- $15,131
Cash invested: $49,000 (down + closing). Projections, not guarantees.
Landlord ↔ Tenant lean methodology
- Overall (STATE)
- 87 Strongly Landlord-Friendly
- State Texas
- 87 Strongly Landlord-Friendly · R+5
- County
- — inherits STATE
- City
- — inherits STATE
ZIP-level market 76302
- Home prices YoY
- -34.7%
- Active inventory
- 75
- Price-to-rent
- 8.4×
Monthly cashflow live
- Estimated rent
- $1,730 high interval (Pro) →
- Mortgage (P&I)
- −$918
- Tax from tax record
- −$341 /mo · $4,087/yr
- Insurance
- −$73
- Flood insurance flood zone
- −$66 /mo · $798/yr
- HOA
- −$0
- Vacancy / Maint / Mgmt
- −$363
- Net cashflow
- $-31
Break-even live
UW: 25.0% down · 7.5% · 30yr · 1.5% tax · 5.0% vac · 8.0% maint · 8.0% mgmt
Financing live
Cash to close
- Down payment
- $43,750
- Closing costs
- $5,250
- Reserves months
- —
- Total cash needed
- —
Loan-product check · same deal, 3 products live
Conventional
25% down · 7.5% · 30yr
- Down + closing
- —
- Monthly P&I
- —
- Monthly cashflow
- —
- DSCR
- —
- Eligible?
- —
Personal DTI + credit; lowest rate.
DSCR
20% down · 8.5% · 30yr
- Down + closing
- —
- Monthly P&I
- —
- Monthly cashflow
- —
- DSCR
- —
- Eligible?
- —
No personal income docs; deal must DSCR.
Hard money
10% down · 12.0% · 12mo
- Down + closing
- —
- Monthly P&I
- —
- Monthly cashflow
- —
- DSCR
- —
- Eligible?
- —
Short-term bridge; refi at stabilization.
Rent comps 5 comps
| Address | Beds | Baths | Sqft | Rent | $/sqft | DOM | Units | Dist |
|---|---|---|---|---|---|---|---|---|
| 5021 Taft Blvd Wichita Falls, TX | 1.0–3.0 | 1.0–2.0 | 1236 | $1,775 | $1.44 | 44d | 8 | 0.42mi |
| 2612 Southwest Pkwy Wichita Falls, TX | 1.0–2.0 | 1.0–2.0 | 987 | $1,250 | $1.27 | 44d | 23 | 0.71mi |
| 1556 Singleton Ave Wichita Falls, TX | 3.0 | 2.0 | 1830 | $1,950 | $1.07 | 44d | 1 | 0.78mi |
| 4739 Augusta Ln Wichita Falls, TX | 3.0 | 2.0 | 1600 | $1,600 | $1.00 | 44d | 1 | 0.82mi |
| 4000 Weeks Park Ln Wichita Falls, TX | 1.0–3.0 | 1.0–2.0 | 870 | $1,425 | $1.64 | 44d | 12 | 1.09mi |
Listing history 21 events
-
2026-06-19days on market $175,000 Active 198 DOM
-
2026-06-18days on market $175,000 Active 197 DOM
-
2026-06-17days on market $175,000 Active 196 DOM
-
2026-06-16days on market $175,000 Active 195 DOM
-
2026-06-15days on market $175,000 Active 194 DOM
-
2026-06-14days on market $175,000 Active 192 DOM
-
2026-06-13days on market $175,000 Active 191 DOM
-
2026-06-10days on market $175,000 Active 189 DOM
-
2026-06-09days on market $175,000 Active 188 DOM
-
2026-06-08days on market $175,000 Active 187 DOM
-
2026-06-07days on market $175,000 Active 186 DOM
-
2026-06-05days on market $175,000 Active 183 DOM
-
2026-06-02days on market $175,000 Active 181 DOM
-
2026-06-01days on market $175,000 Active 180 DOM
-
2026-05-31days on market $175,000 Active 179 DOM
-
2026-05-30days on market $175,000 Active 178 DOM
-
2026-04-22price $175,000 449-char remark
Show marketing remark (449 chars)
Lovely on Lake Park! This generationally owned 3bd, 1.5bth home features TWO living areas, hardwood floors, remodeled bth, vintage details, distinctive design touches. The property also includes brick fireplace, 2 car garage, large covered patio, defined planting beds, mature landscaping, HUGE fenced backyard, over 1/4 acre, & adjacent to Bill Bartley Branch YMCA. Highly motivated seller - bring an offer! Call today to schedule your tour!
-
2025-12-02$179,500 Active 449-char remark
Show marketing remark (449 chars)
Lovely on Lake Park! This generationally owned 3bd, 1.5bth home features TWO living areas, hardwood floors, remodeled bth, vintage details, distinctive design touches. The property also includes brick fireplace, 2 car garage, large covered patio, defined planting beds, mature landscaping, HUGE fenced backyard, over 1/4 acre, & adjacent to Bill Bartley Branch YMCA. Highly motivated seller - bring an offer! Call today to schedule your tour!
-
2025-10-09price $179,500
-
2025-05-25price $180,500
-
2021-07-12soldstatus
ⓘ Source: listings_history table (triggers on properties + properties_extension) + one-shot
backfill from property_details.listing_events for pre-trigger history.
Tax reassessment forecast TX · Resets to sale price
- Current annual tax
- $4,087 · $341/mo
- Projected year-2 tax
- $4,087 · $341/mo
- Expected delta
- $0/yr ($0/mo · 0.0%)
ⓘ Screening estimate from a state-policy table — verify with the county assessor before closing.
Climate risk First Street
- Flood 7/10 Severe FEMA zone X (shaded) · 77% chance over 30 yrs
- Wildfire 7/10 Severe
- Heat 7/10 Severe 7 d/yr ≥109°F today · 21 d/yr by 30 yrs out
- Wind 4/10 Moderate 10% chance of damaging wind over 30 yrs
- Air quality 1/10 Low 0 unhealthy d/yr today · 0 by 30 yrs out
Nearby sold comps map
Loading sold comps map…
Walkable amenities ~0.75 mi
Loading nearby amenities…
Taxation est. · year 1
- Rental income
- $20,765
- − Mortgage interest
- −$9,803
- − Property taxes
- −$4,087
- − Insurance
- −$1,672
- − Repairs & maintenance
- −$1,661
- − Management
- −$1,661
- − Depreciation
- −$5,091
- Taxable loss
- −$3,210
- Est. tax savings @ 24.0%
- +$770
- After-tax cash flow
- $403/yr
For passive investors: Depreciation is non-cash, so a rental often shows a tax loss while cash-flowing — sheltering income. Rental losses are passive: they offset passive income freely, and up to $25,000/yr can offset ordinary (W-2) income if you actively participate and your MAGI is under $100k (phasing out to $0 by $150k); unused losses carry forward. On sale, claimed depreciation is recaptured at up to 25%, and gains may owe capital-gains tax (a 1031 exchange can defer both). Figures are a year-1 estimate at your 24.0% rate — not tax advice; consult a CPA.
Schools (NCES district)
- District
- Wichita Falls ISD
- NCES district ID
- 4845780
- Math proficiency
- 31% ▼ -10.00%
- Reading proficiency
- 33% ▼ -7.00%
- Median HH income
- $41,604
- Composite
- 27.06/100
- National rank
- #7051
- State rank
- #585 of 826 in TX
Livability — Wichita Falls
- Score
- 69/100
- State rank
- #437
- US rank
- #8940
Category grades
Schools grade is shown separately in the Schools card above.
Census & demographics
- Census place
- Wichita Falls, TX
- County
- Wichita County · 95,694 people
- City population
- 95,694
- Metro
- Wichita Falls, TX
- Population (ZIP)
- 11,932
- Household income
- $59,590
- Rent vs Own
- Severe rent burden
- 478.0
Population outlook (Wichita County) Hauer SSP2
- Today (2025)
- 129,638 people
- By 2030
- 128,366 · -1.0%
- By 2040
- 124,466 · -4.0%
- By 2050
- 120,499 · -7.0%
- By 2075
- 113,884 · -12.2%
- By 2100
- 101,818 · -21.5%
Race, ethnicity, and origin ACS 2023
- Neighborhood character
- Diverse neighborhood (Simpson 0.55)
- Race & ethnicity
- White 63% Hispanic / Latino 19% Black 11% Two or more races 8% Asian 4%
- Hispanic origin (detail)
- Mexican 15% Puerto Rican 1%
- Common ancestry
- Slovak 2% Romanian 1% Iranian 1%
- Foreign-born
- 7% · Canada
- Languages at home
- 85% English-only · Spanish 10% Other Asian/Pacific 3% Russian/Polish/Slavic 1%
Political lean MEDSL · Wichita
- 2024 margin
- Solid R (+44.0) · D 27.5% · R 71.5%
- 2008→2024 swing
- -5.2pp toward R · 2008: -38.9pp · 2024: -44.0pp
- All cycles
- 2024: R+44.0 2020: R+41.1 2016: R+49.7 2012: R+47.1 2008: R+38.9
Not yet ingested
- Civics
- —
Market trends
- HPI YoY
- ▼ -101.67%
- Current HPI
- 191.4059
- Rent YoY
- —
- Metro
- Wichita Falls, TX
- State GDP YoY
- ▲ 3.95%
- F500 in state
- 110
Industry mix (Fortune 500 HQ in TX)
| Industry | F500 HQs | Revenue |
|---|---|---|
| Energy | 16 | $1,198B |
|
||
| Technology | 5 | $198B |
|
||
| Engineering / Construction | 4 | $72B |
|
||
| Energy Services | 3 | $60B |
|
||
| Utilities | 3 | $41B |
|
||
| Healthcare | 2 | $330B |
|
||
Price history
-3.0% since first listed5 events — show timeline
- 2026-04-22 Price Changed $175,000 WFAOR
- 2025-12-02 Listed $179,500 WFAOR
- 2025-10-09 Price Changed $179,500 WFAOR
- 2025-05-25 Price Changed $180,500 WFAOR
- 2021-07-12 Sold (Public Records) — Public Records
Property tax history
+5.9%/yrLatest (2025): $4,087 · -2.0% YoY. Source: county tax records.
Cash-flow waterfall
monthlySold comps — $/sqft
last 12 mo · ≤1 miLoading sold comps…