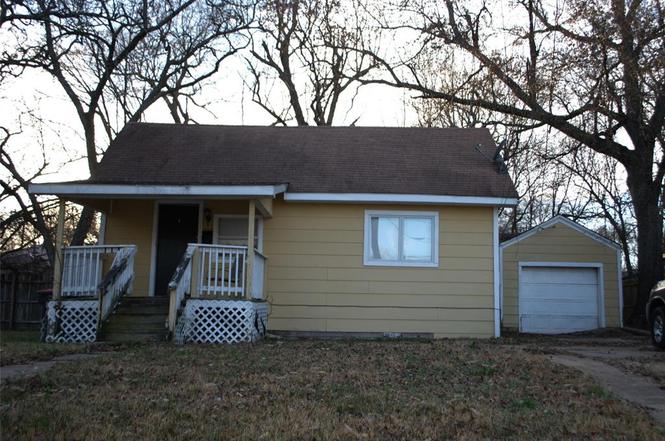
108 SE 22nd St · Paris, TX
Flood risk 1/10 · Minimal
- FEMA flood zone
- X (unshaded)
- Chance of flooding over 30 yrs
- 0.0%
- Est. flood insurance / yr
- $507 – $1,088
Fire risk 6/10 · Moderate
- Est. fire insurance / yr
- $1,222 – $2,270
Heat risk 7/10 · Major
- Hot days now (above 110°F)
- 7 days/yr
- Hot days in 30 yrs
- 22 days/yr
Wind risk 4/10 · Minor
- Chance of severe wind over 30 yrs
- 19.0%
Air-quality risk 2/10 · Minimal
- Unhealthy air days now
- 0 days/yr
- Unhealthy air days in 30 yrs
- 1 days/yr
Risk factors via First Street. Map © Google.
Why this score? — see what drove the B- grade
The composite is a weighted blend of 9 inputs, each scored 0–100. Each bar is that input's sub-score; the figure is the points it added to the 100-point composite (weight × sub-score).
- Cash flow +30.0/30.0
- 1% rule +10.0/10.0
- DSCR +10.0/10.0
- ARV discount +7.5/15.0
- Livability +3.1/5.0
- Schools +3.0/10.0
- Rent growth +2.5/5.0
- Condition / age +2.5/5.0
- Appreciation +0.0/10.0
$60,000
🖨 Deal sheet 📄 Offer letter ✓ Due diligence
Listing remarks
Opportunity awaits! This three-bedroom, 2-bath pier and beam home with low-maintenance offers great potential for the right buyer. Property is being sold AS-IS and will require significant TLC. Perfect for investors and renovation projects. Cash offers only. Bring your creativity and turn this into a great investment opportunity!!
Key facts
- 8,276 sq ft lot
- Garage
- Built 1960
Property features AI
Finance
- Financial info: Second mortgage: none; Loan type: Treat As Clear
- HOA & community: No homeowners association
Exterior
- Parking: 1-car garage; Garage faces front; Concrete parking surfaces; No covered or carport spaces reported
- Utilities: City water; City sewer; Electricity available; Cable available
- Home design: Single-family residence; Residential property; One story; Subdivision: City of Paris
- Construction: Siding exterior; Built in 1960
- Exterior features: Concrete driveway/walks; Curbs
Interior
- Kitchen: Built-in cabinets; Dual sinks; Solid surface (non-natural) countertops; Utility area in kitchen; Dishwasher; Electric oven; Refrigerator; Electric water heater
- Bedrooms: 3 bedrooms (all on the main level); Primary bedroom approx. 14 x 14; Additional primary bedroom/primary bathrm listed (19 x 15) — multiple primary-designated rooms noted; Third bedroom approx. 11 x 12
- Flooring: Tile flooring; Wood flooring
- Bathrooms: 2 full bathrooms (both on the main level); Bathrooms include built-in cabinets, linen closet, medicine cabinet, and solid surface counters in at least one bath; One bath features dual sinks and built-in cabinets
- Interior features: Cable TV available; High-speed internet available; 10 total rooms; One living area; One dining area; Levels: One
- Laundry & utility: Full-size washer/dryer area; Washer hookup; Electric dryer hookup; Utility room; Separate utility room with space for freezer and utility closet (approx. 9 x 10)
Neighborhood map
What this means for you Summary
Snapshot
- This is a 3-bed/1.0-bath single-family listed at $60k.
Deal economics
- At list price, monthly cash flow is $572 ($7k/yr) — positive.
- The deal already cash-flows at list — no discount required.
- Meets the 1% rule at list price ($1k rent vs $60k).
- Recommended offer: $56k (6.0% below list) — sets the bar for market timing.
- Cap rate 17.7% vs local median 3.6% in Paris — top-decile yield for the area; either an underpriced asset or a hidden risk that comps aren't pricing in. Stress-test before assuming the spread holds.
Location & tenants
- Location reads 61/100 on livability (#984 in TX) — a middle-class / working-renter tenant base. Strengths: cost of living A+, housing A+; Watch: crime F, amenities F, commute F.
- Paris ISD (town): math 36% / reading 37% proficiency, ranked #521 of 826 in TX (top 63%) — families likely to look elsewhere, expect single-tenant / working-renter base with shorter leases; 70% free/reduced lunch — lower-income household profile, screen leases tightly.
- Zoned schools: Givens Early Childhood Center (103 students, 93% FRL) — zoned schools average 93% FRL vs 70% district-wide (23 pts higher); higher-poverty schools than district average — tighter screening recommended.
- Market conditions: 274 active listings in the ZIP; 3 comparable units currently listed for rent nearby; rentals lingering (median 44d on market — plan ~5-8 weeks vacancy on turnover, expect pricing pressure); 100% of comp listings sitting > 30 days — soft ceiling on asking rent; 119 units permitted in Lamar County in 2024 (71 in 5+ unit buildings).
- This rent runs 36% of the median local income ($46k/yr) — at the standard rent-burdened threshold; future hikes will face affordability resistance.
Forward outlook
- Local home prices are declining (-3.0%/yr); year-one equity from $415 of loan paydown is wiped out by about $2k of value loss. Plan a longer hold.
- Lamar County population projected at -13% by 2050 — secular population decline; favor cash flow + early exit over multi-decade hold.
- At projected returns (-3.0% appreciation + 3.0% rent growth), your $17k cash investment doubles in ~3 years — after that, you're playing with house money.
Negotiation context
- It's been on market 84 days — a 6% lower offer ($56k) is reasonable based on typical stale-listing flexibility.
Risks & watch-outs
- Watch-outs: property tax is 3.7% of price.
- Climate carrying-cost: major wildfire risk; extreme-heat days projected 7→22/yr by 2055 (HVAC capex compounding) — expect insurance premiums to compound above CPI over the hold.
Questions for the listing agent
- It's been on market 84 days. Have you received any prior offers? Is the seller open to a 6% concession, seller financing, or rate buy-down credit?
- Built in 1960 — when were the roof, HVAC, electrical panel, plumbing, and water heater last replaced?
- Property tax is high relative to price — has the assessment been appealed recently, and will the sale trigger a re-assessment?
- Why hasn't it sold? Are there any deal-killer items the seller is aware of (foundation, flood, title, zoning, code violations)?
- Is there a deadline driving the sale (1031 exchange, divorce, estate, relocation)? That informs how much negotiation room exists.
- Schools are D-rated, which usually means shorter tenancies and higher turnover. Who's the typical renter profile here, and what's been the actual vacancy rate?
- Crime grade is F in this area — have there been break-ins, vandalism, or insurance claims at this property in the last 3 years? What carrier currently insures it and at what premium?
- What's the average days-on-market for RENTAL listings here right now (not sales)? A rising rental-DOM trend means longer vacancies and softer asking-rent achievability than the comps imply.
- What's the recent tenant-quality profile in this submarket — average credit score on applications, eviction rate, late-payment / NSF rate, and stable-employment percentage? A property-management company in the area should have these aggregated.
- How much new for-sale + rental construction is in the pipeline within 1–3 miles? Heavy new supply typically softens prices + rents 12–24 months out; constrained supply supports both.
Investment metrics
- 1% rule
- 2.31% ✓
- Cap rate
- 17.72%
- Cash-on-cash
- 40.83%
- DSCR
- 2.82
- GRM
- 3.6
CMA / ARV
- ARV (on-the-fly)
- $165,288
- Comps found
- 12
Show comp detail 12 sales within ~0.75 mi
| Address | Dist | Beds/Ba | Sqft | Sold | Price | $/sf | Match |
|---|---|---|---|---|---|---|---|
| 108 SE 22nd St | 0.00mi | 3/2.0 | 1,704 (0%) | 1mo | $60,000 | $35 | 95 |
| 2240 Hubbard | 0.11mi | 3/1.0 | 1,644 (-4%) | 1mo | $159,900 | $97 | 88 |
| 693 SE 25th St | 0.42mi | 3/1.0 | 1,580 (-7%) | 1mo | $95,000 | $60 | 68 |
| 831 17th St SE | 0.50mi | 3/2.0 | 1,784 (+5%) | 1mo | $135,000 | $76 | 64 |
| 1745 E Cherry | 0.45mi | 3/2.0 | 1,569 (-8%) | 2mo | $195,000 | $124 | 60 |
| 841 20th St SE | 0.45mi | 3/2.0 | 1,575 (-8%) | 10mo | $169,000 | $107 | 54 |
| 2465 Highland Rd | 0.60mi | 3/2.0 | 1,566 (-8%) | 2mo | $219,900 | $140 | 53 |
| 1347 E Houston St | 0.49mi | 2/2.0 (-1) | 1,542 (-10%) | 2mo | $79,000 | $51 | 51 |
| 2025 Cedar St | 0.59mi | 3/2.0 | 1,552 (-9%) | 4mo | $164,500 | $106 | 50 |
| 3025 E Houston St | 0.65mi | 2/1.0 (-1) | 1,528 (-10%) | 2mo | $123,000 | $80 | 46 |
| 1910 E Polk St | 0.56mi | 3/2.0 | 1,908 (+12%) | 6mo | $149,000 | $78 | 45 |
| 2965 Mahaffey Ln | 0.72mi | 3/2.0 | 1,594 (-6%) | 8mo | $199,900 | $125 | 44 |
Match score weights: distance 35% · size 25% · config 20% · recency 20%. Top-matched comps best support the ARV.
Projected returns pro-forma
-3.0% appreciation · 3.0% rent growth · sell at horizon
- IRR
- 37.4%
- Equity multiple
- 2.59×
- Total profit
- $26,768
- Equity at exit
- $8,946
- IRR
- 44.0%
- Equity multiple
- 5.20×
- Total profit
- $70,543
- Equity at exit
- $5,188
Cash invested: $16,800 (down + closing). Projections, not guarantees.
Landlord ↔ Tenant lean methodology
- Overall (STATE)
- 87 Strongly Landlord-Friendly
- State Texas
- 87 Strongly Landlord-Friendly · R+5
- County
- — inherits STATE
- City
- — inherits STATE
ZIP-level market 75460
- Active inventory
- 274
- Price-to-rent
- 3.6×
Monthly cashflow live
- Estimated rent
- $1,388 medium interval (Pro) →
- Mortgage (P&I)
- −$315
- Tax from tax record
- −$185 /mo · $2,221/yr
- Insurance
- −$25
- HOA
- −$0
- Vacancy / Maint / Mgmt
- −$291
- Net cashflow
- $572
Break-even live
UW: 25.0% down · 7.5% · 30yr · 1.5% tax · 5.0% vac · 8.0% maint · 8.0% mgmt
Financing live
Cash to close
- Down payment
- $15,000
- Closing costs
- $1,800
- Reserves months
- —
- Total cash needed
- —
Loan-product check · same deal, 3 products live
Conventional
25% down · 7.5% · 30yr
- Down + closing
- —
- Monthly P&I
- —
- Monthly cashflow
- —
- DSCR
- —
- Eligible?
- —
Personal DTI + credit; lowest rate.
DSCR
20% down · 8.5% · 30yr
- Down + closing
- —
- Monthly P&I
- —
- Monthly cashflow
- —
- DSCR
- —
- Eligible?
- —
No personal income docs; deal must DSCR.
Hard money
10% down · 12.0% · 12mo
- Down + closing
- —
- Monthly P&I
- —
- Monthly cashflow
- —
- DSCR
- —
- Eligible?
- —
Short-term bridge; refi at stabilization.
Rent comps 3 comps
| Address | Beds | Baths | Sqft | Rent | $/sqft | DOM | Units | Dist |
|---|---|---|---|---|---|---|---|---|
| 2246 Simpson St Paris, TX | 3.0 | 1.0 | 1508 | $1,250 | $0.83 | 43d | 1 | 0.28mi |
| 2121 Cedar St Paris, TX | 3.0 | 2.0 | 1394 | $2,000 | $1.43 | 43d | 1 | 0.58mi |
| 370 29th St NE Paris, TX | 3.0 | 1.0 | 1220 | $1,200 | $0.98 | 43d | 1 | 0.68mi |
Listing history 3 events
-
2026-05-15status Pending
-
2026-02-19$60,000 Active
-
2006-05-02soldstatus
ⓘ Source: listings_history table (triggers on properties + properties_extension) + one-shot
backfill from property_details.listing_events for pre-trigger history.
Tax reassessment forecast TX · Resets to sale price
- Current annual tax
- $2,221 · $185/mo
- Projected year-2 tax
- $2,221 · $185/mo
- Expected delta
- $0/yr ($0/mo · 0.0%)
ⓘ Screening estimate from a state-policy table — verify with the county assessor before closing.
Climate risk First Street
- Flood 1/10 Low FEMA zone X (unshaded) · 0% chance over 30 yrs
- Wildfire 6/10 Major
- Heat 7/10 Severe 7 d/yr ≥110°F today · 22 d/yr by 30 yrs out
- Wind 4/10 Moderate 19% chance of damaging wind over 30 yrs
- Air quality 2/10 Low 0 unhealthy d/yr today · 1 by 30 yrs out
Nearby sold comps map
Loading sold comps map…
Walkable amenities ~0.75 mi
Loading nearby amenities…
Taxation est. · year 1
- Rental income
- $16,652
- − Mortgage interest
- −$3,361
- − Property taxes
- −$2,221
- − Insurance
- −$300
- − Repairs & maintenance
- −$1,332
- − Management
- −$1,332
- − Depreciation
- −$1,745
- Taxable income
- $6,361
- Est. tax owed @ 24.0%
- −$1,527
- After-tax cash flow
- $5,332/yr
For passive investors: Depreciation is non-cash, so a rental often shows a tax loss while cash-flowing — sheltering income. Rental losses are passive: they offset passive income freely, and up to $25,000/yr can offset ordinary (W-2) income if you actively participate and your MAGI is under $100k (phasing out to $0 by $150k); unused losses carry forward. On sale, claimed depreciation is recaptured at up to 25%, and gains may owe capital-gains tax (a 1031 exchange can defer both). Figures are a year-1 estimate at your 24.0% rate — not tax advice; consult a CPA.
Schools (NCES district)
- District
- Paris ISD
- NCES district ID
- 4834290
- Math proficiency
- 36% ▼ -11.00%
- Reading proficiency
- 37% ▼ -1.00%
- Median HH income
- $31,515
- Composite
- 29.83/100
- National rank
- #6419
- State rank
- #521 of 826 in TX
Livability — Paris
- Score
- 61/100
- State rank
- #984
- US rank
- #17535
Category grades
Schools grade is shown separately in the Schools card above.
Census & demographics
- Census place
- Paris, TX
- County
- Lamar County · 23,426 people
- City population
- 23,426
- Metro
- Paris, TX
- Population (ZIP)
- 23,426
- Household income
- $46,473
- Rent vs Own
- Severe rent burden
- 1355.0
Population outlook (Lamar County) Hauer SSP2
- Today (2025)
- 48,319 people
- By 2030
- 47,160 · -2.4%
- By 2040
- 44,621 · -7.7%
- By 2050
- 42,024 · -13.0%
- By 2075
- 36,577 · -24.3%
- By 2100
- 30,580 · -36.7%
Race, ethnicity, and origin ACS 2023
- Neighborhood character
- Diverse neighborhood (Simpson 0.60)
- Race & ethnicity
- White 58% Black 22% Hispanic / Latino 13% Two or more races 8%
- Hispanic origin (detail)
- Mexican 12%
- Common ancestry
- Lithuanian 1% Slovak 1% Italian 1%
- Foreign-born
- 3% · Canada, China
- Languages at home
- 92% English-only · Spanish 7%
Political lean MEDSL · Lamar
- 2024 margin
- Solid R (+61.0) · D 19.2% · R 80.3%
- 2008→2024 swing
- -19.1pp toward R · 2008: -42.0pp · 2024: -61.0pp
- All cycles
- 2024: R+61.0 2020: R+57.4 2016: R+59.2 2012: R+50.3 2008: R+42.0
Not yet ingested
- Civics
- —
Market trends
- HPI YoY
- ▼ -201.50%
- Current HPI
- 145.3511
- Rent YoY
- —
- Metro
- Paris, TX
- State GDP YoY
- ▲ 3.95%
- F500 in state
- 110
Industry mix (Fortune 500 HQ in TX)
| Industry | F500 HQs | Revenue |
|---|---|---|
| Energy | 16 | $1,198B |
|
||
| Technology | 5 | $198B |
|
||
| Engineering / Construction | 4 | $72B |
|
||
| Energy Services | 3 | $60B |
|
||
| Utilities | 3 | $41B |
|
||
| Healthcare | 2 | $330B |
|
||
Price history
3 events — show timeline
- 2026-05-15 Pending — NTREIS
- 2026-02-19 Listed $60,000 NTREIS
- 2006-05-02 Sold (Public Records) — Public Records
Property tax history
+5.0%/yrLatest (2025): $2,221 · +1.2% YoY. Source: county tax records.
Cash-flow waterfall
monthlySold comps — $/sqft
last 12 mo · ≤1 miLoading sold comps…