1722 Coca Cola Lake Rd · Genoa, AR
Flood risk 1/10 · Minimal
- FEMA flood zone
- X (unshaded)
- Chance of flooding over 30 yrs
- 0.0%
- Est. flood insurance / yr
- $507 – $1,088
Fire risk 7/10 · Major
- Est. fire insurance / yr
- $1,499 – $2,785
Heat risk 6/10 · Moderate
- Hot days now (above 111°F)
- 7 days/yr
- Hot days in 30 yrs
- 22 days/yr
Wind risk 5/10 · Moderate
- Chance of severe wind over 30 yrs
- 26.0%
Air-quality risk 1/10 · Minimal
- Unhealthy air days now
- 0 days/yr
- Unhealthy air days in 30 yrs
- 0 days/yr
Risk factors via First Street. Map © Google.
Why this score? — see what drove the C grade
The composite is a weighted blend of 9 inputs, each scored 0–100. Each bar is that input's sub-score; the figure is the points it added to the 100-point composite (weight × sub-score).
- Cash flow +25.1/30.0
- DSCR +8.2/10.0
- ARV discount +7.5/15.0
- 1% rule +6.6/10.0
- Schools +5.0/10.0
- Rent growth +2.5/5.0
- Livability +2.5/5.0
- Condition / age +2.5/5.0
- Appreciation +0.0/10.0
$139,900
🖨 Deal sheet 📄 Offer letter ✓ Due diligence
Listing remarks
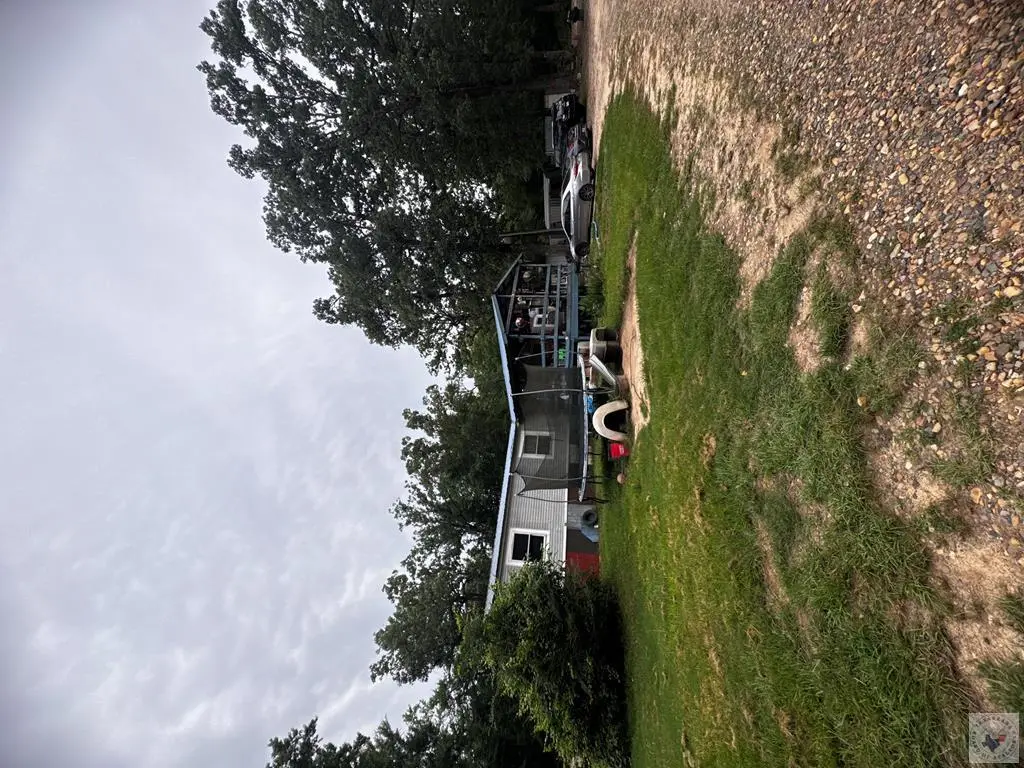
Rare Multi-Residence Opportunity on 4.14 Acres in Genoa School District this unique property offers incredible flexibility for multi-generational living, rental income potential, or a private country retreat with room to grow. The property features a spacious 4 Bedroom, 2 Bath Triple-Wide Manufactured Home serving as the primary residence, along with a separate 3 Bedroom, 2 Bath Single-Wide Home—perfect for extended family, guests, or investment opportunities. Outside, you'll find multiple storage and utility buildings designed to accommodate hobbies, equipment, animals, or recreational needs, including: ? 9x16 Outbuilding ? 8x12 Outbuilding ? 12x20 Lean-To ? 18x20 Carport Enjoy the
Key facts
- Covered parking
- Country setting
- 4.14 acres
Tags
Property features AI
Finance
- Other: Approximately 4.14 acres
Exterior
- Home design: Single Family Residence; One level; Single wide / Triple wide mobile home body types
- Construction: Metal roof; Pillar/post/pier foundation; Built as residential single family
- Exterior features: Chain link fencing; Gravel road access
Interior
- Flooring: Laminate
- Bathrooms: 2 full bathrooms
- Interior features: Laminate flooring; Wood-burning fireplace (1)
Neighborhood map
What this means for you Summary
Snapshot
- This is a 4-bed/1.0-bath manufactured listed at $140k.
Deal economics
- At list price, monthly cash flow is $310 ($4k/yr) — positive.
- The deal already cash-flows at list — no discount required.
- Meets the 1% rule at list price ($2k rent vs $140k).
- Recommended offer: $138k (1.5% below list) — sets the bar for market timing.
Location & tenants
- Location reads: area grade C — affects rentability + tenant quality, not the cash-flow math above.
- Genoa Central School District (rural): math 60% / reading 57% proficiency, ranked #6 of 238 in AR (top 2%) — acceptable for families but not a draw, mixed tenant base, ~2y average lease.
- Market conditions: 273 active listings in the ZIP; 21 units permitted in Miller County in 2024 (0 in 5+ unit buildings).
- This rent runs 41% of the median local income ($47k/yr) — at the standard rent-burdened threshold; future hikes will face affordability resistance.
Forward outlook
- Local home prices are declining (-3.0%/yr); year-one equity from $967 of loan paydown is wiped out by about $4k of value loss. Plan a longer hold.
- Miller County population projected to shrink 7% by 2050 — rents likely to lag national; underwrite the cash flow, not the appreciation.
Negotiation context
- It's been on market 17 days — a 2% lower offer ($138k) is reasonable based on typical stale-listing flexibility.
- Current owner paid $13k; list at $140k implies a 976% gain — meaningful room to come down on a strong offer.
Risks & watch-outs
- Climate carrying-cost: moderate wind risk, 26% chance of damaging wind over 30y; major wildfire risk; extreme-heat days projected 7→22/yr by 2055 (HVAC capex compounding) — expect insurance premiums to compound above CPI over the hold.
Questions for the listing agent
- Is there a deadline driving the sale (1031 exchange, divorce, estate, relocation)? That informs how much negotiation room exists.
- What's the average days-on-market for RENTAL listings here right now (not sales)? A rising rental-DOM trend means longer vacancies and softer asking-rent achievability than the comps imply.
- What's the recent tenant-quality profile in this submarket — average credit score on applications, eviction rate, late-payment / NSF rate, and stable-employment percentage? A property-management company in the area should have these aggregated.
- How much new for-sale + rental construction is in the pipeline within 1–3 miles? Heavy new supply typically softens prices + rents 12–24 months out; constrained supply supports both.
Investment metrics
- 1% rule
- 1.16% ✓
- Cap rate
- 8.95%
- Cash-on-cash
- 9.49%
- DSCR
- 1.42
- GRM
- 7.2
CMA / ARV
No comps found within radius.
Projected returns pro-forma
-3.0% appreciation · 3.0% rent growth · sell at horizon
- IRR
- -2.0%
- Equity multiple
- 0.93×
- Total profit
- $-2,919
- Equity at exit
- $20,860
- IRR
- 7.7%
- Equity multiple
- 1.59×
- Total profit
- $22,959
- Equity at exit
- $12,096
Cash invested: $39,172 (down + closing). Projections, not guarantees.
Landlord ↔ Tenant lean methodology
- Overall (STATE)
- 92 Strongly Landlord-Friendly
- State Arkansas
- 92 Strongly Landlord-Friendly · R+14
- County
- — inherits STATE
- City
- — inherits STATE
ZIP-level market 71854
- Home prices YoY
- -16.9%
- Active inventory
- 273
- Price-to-rent
- 7.2×
Monthly cashflow live
- Estimated rent
- $1,616 medium interval (Pro) →
- Mortgage (P&I)
- −$734
- Tax est. 1.5%
- −$175 /mo · $2,098/yr
- Insurance
- −$58
- HOA
- −$0
- Vacancy / Maint / Mgmt
- −$339
- Net cashflow
- $310
Break-even live
UW: 25.0% down · 7.5% · 30yr · 1.5% tax · 5.0% vac · 8.0% maint · 8.0% mgmt
Financing live
Cash to close
- Down payment
- $34,975
- Closing costs
- $4,197
- Reserves months
- —
- Total cash needed
- —
Loan-product check · same deal, 3 products live
Conventional
25% down · 7.5% · 30yr
- Down + closing
- —
- Monthly P&I
- —
- Monthly cashflow
- —
- DSCR
- —
- Eligible?
- —
Personal DTI + credit; lowest rate.
DSCR
20% down · 8.5% · 30yr
- Down + closing
- —
- Monthly P&I
- —
- Monthly cashflow
- —
- DSCR
- —
- Eligible?
- —
No personal income docs; deal must DSCR.
Hard money
10% down · 12.0% · 12mo
- Down + closing
- —
- Monthly P&I
- —
- Monthly cashflow
- —
- DSCR
- —
- Eligible?
- —
Short-term bridge; refi at stabilization.
Listing history 14 events
-
2026-06-19days on market $139,900 Active 17 DOM
-
2026-06-18days on market $139,900 Active 16 DOM
-
2026-06-17days on market $139,900 Active 15 DOM
-
2026-06-16days on market $139,900 Active 14 DOM
-
2026-06-15days on market $139,900 Active 13 DOM
-
2026-06-14days on market $139,900 Active 11 DOM
-
2026-06-13days on market $139,900 Active 10 DOM
-
2026-06-10days on market $139,900 Active 8 DOM
-
2026-06-09days on market $139,900 Active 7 DOM
-
2026-06-08days on market $139,900 Active 6 DOM
-
2026-06-07days on market $139,900 Active 5 DOM
-
2026-06-05days on market $139,900 Active 2 DOM
-
2026-06-03remarks 693-char remark
-
2026-06-03$139,900 Active 1 DOM
ⓘ Source: listings_history table (triggers on properties + properties_extension) + one-shot
backfill from property_details.listing_events for pre-trigger history.
Climate risk First Street
- Flood 1/10 Low FEMA zone X (unshaded) · 0% chance over 30 yrs
- Wildfire 7/10 Severe
- Heat 6/10 Major 7 d/yr ≥111°F today · 22 d/yr by 30 yrs out
- Wind 5/10 Major 26% chance of damaging wind over 30 yrs
- Air quality 1/10 Low 0 unhealthy d/yr today · 0 by 30 yrs out
Nearby sold comps map
Loading sold comps map…
Walkable amenities ~0.75 mi
Loading nearby amenities…
Taxation est. · year 1
- Rental income
- $19,391
- − Mortgage interest
- −$7,837
- − Property taxes
- −$2,098
- − Insurance
- −$700
- − Repairs & maintenance
- −$1,551
- − Management
- −$1,551
- − Depreciation
- −$4,070
- Taxable income
- $1,584
- Est. tax owed @ 24.0%
- −$380
- After-tax cash flow
- $3,337/yr
For passive investors: Depreciation is non-cash, so a rental often shows a tax loss while cash-flowing — sheltering income. Rental losses are passive: they offset passive income freely, and up to $25,000/yr can offset ordinary (W-2) income if you actively participate and your MAGI is under $100k (phasing out to $0 by $150k); unused losses carry forward. On sale, claimed depreciation is recaptured at up to 25%, and gains may owe capital-gains tax (a 1031 exchange can defer both). Figures are a year-1 estimate at your 24.0% rate — not tax advice; consult a CPA.
Schools (NCES district)
- District
- Genoa Central School District
- NCES district ID
- 0504110
- Math proficiency
- 60% ▼ -3.00%
- Reading proficiency
- 57% ▼ -1.00%
- Median HH income
- $46,716
- Composite
- 49.54/100
- National rank
- #1991
- State rank
- #6 of 238 in AR
Livability — Genoa
No livability data for this city. (Only ~50 U.S. cities are tracked.)
Census & demographics
- County
- Miller County · 35,720 people
- Metro
- Texarkana, TX-AR
- Population (ZIP)
- 35,720
- Household income
- $46,878
- Rent vs Own
- Severe rent burden
- 1388.0
Population outlook (Miller County) Hauer SSP2
- Today (2025)
- 44,197 people
- By 2030
- 43,844 · -0.8%
- By 2040
- 42,680 · -3.4%
- By 2050
- 41,024 · -7.2%
- By 2075
- 35,685 · -19.3%
- By 2100
- 28,325 · -35.9%
Race, ethnicity, and origin ACS 2023
- Neighborhood character
- Majority White (62%)
- Race & ethnicity
- White 62% Black 30% Hispanic / Latino 4% Two or more races 3%
- Common ancestry
- Lithuanian 1% Slovak 1%
- Foreign-born
- 2% · Canada
- Languages at home
- 98% English-only · Spanish 2%
Political lean MEDSL · Miller
- 2024 margin
- Solid R (+51.1) · D 23.9% · R 74.9% · Other 1.2%
- 2008→2024 swing
- -17.6pp toward R · 2008: -33.5pp · 2024: -51.1pp
- All cycles
- 2024: R+51.1 2020: R+46.4 2016: R+43.8 2012: R+39.8 2008: R+33.5
Not yet ingested
- Civics
- —
Market trends
- HPI YoY
- ▼ -40.00%
- Current HPI
- 196.7615
- Rent YoY
- —
- Metro
- Texarkana, TX-AR
- State GDP YoY
- ▲ 3.80%
- F500 in state
- 10
Industry mix (Fortune 500 HQ in AR)
| Industry | F500 HQs | Revenue |
|---|---|---|
| Retail | 1 | $681B |
|
||
| Food / Agriculture | 1 | $53B |
|
||
| Retail / Energy | 1 | $22B |
|
||
| Transportation / Logistics | 1 | $12B |
|
||
| Energy | 1 | $4B |
|
||
Price history
+899.3% since first listed3 events — show timeline
- 2026-06-02 Listed $139,900 TBOR
- 1997-07-25 Sold (Public Records) $13,000 Public Records
- 1992-09-28 Sold (Public Records) $14,000 Public Records
Property tax history
+2.7%/yrLatest (2025): $243 · -17.3% YoY. Source: county tax records.
Cash-flow waterfall
monthlySold comps — $/sqft
last 12 mo · ≤1 miLoading sold comps…