 🏷️ Likely Rental
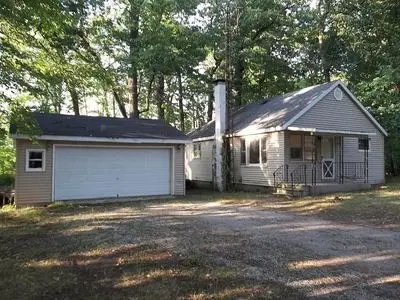
11304 E Dakota St · Koontz Lake, IN
Flood risk 1/10 · Minimal
- FEMA flood zone
- X (unshaded)
- Chance of flooding over 30 yrs
- 0.0%
- Est. flood insurance / yr
- $507 – $1,088
Fire risk 1/10 · Minimal
- Est. fire insurance / yr
- $717 – $1,331
Heat risk 2/10 · Minimal
- Hot days now (above 101°F)
- 7 days/yr
- Hot days in 30 yrs
- 16 days/yr
Wind risk 2/10 · Minimal
- Chance of severe wind over 30 yrs
- —
Air-quality risk 2/10 · Minimal
- Unhealthy air days now
- 1 days/yr
- Unhealthy air days in 30 yrs
- 2 days/yr
Risk factors via First Street. Map © Google.
Why this score? — see what drove the C+ grade
The composite is a weighted blend of 9 inputs, each scored 0–100. Each bar is that input's sub-score; the figure is the points it added to the 100-point composite (weight × sub-score).
- Cash flow +23.3/30.0
- ARV discount +15.0/15.0
- DSCR +7.5/10.0
- 1% rule +5.6/10.0
- Livability +3.1/5.0
- Rent growth +2.5/5.0
- Condition / age +2.5/5.0
- Schools +2.3/10.0
- Appreciation +0.0/10.0
$114,900
🖨 Deal sheet 📄 Offer letter ✓ Due diligence
Listing remarks
Currently used as a rental home, rented to long term renter for $850 per month.
Key facts
- Built 1969
- Listed 23 days
Neighborhood map
What this means for you Summary
Snapshot
- This is a 1-bed/1.0-bath single-family listed at $115k.
Deal economics
- At list price, monthly cash flow is $210 ($3k/yr) — positive.
- The deal already cash-flows at list — no discount required.
- Meets the 1% rule at list price ($1k rent vs $115k).
- Recommended offer: $113k (1.5% below list) — sets the bar for market timing.
- Cap rate 8.5% vs local median 3.1% in Koontz Lake — top-decile yield for the area; either an underpriced asset or a hidden risk that comps aren't pricing in. Stress-test before assuming the spread holds.
Location & tenants
- Location reads 61/100 on livability (#516 in IN) — a middle-class / working-renter tenant base. Strengths: crime A+, cost of living A+, housing A-; Watch: employment D+, schools F, amenities F.
- Oregon-Davis School Corporation (rural): math 19% / reading 34% proficiency, ranked #257 of 301 in IN (top 85%) — low school quality limits family demand, transient renter base, plan for 1-2y turnover.
- Market conditions: 64 active listings in the ZIP; 58 units permitted in Starke County in 2024 (0 in 5+ unit buildings).
Forward outlook
- Local home prices are declining (-3.0%/yr); year-one equity from $794 of loan paydown is wiped out by about $3k of value loss. Plan a longer hold.
- Starke County population projected at -23% by 2050 — secular population decline; favor cash flow + early exit over multi-decade hold.
Negotiation context
- It's been on market 24 days — a 2% lower offer ($113k) is reasonable based on typical stale-listing flexibility.
Questions for the listing agent
- Built in 1969 — when were the roof, HVAC, electrical panel, plumbing, and water heater last replaced?
- Is there a deadline driving the sale (1031 exchange, divorce, estate, relocation)? That informs how much negotiation room exists.
- Schools are F-rated, which usually means shorter tenancies and higher turnover. Who's the typical renter profile here, and what's been the actual vacancy rate?
- What's the average days-on-market for RENTAL listings here right now (not sales)? A rising rental-DOM trend means longer vacancies and softer asking-rent achievability than the comps imply.
- What's the recent tenant-quality profile in this submarket — average credit score on applications, eviction rate, late-payment / NSF rate, and stable-employment percentage? A property-management company in the area should have these aggregated.
- How much new for-sale + rental construction is in the pipeline within 1–3 miles? Heavy new supply typically softens prices + rents 12–24 months out; constrained supply supports both.
Investment metrics
- 1% rule
- 1.06% ✓
- Cap rate
- 8.49%
- Cash-on-cash
- 7.84%
- DSCR
- 1.35
- GRM
- 7.9
CMA / ARV
- ARV (on-the-fly)
- $149,968
- Comps found
- 5
Show comp detail 5 sales within ~0.75 mi
| Address | Dist | Beds/Ba | Sqft | Sold | Price | $/sf | Match |
|---|---|---|---|---|---|---|---|
| 7993 N Tippecanoe Dr | 0.24mi | 2/1.0 (+1) | 773 (-6%) | 0mo | $290,000 | $375 | 73 |
| 7976 N Tecumseh Rd | 0.34mi | 2/1.0 (+1) | 900 (+9%) | 0mo | $92,000 | $102 | 64 |
| 8093 Tippecanoe Dr | 0.12mi | 2/1.0 (+1) | 700 (-15%) | 21mo | $330,000 | $471 | 47 |
| 7798 N Topinabee Rd | 0.53mi | 2/1.0 (+1) | 868 (+5%) | 23mo | $117,500 | $135 | 42 |
| 7713 N Tecumseh Rd | 0.55mi | 2/1.0 (+1) | 936 (+14%) | 14mo | $170,000 | $182 | 36 |
Match score weights: distance 35% · size 25% · config 20% · recency 20%. Top-matched comps best support the ARV.
Projected returns pro-forma
-3.0% appreciation · 3.0% rent growth · sell at horizon
- IRR
- -4.4%
- Equity multiple
- 0.84×
- Total profit
- $-5,249
- Equity at exit
- $17,132
- IRR
- 5.3%
- Equity multiple
- 1.39×
- Total profit
- $12,617
- Equity at exit
- $9,934
Cash invested: $32,172 (down + closing). Projections, not guarantees.
Landlord ↔ Tenant lean methodology
- Overall (STATE)
- 90 Strongly Landlord-Friendly
- State Indiana
- 90 Strongly Landlord-Friendly · R+11
- County
- — inherits STATE
- City
- — inherits STATE
ZIP-level market 46574
- Home prices YoY
- -17.2%
- Active inventory
- 64
- Price-to-rent
- 7.9×
Monthly cashflow live
- Estimated rent
- $1,214 medium interval (Pro) →
- Mortgage (P&I)
- −$603
- Tax from tax record
- −$98 /mo · $1,179/yr
- Insurance
- −$48
- HOA
- −$0
- Vacancy / Maint / Mgmt
- −$255
- Net cashflow
- $210
Break-even live
UW: 25.0% down · 7.5% · 30yr · 1.5% tax · 5.0% vac · 8.0% maint · 8.0% mgmt
Financing live
Cash to close
- Down payment
- $28,725
- Closing costs
- $3,447
- Reserves months
- —
- Total cash needed
- —
Loan-product check · same deal, 3 products live
Conventional
25% down · 7.5% · 30yr
- Down + closing
- —
- Monthly P&I
- —
- Monthly cashflow
- —
- DSCR
- —
- Eligible?
- —
Personal DTI + credit; lowest rate.
DSCR
20% down · 8.5% · 30yr
- Down + closing
- —
- Monthly P&I
- —
- Monthly cashflow
- —
- DSCR
- —
- Eligible?
- —
No personal income docs; deal must DSCR.
Hard money
10% down · 12.0% · 12mo
- Down + closing
- —
- Monthly P&I
- —
- Monthly cashflow
- —
- DSCR
- —
- Eligible?
- —
Short-term bridge; refi at stabilization.
Listing history 17 events
-
2026-06-19days on market $114,900 Active 24 DOM
-
2026-06-18days on market $114,900 Active 23 DOM
-
2026-06-17days on market $114,900 Active 22 DOM
-
2026-06-16days on market $114,900 Active 21 DOM
-
2026-06-15days on market $114,900 Active 20 DOM
-
2026-06-14days on market $114,900 Active 18 DOM
-
2026-06-12days on market $114,900 Active 17 DOM
-
2026-06-09days on market $114,900 Active 14 DOM
-
2026-06-08days on market $114,900 Active 13 DOM
-
2026-06-07days on market $114,900 Active 12 DOM
-
2026-06-07days on market $114,900 Active 11 DOM
-
2026-06-03days on market $114,900 Active 8 DOM
-
2026-06-02days on market $114,900 Active 7 DOM
-
2026-06-01days on market $114,900 Active 6 DOM
-
2026-05-31days on market $114,900 Active 5 DOM
-
2026-05-31days on market $114,900 Active 4 DOM
-
2026-05-26$114,900 Active
ⓘ Source: listings_history table (triggers on properties + properties_extension) + one-shot
backfill from property_details.listing_events for pre-trigger history.
Tax reassessment forecast IN · Partial reset (capped growth)
- Current annual tax
- $1,179 · $98/mo
- Projected year-2 tax
- $1,179 · $98/mo
- Expected delta
- $0/yr ($0/mo · 0.0%)
ⓘ Screening estimate from a state-policy table — verify with the county assessor before closing.
Climate risk First Street
- Flood 1/10 Low FEMA zone X (unshaded) · 0% chance over 30 yrs
- Wildfire 1/10 Low
- Heat 2/10 Low 7 d/yr ≥101°F today · 16 d/yr by 30 yrs out
- Wind 2/10 Low
- Air quality 2/10 Low 1 unhealthy d/yr today · 2 by 30 yrs out
Nearby sold comps map
Loading sold comps map…
Walkable amenities ~0.75 mi
Loading nearby amenities…
Taxation est. · year 1
- Rental income
- $14,563
- − Mortgage interest
- −$6,436
- − Property taxes
- −$1,179
- − Insurance
- −$574
- − Repairs & maintenance
- −$1,165
- − Management
- −$1,165
- − Depreciation
- −$3,343
- Taxable income
- $701
- Est. tax owed @ 24.0%
- −$168
- After-tax cash flow
- $2,353/yr
For passive investors: Depreciation is non-cash, so a rental often shows a tax loss while cash-flowing — sheltering income. Rental losses are passive: they offset passive income freely, and up to $25,000/yr can offset ordinary (W-2) income if you actively participate and your MAGI is under $100k (phasing out to $0 by $150k); unused losses carry forward. On sale, claimed depreciation is recaptured at up to 25%, and gains may owe capital-gains tax (a 1031 exchange can defer both). Figures are a year-1 estimate at your 24.0% rate — not tax advice; consult a CPA.
Schools (NCES district)
- District
- Oregon-Davis School Corporation
- NCES district ID
- 1808460
- Math proficiency
- 19% ▼ -13.00%
- Reading proficiency
- 34% ▼ -5.00%
- Median HH income
- $46,674
- Composite
- 22.93/100
- National rank
- #7991
- State rank
- #257 of 301 in IN
Livability — Koontz Lake
- Score
- 61/100
- State rank
- #516
- US rank
- #18383
Category grades
Schools grade is shown separately in the Schools card above.
Census & demographics
- Census place
- Koontz Lake, IN
- Population (ZIP)
- 7,414
Population outlook (Starke County) Hauer SSP2
- Today (2025)
- 21,860 people
- By 2030
- 21,024 · -3.8%
- By 2040
- 19,041 · -12.9%
- By 2050
- 16,881 · -22.8%
- By 2075
- 11,880 · -45.7%
- By 2100
- 7,217 · -67.0%
Race, ethnicity, and origin ACS 2023
- Neighborhood character
- Predominantly White (89%)
- Race & ethnicity
- White 89% Hispanic / Latino 7% Two or more races 6%
- Hispanic origin (detail)
- Mexican 6%
- Common ancestry
- Romanian 8% Slovak 2% Lithuanian 2%
- Foreign-born
- 2% · Canada
- Languages at home
- 96% English-only · Spanish 4%
Political lean MEDSL · Starke
- 2024 margin
- Solid R (+52.0) · D 23.2% · R 75.3% · Other 1.5%
- 2008→2024 swing
- -55.3pp toward R · 2008: 3.2pp · 2024: -52.0pp
- All cycles
- 2024: R+52.0 2020: R+46.8 2016: R+42.0 2012: R+10.6 2008: D+3.2
Not yet ingested
- Civics
- —
Market trends
- HPI YoY
- ▼ -54.04%
- Current HPI
- 260.7073
- Rent YoY
- —
- Metro
- —
- State GDP YoY
- ▲ 2.90%
- F500 in state
- 18
Industry mix (Fortune 500 HQ in IN)
| Industry | F500 HQs | Revenue |
|---|---|---|
| Industrial Machinery | 2 | $37B |
|
||
| Healthcare | 1 | $177B |
|
||
| Pharmaceuticals | 1 | $45B |
|
||
| Metals / Steel | 1 | $18B |
|
||
| Agriculture | 1 | $17B |
|
||
| Packaging | 1 | $12B |
|
||
Price history
1 event — show timeline
- 2026-05-26 Listed $114,900 FSBO.com
Property tax history
+1.1%/yrLatest (2024): $1,179 · -13.4% YoY. Source: county tax records.
Cash-flow waterfall
monthlySold comps — $/sqft
last 12 mo · ≤1 miLoading sold comps…