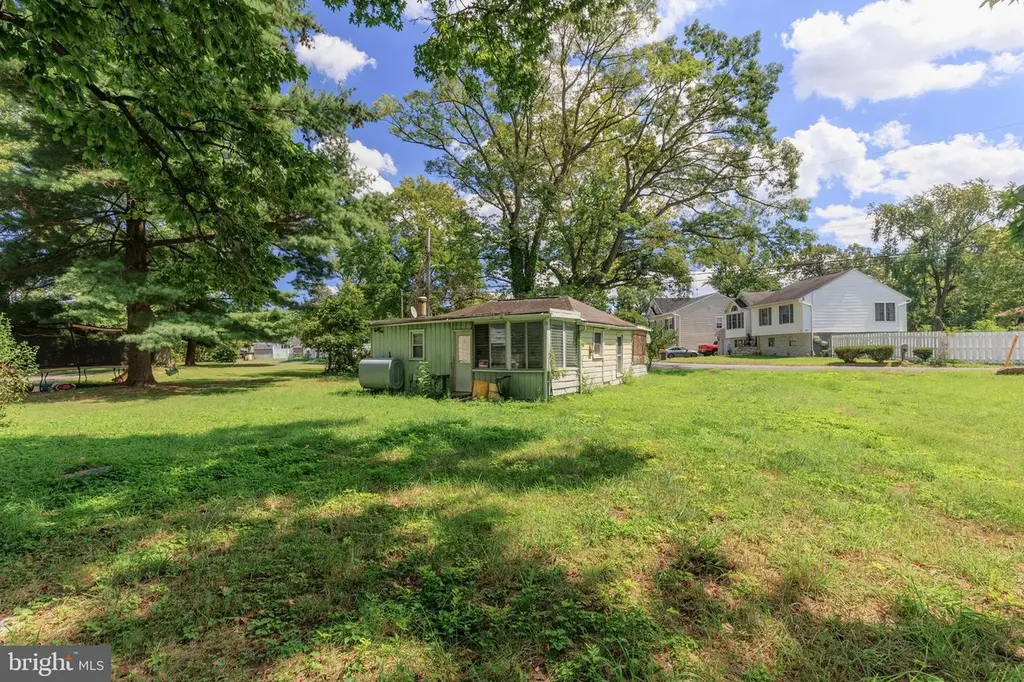
7326 Green Acres Dr · Pasadena, MD
Flood risk 1/10 · Minimal
- FEMA flood zone
- X (unshaded)
- Chance of flooding over 30 yrs
- 0.0%
- Est. flood insurance / yr
- $507 – $1,088
Fire risk 3/10 · Minor
- Est. fire insurance / yr
- $755 – $1,403
Heat risk 8/10 · Major
- Hot days now (above 103°F)
- 7 days/yr
- Hot days in 30 yrs
- 15 days/yr
Wind risk 6/10 · Moderate
- Chance of severe wind over 30 yrs
- 44.0%
Air-quality risk 4/10 · Minor
- Unhealthy air days now
- 5 days/yr
- Unhealthy air days in 30 yrs
- 7 days/yr
Risk factors via First Street. Map © Google.
Why this score? — see what drove the B- grade
The composite is a weighted blend of 9 inputs, each scored 0–100. Each bar is that input's sub-score; the figure is the points it added to the 100-point composite (weight × sub-score).
- Cash flow +30.0/30.0
- 1% rule +10.0/10.0
- DSCR +10.0/10.0
- ARV discount +7.5/15.0
- Livability +3.8/5.0
- Rent growth +3.4/5.0
- Schools +2.9/10.0
- Condition / age +2.5/5.0
- Appreciation +0.0/10.0
$120,000
🖨 Deal sheet (PDF) 📄 Offer letter ✓ Due diligence
Listing remarks
Value is in the land. No interior access is permitted—property is not safe to enter. The existing structure is in poor condition and will require a full tear-down. Buyer to perform all due diligence. Previous listing referenced a potential HOA and a front foot fee of approximately $36/year; however, Seller has never occupied the property and cannot confirm. Cash sale preferred with a quick closing.
Key facts
- 0.5 acre lot
- Built 1945
- Listed 51 days
Property features AI
Finance
- Other: Tax and assessment details available (tax year 2025/assessment year 2026)
- Financial info: Land assessed value recorded; Improvement assessed value recorded
Exterior
- Parking: On-street parking
- Utilities: Public water; Private septic tank; Electric hot water; Cooling fuel: Bottled gas; Heating fuel: Oil
- Home design: Detached property; Fee simple ownership; Year built per assessor
- Construction: Foundation: Other
- Exterior features: Detached structure; Other structures above grade and below grade; Ground rent paid annually; Located outside city limits
Interior
- Bedrooms: 2 bedrooms on the main level
- Bathrooms: 1 full bathroom on the main level; 1 full bathroom total
- Heating & cooling: 90% forced air heating; Oil-fired heating fuel; Cooling system: Other (uses bottled gas); Electric hot water
- Interior features: No basement; Finished above-grade living area of 564 (per assessor)
Neighborhood map
What this means for you Summary
Snapshot
- This is a 2-bed/1.0-bath single-family listed at $120k.
Deal economics
- At list price, monthly cash flow is $557 ($7k/yr) — positive.
- The deal already cash-flows at list — no discount required.
- Meets the 1% rule at list price ($2k rent vs $120k).
- Recommended offer: $116k (3.0% below list) — sets the bar for market timing.
- Cap rate 11.9% vs local median 4.1% in Pasadena — top-decile yield for the area; either an underpriced asset or a hidden risk that comps aren't pricing in. Stress-test before assuming the spread holds.
Location & tenants
- Location reads 75/100 on livability (#100 in MD, #3,887 nationally) — a middle-class / working-renter tenant base. Strengths: employment A+, housing A+, commute A-; Watch: crime D+, amenities F, cost of living F.
- Anne Arundel County Public Schools (suburban): math 20% / reading 37% proficiency, ranked #10 of 24 in MD (top 42%) — low school quality limits family demand, transient renter base, plan for 1-2y turnover.
- Zoned schools: Monarch Global Academy Pcs Laurel Campus (math 13% / reading 28%, grade F, #341 of 860 statewide, top 40%, 830 students, 53% FRL); Northeast Middle (math 6% / reading 32%, grade F, #155 of 225 statewide, top 70%, 882 students, 49% FRL); Northeast High (math 24% / reading 57%, grade F, #130 of 222 statewide, top 58%, 1,390 students, 44% FRL) — zoned schools average 48% FRL vs 25% district-wide (23 pts higher); higher-poverty schools than district average — tighter screening recommended.
- Market conditions: Rents rising (+3.4%/yr); 166 active listings in the ZIP; 1 comparable units currently listed for rent nearby; solid renter incomes; 1,303 units permitted in Anne Arundel County in 2024 (299 in 5+ unit buildings).
Forward outlook
- Local home prices are declining (-3.0%/yr); year-one equity from $830 of loan paydown is wiped out by about $4k of value loss. Plan a longer hold.
- Anne Arundel County population projected at +17% by 2050 — long-run rental-demand tailwind backs the buy-and-hold thesis.
- At projected returns (-3.0% appreciation + 3.4% rent growth), your $34k cash investment doubles in ~6 years — after that, you're playing with house money.
Negotiation context
- It's been on market 52 days — a 3% lower offer ($116k) is reasonable based on typical stale-listing flexibility.
- 11 sale attempts since 30y ago with the ask held roughly flat each time — persistent listings suggest the price (not the market) is what's stuck; bring a comps-based counter.
Risks & watch-outs
- Watch-outs: built in 1945 — expect roof / HVAC / electrical / plumbing capex.
- Climate carrying-cost: major wind risk, 44% chance of damaging wind over 30y; extreme-heat days projected 7→15/yr by 2055 (HVAC capex compounding) — expect insurance premiums to compound above CPI over the hold.
Questions for the listing agent
- It's been on market 52 days. Have you received any prior offers? Is the seller open to a 3% concession, seller financing, or rate buy-down credit?
- Built in 1945 — when were the roof, HVAC, electrical panel, plumbing, and water heater last replaced?
- Is there a deadline driving the sale (1031 exchange, divorce, estate, relocation)? That informs how much negotiation room exists.
- Crime grade is D in this area — have there been break-ins, vandalism, or insurance claims at this property in the last 3 years? What carrier currently insures it and at what premium?
- What's the average days-on-market for RENTAL listings here right now (not sales)? A rising rental-DOM trend means longer vacancies and softer asking-rent achievability than the comps imply.
- What's the recent tenant-quality profile in this submarket — average credit score on applications, eviction rate, late-payment / NSF rate, and stable-employment percentage? A property-management company in the area should have these aggregated.
- How much new for-sale + rental construction is in the pipeline within 1–3 miles? Heavy new supply typically softens prices + rents 12–24 months out; constrained supply supports both.
Investment metrics
- 1% rule
- 1.51% ✓
- Cap rate
- 11.86%
- Cash-on-cash
- 19.88%
- DSCR
- 1.88
- GRM
- 5.5
CMA / ARV
- ARV (median comp)
- $261,400
- List price
- $120,000
- Delta
- -54.09%
- Verdict
- UNDERPRICED
- Comps
- 1 within 2.0 mi
Projected returns pro-forma
-3.0% appreciation · 3.44% rent growth · sell at horizon
- IRR
- 12.5%
- Equity multiple
- 1.50×
- Total profit
- $16,875
- Equity at exit
- $17,892
- IRR
- 21.8%
- Equity multiple
- 2.90×
- Total profit
- $63,918
- Equity at exit
- $10,375
Cash invested: $33,600 (down + closing). Projections, not guarantees.
Landlord ↔ Tenant lean methodology
- Overall (STATE)
- 27 Tenant-Leaning
- State Maryland
- 27 Tenant-Leaning · D+14
- County
- — inherits STATE
- City
- — inherits STATE
ZIP-level market 21060
- Rents YoY
- 3.4%
- Active inventory
- 166
- Price-to-rent
- 5.5×
Monthly cashflow live
- Estimated rent
- $1,813 medium interval (Pro) →
- Mortgage (P&I)
- −$629
- Tax from tax record
- −$197 /mo · $2,359/yr
- Insurance
- −$50
- HOA
- −$0
- Vacancy / Maint / Mgmt
- −$381
- Net cashflow
- $557
Break-even live
Sensitivity live
| Price | -10% $625 | -5% $591 | +0% $557 | +5% $523 | +10% $489 |
|---|---|---|---|---|---|
| Rent | -10% $413 | -5% $485 | +0% $557 | +5% $628 | +10% $700 |
| Rate | -1.0pp $617 | -0.5pp $587 | base $557 | +0.5pp $526 | +1.0pp $494 |
UW: 25.0% down · 7.5% · 30yr · 1.5% tax · 5.0% vac · 8.0% maint · 8.0% mgmt
Financing live
Cash to close
- Down payment
- $30,000
- Closing costs
- $3,600
- Reserves months
- —
- Total cash needed
- —
Loan-product check · same deal, 3 products live
Conventional
25% down · 7.5% · 30yr
- Down + closing
- —
- Monthly P&I
- —
- Monthly cashflow
- —
- DSCR
- —
- Eligible?
- —
Personal DTI + credit; lowest rate.
DSCR
20% down · 8.5% · 30yr
- Down + closing
- —
- Monthly P&I
- —
- Monthly cashflow
- —
- DSCR
- —
- Eligible?
- —
No personal income docs; deal must DSCR.
Hard money
10% down · 12.0% · 12mo
- Down + closing
- —
- Monthly P&I
- —
- Monthly cashflow
- —
- DSCR
- —
- Eligible?
- —
Short-term bridge; refi at stabilization.
Rent comps 1 comps
| Address | Beds | Baths | Sqft | Rent | $/sqft | DOM | Units | Dist |
|---|---|---|---|---|---|---|---|---|
| 303 Maple Tree Dr Glen Burnie, MD | 1.0–3.0 | 1.0–2.0 | 989 | $2,299 | $2.32 | 3d | 35 | 1.11mi |
Listing history 42 events
-
2026-06-21days on market $120,000 Active 52 DOM
-
2026-06-18days on market $120,000 Active 49 DOM
-
2026-06-17days on market $120,000 Active 48 DOM
-
2026-06-16days on market $120,000 Active 47 DOM
-
2026-06-15days on market $120,000 Active 46 DOM
-
2026-06-13days on market $120,000 Active 44 DOM
-
2026-06-09days on market $120,000 Active 40 DOM
-
2026-06-08days on market $120,000 Active 39 DOM
-
2026-06-07days on market $120,000 Active 38 DOM
-
2026-06-04days on market $120,000 Active 35 DOM
-
2026-06-03days on market $120,000 Active 34 DOM
-
2026-06-02days on market $120,000 Active 33 DOM
-
2026-06-01days on market $120,000 Active 32 DOM
-
2026-05-31days on market $120,000 Active 31 DOM
-
2026-05-01$120,000 Active 407-char remark
-
2026-05-01historical $120,000 407-char remark
-
2025-12-31historical
-
2025-11-08price $130,000
-
2025-11-06$145,000 Active
-
2025-10-23historical
-
2025-09-12status Active
-
2025-09-09historical Active Under Contract
-
2025-08-25$145,000 Active
-
2025-08-24historical
-
2024-10-24historical
-
2024-10-05status Active
-
2024-09-30historical
-
2024-09-18price $165,000
-
2024-07-31$190,000 Active
-
2022-09-29historical
-
2021-11-18$225,000 Active
-
2021-04-16soldstatus $125,000
-
2021-02-15soldstatus $125,000 Closed
-
2021-01-31status Pending
-
2021-01-18$125,000 Active
-
2000-06-27soldstatus $65,000
-
1999-11-10historical
-
1998-11-12historical
-
1998-10-29historical
-
1998-10-24
-
1996-09-02
-
1996-08-17
ⓘ Source: listings_history table (triggers on properties + properties_extension) + one-shot
backfill from property_details.listing_events for pre-trigger history.
Tax reassessment forecast MD · Partial reset (capped growth)
- Current annual tax
- $2,359 · $197/mo
- Projected year-2 tax
- $2,359 · $197/mo
- Expected delta
- $0/yr ($0/mo · 0.0%)
ⓘ Screening estimate from a state-policy table — verify with the county assessor before closing.
Climate risk First Street
- Flood 1/10 Low FEMA zone X (unshaded) · 0% chance over 30 yrs
- Wildfire 3/10 Moderate
- Heat 8/10 Severe 7 d/yr ≥103°F today · 15 d/yr by 30 yrs out
- Wind 6/10 Major 44% chance of damaging wind over 30 yrs
- Air quality 4/10 Moderate 5 unhealthy d/yr today · 7 by 30 yrs out
Nearby sold comps map
Loading sold comps map…
Walkable amenities ~0.75 mi
Loading nearby amenities…
Taxation est. · year 1
- Rental income
- $21,761
- − Mortgage interest
- −$6,722
- − Property taxes
- −$2,359
- − Insurance
- −$600
- − Repairs & maintenance
- −$1,741
- − Management
- −$1,741
- − Depreciation
- −$3,491
- Taxable income
- $5,107
- Est. tax owed @ 24.0%
- −$1,226
- After-tax cash flow
- $5,455/yr
For passive investors: Depreciation is non-cash, so a rental often shows a tax loss while cash-flowing — sheltering income. Rental losses are passive: they offset passive income freely, and up to $25,000/yr can offset ordinary (W-2) income if you actively participate and your MAGI is under $100k (phasing out to $0 by $150k); unused losses carry forward. On sale, claimed depreciation is recaptured at up to 25%, and gains may owe capital-gains tax (a 1031 exchange can defer both). Figures are a year-1 estimate at your 24.0% rate — not tax advice; consult a CPA.
Schools (NCES district)
- District
- Anne Arundel County Public Schools
- NCES district ID
- 2400060
- Math proficiency
- 20% ▼ -21.00%
- Reading proficiency
- 37% ▼ -13.00%
- Median HH income
- $87,880
- Composite
- 28.52/100
- National rank
- #6733
- State rank
- #10 of 24 in MD
Livability — Pasadena
- Score
- 75/100
- State rank
- #100
- US rank
- #3887
Category grades
Schools grade is shown separately in the Schools card above.
Census & demographics
- Census place
- Pasadena, MD
- County
- Anne Arundel County · 535,653 people
- City population
- 61,566
- Metro
- Baltimore-Columbia-Towson, MD
- Population (ZIP)
- 39,730
- Household income
- $104,715
- Rent vs Own
- Severe rent burden
- 976.0
Population outlook (Anne Arundel County) Hauer SSP2
- Today (2025)
- 617,384 people
- By 2030
- 642,094 · +4.0%
- By 2040
- 686,621 · +11.2%
- By 2050
- 723,031 · +17.1%
- By 2075
- 809,346 · +31.1%
- By 2100
- 837,658 · +35.7%
Race, ethnicity, and origin ACS 2023
- Neighborhood character
- Diverse neighborhood (Simpson 0.62)
- Race & ethnicity
- White 55% Black 24% Hispanic / Latino 12% Two or more races 7% Asian 4%
- Hispanic origin (detail)
- Mexican 3% Puerto Rican 2%
- Common ancestry
- Romanian 5% Slovak 1% Italian 1%
- Foreign-born
- 12% · Canada, China, Jamaica
- Languages at home
- 85% English-only · Spanish 9% Other Indo-European 2% Tagalog/Filipino 1%
Political lean MEDSL · Anne Arundel
- 2024 margin
- D (+13.9) · D 55.7% · R 41.7% · Other 2.6%
- 2008→2024 swing
- +15.7pp toward D · 2008: -1.8pp · 2024: 13.9pp
- All cycles
- 2024: D+13.9 2020: D+14.5 2016: D+0.7 2012: R+0.9 2008: R+1.8
Not yet ingested
- Civics
- —
Market trends
- HPI YoY
- ▼ -305.56%
- Current HPI
- 304.5692
- Rent YoY
- ▲ 3.44%
- Metro
- Baltimore-Columbia-Towson, MD
- State GDP YoY
- ▲ 2.97%
- F500 in state
- 12
Industry mix (Fortune 500 HQ in MD)
| Industry | F500 HQs | Revenue |
|---|---|---|
| Aerospace / Defense | 1 | $71B |
|
||
| Utilities | 1 | $25B |
|
||
| Hotels | 1 | $24B |
|
||
| Consumer Goods | 1 | $7B |
|
||
| Real Estate | 1 | $6B |
|
||
| Chemicals | 1 | $2B |
|
||
Price history
+84.6% since first listed28 events — show timeline
- 2026-05-01 Listed $120,000 BRIGHT MLS
- 2026-05-01 Coming Soon $120,000 BRIGHT MLS
- 2025-12-31 Listing Removed — BRIGHT MLS
- 2025-11-08 Price Changed $130,000 BRIGHT MLS
- 2025-11-06 Listed $145,000 BRIGHT MLS
- 2025-10-23 Listing Removed — BRIGHT MLS
- 2025-09-12 Relisted — BRIGHT MLS
- 2025-09-09 Contingent — BRIGHT MLS
- 2025-08-25 Listed $145,000 BRIGHT MLS
- 2025-08-24 Coming Soon — BRIGHT MLS
- 2024-10-24 Listing Removed — BRIGHT MLS
- 2024-10-05 Relisted — BRIGHT MLS
- 2024-09-30 Listing Removed — BRIGHT MLS
- 2024-09-18 Price Changed $165,000 BRIGHT MLS
- 2024-07-31 Listed $190,000 BRIGHT MLS
- 2022-09-29 Listing Removed — BRIGHT MLS
- 2021-11-18 Listed $225,000 BRIGHT MLS
- 2021-04-16 Sold (Public Records) $125,000 Public Records
- 2021-02-15 Sold (MLS) $125,000 BRIGHT MLS
- 2021-01-31 Pending — BRIGHT MLS
- 2021-01-18 Listed $125,000 BRIGHT MLS
- 2000-06-27 Sold (Public Records) $65,000 Public Records
- 1999-11-10 Delisted — MRIS
- 1998-11-12 Delisted — MRIS
- 1998-10-29 Delisted — MRIS
- 1998-10-24 Listed — MRIS
- 1996-09-02 Listed — MRIS
- 1996-08-17 Listed — MRIS
Property tax history
+5.3%/yrLatest (2025): $2,359 · +0.5% YoY. Source: county tax records.
Cash-flow waterfall
monthlySold comps — $/sqft
last 12 mo · ≤1 miLoading sold comps…