143 Cotton Leaf Blvd #59 · Summerville, SC
Flood risk No data
- FEMA flood zone
- —
- Chance of flooding over 30 yrs
- —
- Est. flood insurance / yr
- —
Fire risk No data
- Est. fire insurance / yr
- —
Heat risk No data
- Hot days now (above threshold)
- —
- Hot days in 30 yrs
- —
Wind risk No data
- Chance of severe wind over 30 yrs
- —
Air-quality risk No data
- Unhealthy air days now
- —
- Unhealthy air days in 30 yrs
- —
Risk factors via First Street. Map © Google.
Why this score? — see what drove the D grade
The composite is a weighted blend of 9 inputs, each scored 0–100. Each bar is that input's sub-score; the figure is the points it added to the 100-point composite (weight × sub-score).
- Cash flow +12.6/30.0
- ARV discount +7.5/15.0
- Condition / age +4.8/5.0
- 1% rule +4.4/10.0
- DSCR +3.7/10.0
- Schools +3.6/10.0
- Rent growth +3.2/5.0
- Livability +3.2/5.0
- Appreciation +0.0/10.0
$249,990
🖨 Deal sheet (PDF) 📄 Offer letter ✓ Due diligence
Listing remarks
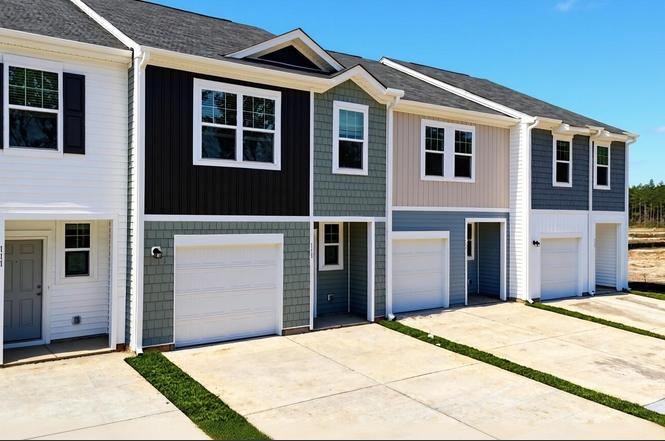
Welcome to Aster Towns! These brand-new townhomes are a part of the master-planned community of Cane Bay. Enjoy the spacious open-concept floorplan, complete with included appliances, and beautiful LVP flooring downstairs. Upstairs, enjoy a spacious owner's suite complete with a full-sized bathroom and large walk-in closet. Right down the hall, you will find 2 guest rooms with a full bathroom. Your ideal lifestyle awaits in these move-in ready townhomes!
Key facts
- $165 HOA
- Garage
- Built 2026
Property features AI
Finance
- HOA & community: HOA fee $165 monthly
Exterior
- Parking: 1-car garage
- Utilities: Public sewer
- Home design: Residential, single-family attached; Two levels; New construction
- Construction: New construction
- Exterior features: Asphalt roof
Interior
- Kitchen: Dishwasher; Disposal; Electric range; Microwave; Refrigerator
- Bedrooms: 3 bedrooms, primary bedroom located on the upper level
- Flooring: Carpet; Luxury vinyl
- Bathrooms: 3 total (2.5 bathrooms)
- Heating & cooling: Central heating; Central air conditioning
- Interior features: Living/dining combo
- Laundry & utility: Washer; Dryer
Neighborhood map
What this means for you Summary
Snapshot
- This is a 3-bed/2.5-bath condo listed at $250k. Condition is rated excellent.
Deal economics
- At list price, monthly cash flow is $-34 ($-406/yr) — negative.
- To cash-flow at today's rent, offer at most $245k (2.0% below list).
- To meet the 1% rule (rent ≥ 1% of price), the offer needs to be $235k (5.9% below list).
- Recommended offer: $227k (9.0% below list) — sets the bar for market timing.
- Cap rate 6.1% vs local median 3.9% in Summerville — top-decile yield for the area; either an underpriced asset or a hidden risk that comps aren't pricing in. Stress-test before assuming the spread holds.
Location & tenants
- Location reads 63/100 on livability (#167 in SC) — a middle-class / working-renter tenant base. Strengths: housing A+, cost of living B+; Watch: amenities F, commute F, health & safety F.
- Berkeley 01 (suburban): math 35% / reading 48% proficiency, ranked #30 of 80 in SC (top 38%) — families likely to look elsewhere, expect single-tenant / working-renter base with shorter leases.
- Zoned schools: Whitesville Elementary (math 34% / reading 39%, grade F, #328 of 597 statewide, top 55%, 1,031 students, 62% FRL); Berkeley Middle (math 19% / reading 32%, grade F, #162 of 229 statewide, top 71%, 1,403 students, 57% FRL); Berkeley High (math 36% / reading 83%, grade C+, #110 of 196 statewide, top 58%, 1,776 students, 50% FRL).
- Market conditions: Rents rising (+2.7%/yr); 1301 active listings in the ZIP; 19 comparable units currently listed for rent nearby; rentals leasing fast (median 5d on market — plan ~1-2 weeks tenant-placement turnaround); solid renter incomes; 3,183 units permitted in Berkeley County in 2024 (580 in 5+ unit buildings).
- This rent runs 32% of the median local income ($90k/yr) — at the standard rent-burdened threshold; future hikes will face affordability resistance.
Forward outlook
- Local home prices are declining (-3.0%/yr); year-one equity from $2k of loan paydown is wiped out by about $8k of value loss. Plan a longer hold.
- Berkeley County population projected at +48% by 2050 — long-run rental-demand tailwind backs the buy-and-hold thesis.
Negotiation context
- It's been on market 91 days — a 9% lower offer ($227k) is reasonable based on typical stale-listing flexibility.
Questions for the listing agent
- What do current leases actually rent for vs. the listed asking? Can we see a recent rent roll and the last 12 months of T-12 income?
- It's been on market 91 days. Have you received any prior offers? Is the seller open to a 9% concession, seller financing, or rate buy-down credit?
- What does the HOA fee cover, when was the last increase, and are there any pending special assessments or reserve-fund shortfalls?
- Any open or pending special assessments — roof, HVAC, plumbing, elevator, façade? What's the per-unit balance and payoff schedule, and is the seller paying it off at close or rolling it to the buyer?
- Why hasn't it sold? Are there any deal-killer items the seller is aware of (foundation, flood, title, zoning, code violations)?
- Is there a deadline driving the sale (1031 exchange, divorce, estate, relocation)? That informs how much negotiation room exists.
- Schools are B-rated — typically a magnet for longer-tenancy family renters. What's the average tenant stay here, and is there a school-zone premium baked into asking?
- The area grade is low — what's the realistic commute time and amenity access for the typical tenant pool here? Any planned neighborhood developments (good or bad) we should know about?
- What's the average days-on-market for RENTAL listings here right now (not sales)? A rising rental-DOM trend means longer vacancies and softer asking-rent achievability than the comps imply.
- What's the recent tenant-quality profile in this submarket — average credit score on applications, eviction rate, late-payment / NSF rate, and stable-employment percentage? A property-management company in the area should have these aggregated.
- How much new apartment / multifamily construction is in the pipeline within 1–3 miles? Heavy new supply (>2% of stock underway) typically softens rents 12–24 months out; light construction supports rent growth.
Investment metrics
- 1% rule
- 0.94% ✗
- Cap rate
- 6.13%
- Cash-on-cash
- -0.58%
- DSCR
- 0.97
- GRM
- 8.9
CMA / ARV
No comps found within radius.
Projected returns pro-forma
-3.0% appreciation · 2.67% rent growth · sell at horizon
- IRR
- -17.6%
- Equity multiple
- 0.38×
- Total profit
- $-43,304
- Equity at exit
- $37,274
- IRR
- -10.2%
- Equity multiple
- 0.38×
- Total profit
- $-43,099
- Equity at exit
- $21,615
Cash invested: $69,997 (down + closing). Projections, not guarantees.
Landlord ↔ Tenant lean methodology
- Overall (STATE)
- 90 Strongly Landlord-Friendly
- State South Carolina
- 90 Strongly Landlord-Friendly · R+6
- County
- — inherits STATE
- City
- — inherits STATE
ZIP-level market 29486
- Home prices YoY
- -15.6%
- Rents YoY
- 2.7%
- Active inventory
- 1301
- Price-to-rent
- 8.9×
Monthly cashflow live
- Estimated rent
- $2,353 high interval (Pro) →
- Mortgage (P&I)
- −$1,311
- Tax est. 1.5%
- −$312 /mo · $3,750/yr
- Insurance
- −$104
- HOA
- −$165
- Vacancy / Maint / Mgmt
- −$494
- Net cashflow
- $-34
Break-even live
Sensitivity live
| Price | -10% $139 | -5% $53 | +0% $-34 | +5% $-120 | +10% $-207 |
|---|---|---|---|---|---|
| Rent | -10% $-220 | -5% $-127 | +0% $-34 | +5% $59 | +10% $152 |
| Rate | -1.0pp $92 | -0.5pp $30 | base $-34 | +0.5pp $-99 | +1.0pp $-164 |
UW: 25.0% down · 7.5% · 30yr · 1.5% tax · 5.0% vac · 8.0% maint · 8.0% mgmt
Financing live
Cash to close
- Down payment
- $62,498
- Closing costs
- $7,500
- Reserves months
- —
- Total cash needed
- —
Loan-product check · same deal, 3 products live
Conventional
25% down · 7.5% · 30yr
- Down + closing
- —
- Monthly P&I
- —
- Monthly cashflow
- —
- DSCR
- —
- Eligible?
- —
Personal DTI + credit; lowest rate.
DSCR
20% down · 8.5% · 30yr
- Down + closing
- —
- Monthly P&I
- —
- Monthly cashflow
- —
- DSCR
- —
- Eligible?
- —
No personal income docs; deal must DSCR.
Hard money
10% down · 12.0% · 12mo
- Down + closing
- —
- Monthly P&I
- —
- Monthly cashflow
- —
- DSCR
- —
- Eligible?
- —
Short-term bridge; refi at stabilization.
Rent comps 19 comps
| Address | Beds | Baths | Sqft | Rent | $/sqft | DOM | Units | Dist |
|---|---|---|---|---|---|---|---|---|
| 229 Grand View Xing Summerville, SC | 4.0 | 2.0 | 1768 | $2,400 | $1.36 | 16d | 1 | 0.12mi |
| 391 Tiliwa St Summerville, SC | 3.0 | 2.5 | 1786 | $2,295 | $1.28 | 5d | 1 | 0.20mi |
| 402 Tiliwa St Summerville, SC | 3.0 | 2.5 | 1785 | $2,295 | $1.29 | 5d | 1 | 0.25mi |
| 753 Ridgley Dr Summerville, SC | 3.0 | 2.5 | 1786 | $2,295 | $1.28 | 23d | 1 | 0.38mi |
| 755 Ridgley Dr Unit 755 Summerville, SC | 3.0 | 2.5 | 1796 | $2,500 | $1.39 | 5d | 1 | 0.39mi |
| 704 Ladywood Dr Summerville, SC | 3.0 | 2.0 | 1618 | $2,350 | $1.45 | 5d | 1 | 0.57mi |
| 44000 Owl Wood Ln Summerville, SC | 1.0–3.0 | 1.0–2.0 | 1086 | $2,129 | $1.96 | 5d | 14 | 0.61mi |
| 900 Emblem St Summerville, SC | 1.0–3.0 | 1.0–2.0 | 1086 | $2,159 | $1.99 | 4d | 21 | 0.74mi |
| 5101 Evado Ln Summerville, SC | 3.0 | 1.0–2.0 | 859 | $2,136 | $2.49 | 4d | 19 | 0.77mi |
| 608 Ladywood Dr Summerville, SC | 3.0 | 2.0 | 1618 | $2,200 | $1.36 | 13d | 1 | 0.83mi |
| 108 Haventree Ct Summerville, SC | 4.0 | 2.5 | 1792 | $2,400 | $1.34 | 25d | 1 | 0.86mi |
| 130 Lucky Day Dr Summerville, SC | 3.0 | 2.0 | 1547 | $2,100 | $1.36 | 4d | 1 | 0.89mi |
| 844 Lilyford Ln , SC | 3.0 | 2.5 | 1518 | $2,300 | $1.52 | 25d | 1 | 1.07mi |
| 900 Owl Wood Ln Summerville, SC | 2.0 | 2.0 | 1157 | $2,385 | $2.06 | 25d | 1 | 1.14mi |
| 900 Owl Wood Ln Summerville, SC | 3.0 | 2.0 | 1311 | $2,273 | $1.73 | 5d | 1 | 1.14mi |
| 175 Lyra Ln Summerville, SC | 3.0–4.0 | 2.0–3.0 | 2082 | $2,200 | $1.06 | 5d | 3 | 1.29mi |
| 318 Deep River Rd Summerville, SC | 4.0 | 2.0 | 1689 | $2,349 | $1.39 | 16d | 1 | 1.31mi |
| 310 Surfbird Rd Summerville, SC | 3.0 | 2.5 | 1761 | $2,350 | $1.33 | 12d | 1 | 1.34mi |
| 495 Pender Woods Dr Summerville, SC | 3.0 | 2.0 | 1418 | $2,175 | $1.53 | 25d | 1 | 1.42mi |
HOA detail condo
- Monthly dues
- $165 · $1,980/yr
- Assessments
- None detected in remarks — confirm with the listing agent.
Listing history 3 events
-
2026-04-23price $249,990
-
2026-04-08price $269,990
-
2026-02-24$287,990 Active
ⓘ Source: listings_history table (triggers on properties + properties_extension) + one-shot
backfill from property_details.listing_events for pre-trigger history.
Nearby sold comps map
Loading sold comps map…
Walkable amenities ~0.75 mi
Loading nearby amenities…
Taxation est. · year 1
- Rental income
- $28,235
- − Mortgage interest
- −$14,003
- − Property taxes
- −$3,750
- − Insurance
- −$1,250
- − Repairs & maintenance
- −$2,259
- − Management
- −$2,259
- − HOA
- −$1,980
- − Depreciation
- −$7,272
- Taxable loss
- −$4,538
- Est. tax savings @ 24.0%
- +$1,089
- After-tax cash flow
- $683/yr
For passive investors: Depreciation is non-cash, so a rental often shows a tax loss while cash-flowing — sheltering income. Rental losses are passive: they offset passive income freely, and up to $25,000/yr can offset ordinary (W-2) income if you actively participate and your MAGI is under $100k (phasing out to $0 by $150k); unused losses carry forward. On sale, claimed depreciation is recaptured at up to 25%, and gains may owe capital-gains tax (a 1031 exchange can defer both). Figures are a year-1 estimate at your 24.0% rate — not tax advice; consult a CPA.
Condition & rehab AI · 13 photos
This move-in ready townhome in Aster Towns is in excellent condition with no visible repairs needed. It offers a spacious open-concept floorplan and beautiful LVP flooring downstairs. The exterior is in good condition, and the property has a great location in the master-planned community of Cane Bay.
Value-add opportunities
- Both Painting the exterior — Enhances curb appeal and resale value
- Both Landscaping the front yard — Improves curb appeal and rental value
- Both Upgrading the flooring in the living room — Enhances the aesthetic and resale value
Renovation cost estimate screening
Value-add ROI direction
- Both Painting the exterior — Enhances curb appeal and resale value ↑
- Both Landscaping the front yard — Improves curb appeal and rental value ↑
- Both Upgrading the flooring in the living room — Enhances the aesthetic and resale value ↑
ⓘ Cost ranges are severity-bucket heuristics (US national rule-of-thumb). Get contractor quotes + a written scope before underwriting a rehab budget.
Schools (NCES district)
- District
- Berkeley 01
- NCES district ID
- 4501170
- Math proficiency
- 35% ▼ -8.00%
- Reading proficiency
- 48% ▼ -2.00%
- Median HH income
- $52,724
- Composite
- 35.95/100
- National rank
- #4799
- State rank
- #30 of 80 in SC
Livability — Summerville
- Score
- 63/100
- State rank
- #167
- US rank
- #15058
Category grades
Schools grade is shown separately in the Schools card above.
Census & demographics
- County
- Berkeley County · 198,768 people
- City population
- 171,668
- Metro
- Charleston-North Charleston, SC
- Population (ZIP)
- 53,975
- Household income
- $89,578
- Rent vs Own
- Severe rent burden
- 1017.0
Population outlook (Berkeley County) Hauer SSP2
- Today (2025)
- 254,184 people
- By 2030
- 279,677 · +10.0%
- By 2040
- 329,379 · +29.6%
- By 2050
- 375,557 · +47.8%
- By 2075
- 476,740 · +87.6%
- By 2100
- 535,945 · +110.8%
Race, ethnicity, and origin ACS 2023
- Neighborhood character
- Diverse neighborhood (Simpson 0.56)
- Race & ethnicity
- White 62% Black 19% Two or more races 10% Hispanic / Latino 10% Asian 2%
- Hispanic origin (detail)
- Mexican 4% Puerto Rican 2%
- Common ancestry
- Lithuanian 4% Italian 2% Romanian 2%
- Foreign-born
- 5% · Canada, Jamaica
- Languages at home
- 91% English-only · Spanish 6% German/W. Germanic 1%
Political lean MEDSL · Berkeley
- 2024 margin
- R (+16.3) · D 41.1% · R 57.4% · Other 1.4%
- 2008→2024 swing
- -3.2pp toward R · 2008: -13.1pp · 2024: -16.3pp
- All cycles
- 2024: R+16.3 2020: R+11.7 2016: R+17.4 2012: R+18.9 2008: R+13.1
Not yet ingested
- Civics
- —
Market trends
- HPI YoY
- ▼ -52.74%
- Current HPI
- 285.0567
- Rent YoY
- ▲ 2.67%
- Metro
- Charleston-North Charleston, SC
- State GDP YoY
- ▲ 4.51%
- F500 in state
- 2
Industry mix (Fortune 500 HQ in SC)
| Industry | F500 HQs | Revenue |
|---|---|---|
| Packaging | 1 | $7B |
|
||
Price history
-13.2% since first listed3 events — show timeline
- 2026-04-23 Price Changed $249,990 Charleston Trident MLS
- 2026-04-08 Price Changed $269,990 Charleston Trident MLS
- 2026-02-24 Listed $287,990 Charleston Trident MLS
Cash-flow waterfall
monthlySold comps — $/sqft
last 12 mo · ≤1 miLoading sold comps…