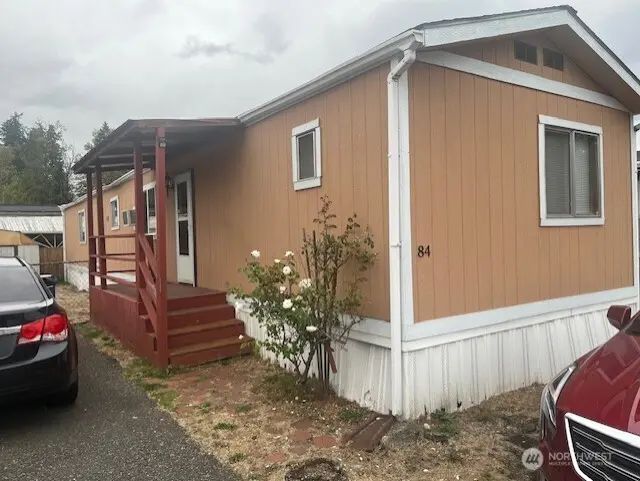
15232 SE 272nd St #84 · Kent, WA
Flood risk 1/10 · Minimal
- FEMA flood zone
- X (unshaded)
- Chance of flooding over 30 yrs
- 0.0%
- Est. flood insurance / yr
- $507 – $1,088
Fire risk 1/10 · Minimal
- Est. fire insurance / yr
- $604 – $1,122
Heat risk 3/10 · Minor
- Hot days now (above 87°F)
- 7 days/yr
- Hot days in 30 yrs
- 16 days/yr
Wind risk 1/10 · Minimal
- Chance of severe wind over 30 yrs
- —
Air-quality risk 7/10 · Major
- Unhealthy air days now
- 12 days/yr
- Unhealthy air days in 30 yrs
- 13 days/yr
Risk factors via First Street. Map © Google.
Why this score? — see what drove the B grade
The composite is a weighted blend of 9 inputs, each scored 0–100. Each bar is that input's sub-score; the figure is the points it added to the 100-point composite (weight × sub-score).
- Cash flow +30.0/30.0
- 1% rule +10.0/10.0
- DSCR +10.0/10.0
- ARV discount +7.5/15.0
- Schools +4.8/10.0
- Livability +4.0/5.0
- Rent growth +2.5/5.0
- Condition / age +2.2/5.0
- Appreciation +0.0/10.0
$69,950
🖨 Deal sheet 📄 Offer letter ✓ Due diligence
Listing remarks
Move in ready mobile home. Two bedrooms and two full bathrooms. Vaulted ceilings in living room, kitchen and primary bedroom. Primary bedroom features a full bathroom and walk-in closet, Eating area at counter or ample space for a kitchen table. Laundry room off kitchen with shelving and storage. Fenced yard on side of the home. Great for garden and/or barbecue. Adequate parking for two cars. Close to stores and activities.
Key facts
- Fenced yard
- Eating area
- Walk-in closet
Tags
Neighborhood map
What this means for you Summary
Snapshot
- This is a 2-bed/2.0-bath manufactured listed at $70k. Condition is rated fair.
Deal economics
- At list price, monthly cash flow is $1k ($16k/yr) — positive.
- The deal already cash-flows at list — no discount required.
- Meets the 1% rule at list price ($2k rent vs $70k).
- Recommended offer: $62k (12.0% below list) — sets the bar for market timing.
- Cap rate 28.7% vs local median 2.7% in Kent — top-decile yield for the area; either an underpriced asset or a hidden risk that comps aren't pricing in. Stress-test before assuming the spread holds.
Location & tenants
- Location reads 79/100 on livability (#109 in WA, #2,154 nationally) — a middle-class / working-renter tenant base. Strengths: amenities A+, commute A+, housing A+; Watch: schools C-, crime F, cost of living F.
- Kent School District (urban): math 47% / reading 57% proficiency, ranked #109 of 291 in WA (top 38%) — acceptable for families but not a draw, mixed tenant base, ~2y average lease.
- Market conditions: Rents flat; 332 active listings in the ZIP; 7 comparable units currently listed for rent nearby; rentals leasing fast (median 2d on market — plan ~1-2 weeks tenant-placement turnaround); high-income renter base; 10,555 units permitted in King County in 2024 (7,119 in 5+ unit buildings).
Forward outlook
- Local home prices are declining (-3.0%/yr); year-one equity from $484 of loan paydown is wiped out by about $2k of value loss. Plan a longer hold.
- King County population projected at +44% by 2050 — long-run rental-demand tailwind backs the buy-and-hold thesis.
- At projected returns (-3.0% appreciation + 0.2% rent growth), your $20k cash investment doubles in ~2 years — after that, you're playing with house money.
Negotiation context
- It's been on market 128 days — a 12% lower offer ($62k) is reasonable based on typical stale-listing flexibility.
Questions for the listing agent
- It's been on market 128 days. Have you received any prior offers? Is the seller open to a 12% concession, seller financing, or rate buy-down credit?
- Have any recent inspections been done? Can we get a copy of the seller's disclosures and any deferred-maintenance estimates?
- Why hasn't it sold? Are there any deal-killer items the seller is aware of (foundation, flood, title, zoning, code violations)?
- Is there a deadline driving the sale (1031 exchange, divorce, estate, relocation)? That informs how much negotiation room exists.
- Crime grade is F in this area — have there been break-ins, vandalism, or insurance claims at this property in the last 3 years? What carrier currently insures it and at what premium?
- What's the average days-on-market for RENTAL listings here right now (not sales)? A rising rental-DOM trend means longer vacancies and softer asking-rent achievability than the comps imply.
- What's the recent tenant-quality profile in this submarket — average credit score on applications, eviction rate, late-payment / NSF rate, and stable-employment percentage? A property-management company in the area should have these aggregated.
- How much new for-sale + rental construction is in the pipeline within 1–3 miles? Heavy new supply typically softens prices + rents 12–24 months out; constrained supply supports both.
Investment metrics
- 1% rule
- 3.23% ✓
- Cap rate
- 28.66%
- Cash-on-cash
- 79.88%
- DSCR
- 4.55
- GRM
- 2.6
CMA / ARV
- ARV (median comp)
- $389,000
- List price
- $69,950
- Delta
- -82.02%
- Verdict
- UNDERPRICED
- Comps
- 4 within 1.0 mi
Show comp detail 3 sales within ~0.75 mi
| Address | Dist | Beds/Ba | Sqft | Sold | Price | $/sf | Match |
|---|---|---|---|---|---|---|---|
| 15232 SE 272nd St #29 | 0.00mi | 2/1.0 | 924 (-1%) | 13mo | $134,900 | $146 | 84 |
| 15232 272nd St SE #90 | 0.02mi | 2/2.0 | 924 (-1%) | 17mo | $30,150 | $33 | 84 |
| 15232 SE 272nd St #13 | 0.15mi | 2/1.0 | 924 (-1%) | 13mo | $125,000 | $135 | 77 |
Match score weights: distance 35% · size 25% · config 20% · recency 20%. Top-matched comps best support the ARV.
Projected returns pro-forma
-3.0% appreciation · 0.19% rent growth · sell at horizon
- IRR
- 76.8%
- Equity multiple
- 4.35×
- Total profit
- $65,518
- Equity at exit
- $10,430
- IRR
- 79.7%
- Equity multiple
- 8.15×
- Total profit
- $139,983
- Equity at exit
- $6,048
Cash invested: $19,586 (down + closing). Projections, not guarantees.
Landlord ↔ Tenant lean methodology
- Overall (STATE)
- 28 Tenant-Leaning
- State Washington
- 28 Tenant-Leaning · D+8
- County
- — inherits STATE
- City
- — inherits STATE
ZIP-level market 98042
- Rents YoY
- 0.2%
- Active inventory
- 332
- Price-to-rent
- 2.6×
Monthly cashflow live
- Estimated rent
- $2,262 high interval (Pro) →
- Mortgage (P&I)
- −$367
- Tax est. 1.5%
- −$87 /mo · $1,049/yr
- Insurance
- −$29
- HOA
- −$0
- Vacancy / Maint / Mgmt
- −$475
- Net cashflow
- $1,304
Break-even live
UW: 25.0% down · 7.5% · 30yr · 1.5% tax · 5.0% vac · 8.0% maint · 8.0% mgmt
Financing live
Cash to close
- Down payment
- $17,488
- Closing costs
- $2,098
- Reserves months
- —
- Total cash needed
- —
Loan-product check · same deal, 3 products live
Conventional
25% down · 7.5% · 30yr
- Down + closing
- —
- Monthly P&I
- —
- Monthly cashflow
- —
- DSCR
- —
- Eligible?
- —
Personal DTI + credit; lowest rate.
DSCR
20% down · 8.5% · 30yr
- Down + closing
- —
- Monthly P&I
- —
- Monthly cashflow
- —
- DSCR
- —
- Eligible?
- —
No personal income docs; deal must DSCR.
Hard money
10% down · 12.0% · 12mo
- Down + closing
- —
- Monthly P&I
- —
- Monthly cashflow
- —
- DSCR
- —
- Eligible?
- —
Short-term bridge; refi at stabilization.
Rent comps 7 comps
| Address | Beds | Baths | Sqft | Rent | $/sqft | DOM | Units | Dist |
|---|---|---|---|---|---|---|---|---|
| 14901 SE 272nd St Kent, WA | 1.0–3.0 | 1.0–2.0 | 900 | $1,959 | $2.18 | 1d | 15 | 0.27mi |
| 27403 141st Ave SE Kent, WA | 3.0 | 1.5 | 960 | $3,500 | $3.65 | 2d | 1 | 0.79mi |
| 26902 169th Pl SE Covington, WA | 1.0–2.0 | 1.0 | 671 | $2,220 | $3.31 | 11d | 1 | 1.11mi |
| 16830 SE Wax Rd Covington, WA | 3.0 | 1.0–2.0 | 909 | $2,229 | $2.45 | 1d | 15 | 1.15mi |
| 17126 SE 269th Pl Covington, WA | 1.0–3.0 | 1.0–2.0 | 956 | $2,190 | $2.29 | 1d | 15 | 1.16mi |
| 17110 SE 276th St Covington, WA | 1.0–3.0 | 1.0–2.0 | 852 | $2,220 | $2.61 | 1d | 1 | 1.16mi |
| 27400 132nd Ave SE Kent, WA | 1.0–2.0 | 1.0–2.0 | 842 | $2,095 | $2.49 | 2d | 7 | 1.27mi |
Listing history 14 events
-
2026-06-18days on market $69,950 Active 128 DOM
-
2026-06-17days on market $69,950 Active 127 DOM
-
2026-06-16days on market $69,950 Active 126 DOM
-
2026-06-15days on market $69,950 Active 125 DOM
-
2026-06-13days on market $69,950 Active 123 DOM
-
2026-06-09days on market $69,950 Active 119 DOM
-
2026-06-08days on market $69,950 Active 118 DOM
-
2026-06-07days on market $69,950 Active 117 DOM
-
2026-06-04days on market $69,950 Active 114 DOM
-
2026-06-03days on market $69,950 Active 113 DOM
-
2026-06-02days on market $69,950 Active 112 DOM
-
2026-06-01days on market $69,950 Active 111 DOM
-
2026-05-31days on market $69,950 Active 110 DOM
-
2026-02-10$69,950 Active
ⓘ Source: listings_history table (triggers on properties + properties_extension) + one-shot
backfill from property_details.listing_events for pre-trigger history.
Climate risk First Street
- Flood 1/10 Low FEMA zone X (unshaded) · 0% chance over 30 yrs
- Wildfire 1/10 Low
- Heat 3/10 Moderate 7 d/yr ≥87°F today · 16 d/yr by 30 yrs out
- Wind 1/10 Low
- Air quality 7/10 Severe 12 unhealthy d/yr today · 13 by 30 yrs out
Nearby sold comps map
Loading sold comps map…
Walkable amenities ~0.75 mi
Loading nearby amenities…
Taxation est. · year 1
- Rental income
- $27,148
- − Mortgage interest
- −$3,918
- − Property taxes
- −$1,049
- − Insurance
- −$350
- − Repairs & maintenance
- −$2,172
- − Management
- −$2,172
- − Depreciation
- −$2,035
- Taxable income
- $15,452
- Est. tax owed @ 24.0%
- −$3,708
- After-tax cash flow
- $11,937/yr
For passive investors: Depreciation is non-cash, so a rental often shows a tax loss while cash-flowing — sheltering income. Rental losses are passive: they offset passive income freely, and up to $25,000/yr can offset ordinary (W-2) income if you actively participate and your MAGI is under $100k (phasing out to $0 by $150k); unused losses carry forward. On sale, claimed depreciation is recaptured at up to 25%, and gains may owe capital-gains tax (a 1031 exchange can defer both). Figures are a year-1 estimate at your 24.0% rate — not tax advice; consult a CPA.
Condition & rehab AI · 12 photos
This mobile home requires significant repairs and updates to its exterior, interior, and systems to improve its condition and value.
Repairs flagged
- Major exterior siding — Severe weathering
- Major interior walls — Peeling paint and wallpaper
- Major kitchen cabinets — Outdated and worn
- Major bathroom fixtures — Worn and outdated
- Major flooring — Worn and outdated carpet
Value-add opportunities
- Both Paint interior walls — Fresh paint enhances curb appeal and interior aesthetics
- Both Replace kitchen cabinets — New cabinets improve functionality and aesthetics
- Both Replace bathroom fixtures — New fixtures enhance functionality and aesthetics
- Both Replace flooring — New flooring improves comfort and aesthetics
Renovation cost estimate screening
| Repair item | Severity | Est. cost |
|---|---|---|
| exterior siding · Severe weathering | Major | $15,000–50,000 |
| interior walls · Peeling paint and wallpaper | Major | $15,000–50,000 |
| kitchen cabinets · Outdated and worn | Major | $15,000–50,000 |
| bathroom fixtures · Worn and outdated | Major | $15,000–50,000 |
| flooring · Worn and outdated carpet | Major | $15,000–50,000 |
| Total estimated repair cost · 5 items | $75,000–250,000 |
Value-add ROI direction
- Both Paint interior walls — Fresh paint enhances curb appeal and interior aesthetics ↑
- Both Replace kitchen cabinets — New cabinets improve functionality and aesthetics ↑
- Both Replace bathroom fixtures — New fixtures enhance functionality and aesthetics ↑
- Both Replace flooring — New flooring improves comfort and aesthetics ↑
ⓘ Cost ranges are severity-bucket heuristics (US national rule-of-thumb). Get contractor quotes + a written scope before underwriting a rehab budget.
Schools (NCES district)
- District
- Kent School District
- NCES district ID
- 5303960
- Math proficiency
- 47% ▼ -1.00%
- Reading proficiency
- 57% ▼ -1.00%
- Median HH income
- $69,823
- Composite
- 48.25/100
- National rank
- #4714
- State rank
- #109 of 291 in WA
Livability — Kent
- Score
- 79/100
- State rank
- #109
- US rank
- #2154
Category grades
Schools grade is shown separately in the Schools card above.
Census & demographics
- Census place
- Kent, WA
- County
- King County · 2,251,916 people
- City population
- 119,479
- Metro
- Seattle-Tacoma-Bellevue, WA
- Population (ZIP)
- 50,216
- Household income
- $127,552
- Rent vs Own
- Severe rent burden
- 892.0
Population outlook (King County) Hauer SSP2
- Today (2025)
- 2,576,485 people
- By 2030
- 2,803,316 · +8.8%
- By 2040
- 3,255,921 · +26.4%
- By 2050
- 3,706,444 · +43.9%
- By 2075
- 4,746,063 · +84.2%
- By 2100
- 5,407,730 · +109.9%
Race, ethnicity, and origin ACS 2023
- Neighborhood character
- Diverse neighborhood (Simpson 0.58)
- Race & ethnicity
- White 62% Asian 13% Hispanic / Latino 12% Two or more races 12% Black 6%
- Hispanic origin (detail)
- Mexican 8%
- Common ancestry
- Portuguese 4% Subsaharan African 3% Italian 3%
- Foreign-born
- 19% · Canada, Vietnam, China
- Languages at home
- 75% English-only · Spanish 7% Russian/Polish/Slavic 4% Other Indo-European 3%
Political lean MEDSL · King
- 2024 margin
- Solid D (+51.7) · D 74.2% · R 22.5% · Other 3.4%
- 2008→2024 swing
- +9.6pp toward D · 2008: 42.1pp · 2024: 51.7pp
- All cycles
- 2024: D+51.7 2020: D+52.7 2016: D+50.4 2012: D+39.9 2008: D+42.1
Not yet ingested
- Civics
- —
Market trends
- HPI YoY
- ▼ -635.61%
- Current HPI
- 297.7991
- Rent YoY
- ▲ 0.19%
- Metro
- Seattle-Tacoma-Bellevue, WA
- State GDP YoY
- ▲ 4.65%
- F500 in state
- 22
Industry mix (Fortune 500 HQ in WA)
| Industry | F500 HQs | Revenue |
|---|---|---|
| Retail | 2 | $269B |
|
||
| Technology / Retail | 1 | $638B |
|
||
| Technology | 1 | $245B |
|
||
| Telecommunications | 1 | $38B |
|
||
| Food / Beverage | 1 | $36B |
|
||
| Automotive / Trucks | 1 | $34B |
|
||
Price history
1 event — show timeline
- 2026-02-10 Listed $69,950 NWMLS as Distributed by MLS Grid
Cash-flow waterfall
monthlySold comps — $/sqft
last 12 mo · ≤1 miLoading sold comps…