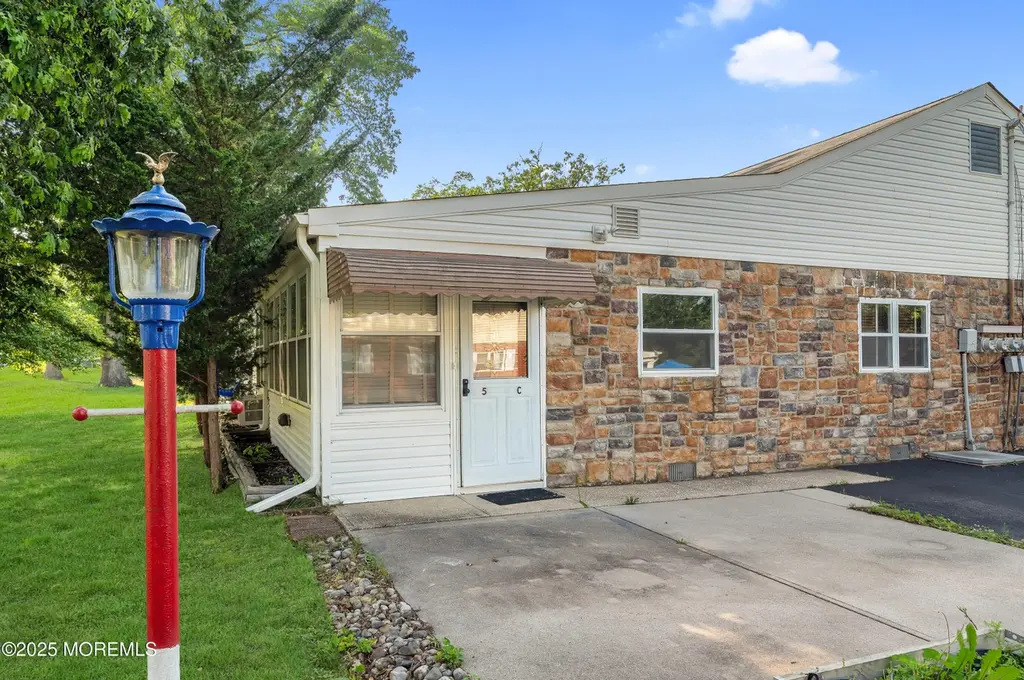
5 Chestnut St Unit C · Pine Lake Park, NJ
Flood risk 1/10 · Minimal
- FEMA flood zone
- X (unshaded)
- Chance of flooding over 30 yrs
- 0.0%
- Est. flood insurance / yr
- $507 – $1,088
Fire risk 3/10 · Minor
- Est. fire insurance / yr
- $526 – $976
Heat risk 7/10 · Major
- Hot days now (above 101°F)
- 7 days/yr
- Hot days in 30 yrs
- 15 days/yr
Wind risk 6/10 · Moderate
- Chance of severe wind over 30 yrs
- 64.0%
Air-quality risk 3/10 · Minor
- Unhealthy air days now
- 3 days/yr
- Unhealthy air days in 30 yrs
- 4 days/yr
Risk factors via First Street. Map © Google.
Why this score? — see what drove the B- grade
The composite is a weighted blend of 9 inputs, each scored 0–100. Each bar is that input's sub-score; the figure is the points it added to the 100-point composite (weight × sub-score).
- Cash flow +30.0/30.0
- 1% rule +10.0/10.0
- DSCR +10.0/10.0
- ARV discount +5.5/15.0
- Condition / age +3.8/5.0
- Livability +3.2/5.0
- Schools +2.9/10.0
- Rent growth +2.5/5.0
- Appreciation +0.0/10.0
$94,000
🖨 Deal sheet 📄 Offer letter ✓ Due diligence
Listing remarks
Welcome to Cedar Glen Homes, a sought after 55+ community offering easy living in a convenient location. This beautifully updated, move in ready home features a stunning new kitchen and bathroom, hardwood floors, and a bright, open layout throughout. The spacious living area leads into an enclosed porch that makes the perfect den, office, or relaxing sunroom. Enjoy the convenience of single level living, an in home laundry room, and a low maintenance lifestyle just minutes from shopping, dining, the Garden State Parkway, and the beaches of the Jersey Shore. Simply unpack and start enjoying everything this home and community have to offer.
Key facts
- New kitchen
- New bathroom
- Single level living
Tags
Property features AI
Finance
- HOA & community: Monthly association fee; Association fee covers trash, common area, fire/liability, lawn maintenance, sewer, snow removal, water; Community amenities: exercise room, clubhouse, common area, bocci; Association name: Cedar Glen Homes
Exterior
- Parking: No garage
- Utilities: Septic tank
- Home design: Attached property; Cooperative ownership
- Construction: Crawl space basement
- Exterior features: Shingle roof
Interior
- Kitchen: Dishwasher; Microwave; Stove; Refrigerator
- Bedrooms: 1 bedroom
- Flooring: Tile; Wood
- Bathrooms: 1 full bathroom
- Heating & cooling: Baseboard heating; Multiple cooling units
- Interior features: Outdoor lighting; Blinds/shades; Ceiling fan(s); Light fixtures; Gas cooking
- Laundry & utility: Washer; Dryer; AC units
Neighborhood map
What this means for you Summary
Snapshot
- This is a 1-bed/1.0-bath single-family listed at $94k. Condition is rated good.
Deal economics
- At list price, monthly cash flow is $554 ($7k/yr) — positive.
- The deal already cash-flows at list — no discount required.
- Meets the 1% rule at list price ($2k rent vs $94k).
- Recommended offer: $91k (3.0% below list) — sets the bar for market timing.
- Cap rate 13.4% vs local median 3.7% in Pine Lake Park — top-decile yield for the area; either an underpriced asset or a hidden risk that comps aren't pricing in. Stress-test before assuming the spread holds.
Location & tenants
- Location reads 65/100 on livability (#377 in NJ) — a middle-class / working-renter tenant base. Strengths: employment A+, housing A+, health & safety B+; Watch: schools F, amenities F, commute F.
- Manchester Township School District (suburban): math 25% / reading 44% proficiency, ranked #320 of 472 in NJ (top 68%) — families likely to look elsewhere, expect single-tenant / working-renter base with shorter leases.
- Market conditions: 491 active listings in the ZIP; 1 comparable units currently listed for rent nearby; 4,434 units permitted in Ocean County in 2024 (868 in 5+ unit buildings).
- This rent runs 44% of the median local income ($58k/yr) — at the standard rent-burdened threshold; future hikes will face affordability resistance.
Forward outlook
- Local home prices are declining (-3.0%/yr); year-one equity from $650 of loan paydown is wiped out by about $3k of value loss. Plan a longer hold.
- Ocean County population projected to shrink 8% by 2050 — rents likely to lag national; underwrite the cash flow, not the appreciation.
- At projected returns (-3.0% appreciation + 3.0% rent growth), your $26k cash investment doubles in ~5 years — after that, you're playing with house money.
Negotiation context
- It's been on market 31 days — a 3% lower offer ($91k) is reasonable based on typical stale-listing flexibility.
- 4 sale attempts with the ask held roughly flat each time — persistent listings suggest the price (not the market) is what's stuck; bring a comps-based counter.
Risks & watch-outs
- Watch-outs: HOA is 22% of rent.
- Climate carrying-cost: major wind risk, 64% chance of damaging wind over 30y; extreme-heat days projected 7→15/yr by 2055 (HVAC capex compounding) — expect insurance premiums to compound above CPI over the hold.
Questions for the listing agent
- It's been on market 31 days. Have you received any prior offers? Is the seller open to a 3% concession, seller financing, or rate buy-down credit?
- What does the HOA fee cover, when was the last increase, and are there any pending special assessments or reserve-fund shortfalls?
- Is there a deadline driving the sale (1031 exchange, divorce, estate, relocation)? That informs how much negotiation room exists.
- Schools are F-rated, which usually means shorter tenancies and higher turnover. Who's the typical renter profile here, and what's been the actual vacancy rate?
- What's the average days-on-market for RENTAL listings here right now (not sales)? A rising rental-DOM trend means longer vacancies and softer asking-rent achievability than the comps imply.
- What's the recent tenant-quality profile in this submarket — average credit score on applications, eviction rate, late-payment / NSF rate, and stable-employment percentage? A property-management company in the area should have these aggregated.
- How much new for-sale + rental construction is in the pipeline within 1–3 miles? Heavy new supply typically softens prices + rents 12–24 months out; constrained supply supports both.
Investment metrics
- 1% rule
- 2.26% ✓
- Cap rate
- 13.37%
- Cash-on-cash
- 25.27%
- DSCR
- 2.12
- GRM
- 3.7
CMA / ARV
- ARV (on-the-fly)
- $90,000
- Comps found
- 12
Show comp detail 12 sales within ~0.75 mi
| Address | Dist | Beds/Ba | Sqft | Sold | Price | $/sf | Match |
|---|---|---|---|---|---|---|---|
| 27 B Cedar St | 0.08mi | 2/1.0 (+1) | 900 (0%) | 4mo | $135,000 | $150 | 88 |
| 3 A Birch St | 0.08mi | 2/1.0 (+1) | 900 (0%) | 9mo | $77,000 | $86 | 84 |
| 9 Birch Dr Unit B | 0.11mi | 2/1.0 (+1) | 920 (+2%) | 5mo | $70,000 | $76 | 82 |
| 5 Cypress St Unit C | 0.25mi | 2/1.0 (+1) | 900 (0%) | 2mo | $70,000 | $78 | 82 |
| 9 Birch St Unit D | 0.09mi | 2/1.0 (+1) | 900 (0%) | 13mo | $90,000 | $100 | 80 |
| 2 Cypress St Unit C | 0.29mi | 1/1.0 | 900 (0%) | 11mo | $118,000 | $131 | 77 |
| 22 A Holly St Unit A | 0.10mi | 2/1.0 (+1) | 920 (+2%) | 14mo | $80,500 | $88 | 75 |
| 5a Cedar St | 0.23mi | 2/1.0 (+1) | 900 (0%) | 12mo | $100,000 | $111 | 74 |
| 6A Willow St | 0.18mi | 2/1.0 (+1) | 920 (+2%) | 18mo | $85,000 | $92 | 68 |
| 6 Magnolia St Unit C | 0.23mi | 2/1.0 (+1) | 900 (0%) | 21mo | $90,000 | $100 | 66 |
| 1 Willow St Unit A | 0.11mi | 1/1.0 | 984 (+9%) | 20mo | $85,000 | $86 | 63 |
| 1641 Madison Ave | 0.58mi | 2/1.0 (+1) | 821 (-9%) | 6mo | $360,000 | $438 | 48 |
Match score weights: distance 35% · size 25% · config 20% · recency 20%. Top-matched comps best support the ARV.
Projected returns pro-forma
-3.0% appreciation · 3.0% rent growth · sell at horizon
- IRR
- 19.0%
- Equity multiple
- 1.78×
- Total profit
- $20,398
- Equity at exit
- $14,016
- IRR
- 27.5%
- Equity multiple
- 3.45×
- Total profit
- $64,540
- Equity at exit
- $8,127
Cash invested: $26,320 (down + closing). Projections, not guarantees.
Landlord ↔ Tenant lean methodology
- Overall (STATE)
- 21 Tenant-Leaning
- State New Jersey
- 21 Tenant-Leaning · D+6
- County
- — inherits STATE
- City
- — inherits STATE
ZIP-level market 08757
- Active inventory
- 491
- Price-to-rent
- 3.7×
Monthly cashflow live
- Estimated rent
- $2,124 medium interval (Pro) →
- Mortgage (P&I)
- −$493
- Tax est. 1.5%
- −$118 /mo · $1,410/yr
- Insurance
- −$39
- HOA
- −$474
- Vacancy / Maint / Mgmt
- −$446
- Net cashflow
- $554
Break-even live
UW: 25.0% down · 7.5% · 30yr · 1.5% tax · 5.0% vac · 8.0% maint · 8.0% mgmt
Financing live
Cash to close
- Down payment
- $23,500
- Closing costs
- $2,820
- Reserves months
- —
- Total cash needed
- —
Loan-product check · same deal, 3 products live
Conventional
25% down · 7.5% · 30yr
- Down + closing
- —
- Monthly P&I
- —
- Monthly cashflow
- —
- DSCR
- —
- Eligible?
- —
Personal DTI + credit; lowest rate.
DSCR
20% down · 8.5% · 30yr
- Down + closing
- —
- Monthly P&I
- —
- Monthly cashflow
- —
- DSCR
- —
- Eligible?
- —
No personal income docs; deal must DSCR.
Hard money
10% down · 12.0% · 12mo
- Down + closing
- —
- Monthly P&I
- —
- Monthly cashflow
- —
- DSCR
- —
- Eligible?
- —
Short-term bridge; refi at stabilization.
Rent comps 1 comps
| Address | Beds | Baths | Sqft | Rent | $/sqft | DOM | Units | Dist |
|---|---|---|---|---|---|---|---|---|
| 43C Edinburgh Ln Manchester, NJ | 2.0 | 1.0 | 836 | $2,200 | $2.63 | 43d | 1 | 1.45mi |
HOA detail
- Monthly dues
- $474 · $5,688/yr
Listing history 23 events
-
2026-06-18days on market $94,000 Active 31 DOM
-
2026-06-17days on market $94,000 Active 30 DOM
-
2026-06-16days on market $94,000 Active 29 DOM
-
2026-06-15days on market $94,000 Active 28 DOM
-
2026-06-13days on market $94,000 Active 26 DOM
-
2026-06-09days on market $94,000 Active 22 DOM
-
2026-06-08days on market $94,000 Active 21 DOM
-
2026-06-07days on market $94,000 Active 20 DOM
-
2026-06-04days on market $94,000 Active 17 DOM
-
2026-06-03days on market $94,000 Active 16 DOM
-
2026-06-02days on market $94,000 Active 15 DOM
-
2026-06-01days on market $94,000 Active 14 DOM
-
2026-05-31days on market $94,000 Active 13 DOM
-
2026-05-18$94,000 Active 646-char remark
-
2025-10-13$99,500 Active
-
2025-09-16price $104,000
-
2025-08-21price $109,000
-
2025-08-04price $114,000
-
2025-07-08price $119,000
-
2025-06-26$129,000 Active
-
2025-06-01price $149,999
-
2025-04-10price $159,999
-
2025-03-14$169,999 Active
ⓘ Source: listings_history table (triggers on properties + properties_extension) + one-shot
backfill from property_details.listing_events for pre-trigger history.
Climate risk First Street
- Flood 1/10 Low FEMA zone X (unshaded) · 0% chance over 30 yrs
- Wildfire 3/10 Moderate
- Heat 7/10 Severe 7 d/yr ≥101°F today · 15 d/yr by 30 yrs out
- Wind 6/10 Major 64% chance of damaging wind over 30 yrs
- Air quality 3/10 Moderate 3 unhealthy d/yr today · 4 by 30 yrs out
Nearby sold comps map
Loading sold comps map…
Walkable amenities ~0.75 mi
Loading nearby amenities…
Taxation est. · year 1
- Rental income
- $25,488
- − Mortgage interest
- −$5,265
- − Property taxes
- −$1,410
- − Insurance
- −$470
- − Repairs & maintenance
- −$2,039
- − Management
- −$2,039
- − HOA
- −$5,688
- − Depreciation
- −$2,735
- Taxable income
- $5,842
- Est. tax owed @ 24.0%
- −$1,402
- After-tax cash flow
- $5,250/yr
For passive investors: Depreciation is non-cash, so a rental often shows a tax loss while cash-flowing — sheltering income. Rental losses are passive: they offset passive income freely, and up to $25,000/yr can offset ordinary (W-2) income if you actively participate and your MAGI is under $100k (phasing out to $0 by $150k); unused losses carry forward. On sale, claimed depreciation is recaptured at up to 25%, and gains may owe capital-gains tax (a 1031 exchange can defer both). Figures are a year-1 estimate at your 24.0% rate — not tax advice; consult a CPA.
Condition & rehab AI · 12 photos
This move-in ready home features updated kitchens and bathrooms, hardwood floors, and a bright, open layout. The exterior is well-maintained with a good curb appeal.
Value-add opportunities
- Resale Paint exterior trim — Enhances curb appeal and value
- Resale Replace outdoor light fixture — Improves curb appeal and safety
- Rental Replace outdoor light fixture — Improves curb appeal and safety
Renovation cost estimate screening
Value-add ROI direction
- Resale Paint exterior trim — Enhances curb appeal and value ↑
- Resale Replace outdoor light fixture — Improves curb appeal and safety ↑
- Rental Replace outdoor light fixture — Improves curb appeal and safety ↑
ⓘ Cost ranges are severity-bucket heuristics (US national rule-of-thumb). Get contractor quotes + a written scope before underwriting a rehab budget.
Schools (NCES district)
- District
- Manchester Township School District
- NCES district ID
- 3409450
- Math proficiency
- 25% ▼ -17.00%
- Reading proficiency
- 44% ▼ -5.00%
- Median HH income
- $38,905
- Composite
- 28.8/100
- National rank
- #6662
- State rank
- #320 of 472 in NJ
Livability — Pine Lake Park
- Score
- 65/100
- State rank
- #377
- US rank
- #12719
Category grades
Schools grade is shown separately in the Schools card above.
Census & demographics
- County
- Ocean County · 439,426 people
- Metro
- New York-Newark-Jersey City, NY-NJ-PA
- Population (ZIP)
- 36,087
- Household income
- $58,319
- Rent vs Own
- Severe rent burden
- 1010.0
Population outlook (Ocean County) Hauer SSP2
- Today (2025)
- 586,991 people
- By 2030
- 581,403 · -1.0%
- By 2040
- 564,913 · -3.8%
- By 2050
- 538,149 · -8.3%
- By 2075
- 468,845 · -20.1%
- By 2100
- 350,297 · -40.3%
Race, ethnicity, and origin ACS 2023
- Neighborhood character
- Predominantly White (75%)
- Race & ethnicity
- White 75% Hispanic / Latino 15% Two or more races 9% Black 5% Asian 2%
- Hispanic origin (detail)
- Mexican 4% Puerto Rican 6% Dominican 1%
- Common ancestry
- Romanian 9% Slovak 2% Iranian 2%
- Foreign-born
- 11% · Canada, Jamaica
- Languages at home
- 85% English-only · Spanish 7% Other Indo-European 3% Russian/Polish/Slavic 2%
Political lean MEDSL · Ocean
- 2024 margin
- Solid R (+36.0) · D 31.4% · R 67.4% · Other 1.2%
- 2008→2024 swing
- -17.6pp toward R · 2008: -18.4pp · 2024: -36.0pp
- All cycles
- 2024: R+36.0 2020: R+28.7 2016: R+34.0 2012: R+17.7 2008: R+18.4
Not yet ingested
- Civics
- —
Market trends
- HPI YoY
- ▼ -429.32%
- Current HPI
- 305.1341
- Rent YoY
- —
- Metro
- New York-Newark-Jersey City, NY-NJ-PA
- State GDP YoY
- ▲ 2.05%
- F500 in state
- 34
Industry mix (Fortune 500 HQ in NJ)
| Industry | F500 HQs | Revenue |
|---|---|---|
| Consumer Goods | 3 | $31B |
|
||
| Pharmaceuticals | 2 | $153B |
|
||
| Technology | 2 | $21B |
|
||
| Insurance | 2 | $20B |
|
||
| Healthcare | 2 | $19B |
|
||
| Financial Services | 1 | $70B |
|
||
Price history
-44.7% since first listed10 events — show timeline
- 2026-05-18 Listed $94,000 MOMLS
- 2025-10-13 Listed $99,500 MOMLS
- 2025-09-16 Price Changed $104,000 MOMLS
- 2025-08-21 Price Changed $109,000 MOMLS
- 2025-08-04 Price Changed $114,000 MOMLS
- 2025-07-08 Price Changed $119,000 MOMLS
- 2025-06-26 Listed $129,000 MOMLS
- 2025-06-01 Price Changed $149,999 MOMLS
- 2025-04-10 Price Changed $159,999 MOMLS
- 2025-03-14 Listed $169,999 MOMLS
Cash-flow waterfall
monthlySold comps — $/sqft
last 12 mo · ≤1 miLoading sold comps…