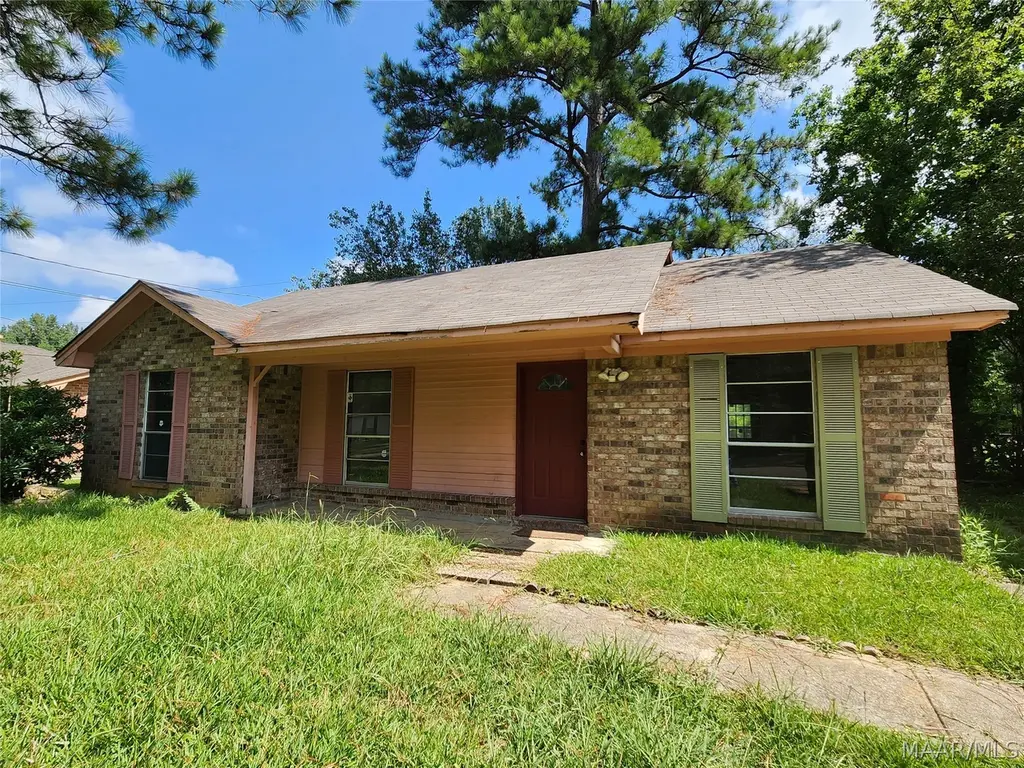
6133 Jennifer Ln · Montgomery, AL
Flood risk 1/10 · Minimal
- FEMA flood zone
- X (unshaded)
- Chance of flooding over 30 yrs
- 0.0%
- Est. flood insurance / yr
- $507 – $1,088
Fire risk 3/10 · Minor
- Est. fire insurance / yr
- $916 – $1,700
Heat risk 7/10 · Major
- Hot days now (above 107°F)
- 7 days/yr
- Hot days in 30 yrs
- 20 days/yr
Wind risk 8/10 · Major
- Chance of severe wind over 30 yrs
- 80.0%
Air-quality risk 2/10 · Minimal
- Unhealthy air days now
- 1 days/yr
- Unhealthy air days in 30 yrs
- 3 days/yr
Risk factors via First Street. Map © Google.
Why this score? — see what drove the C+ grade
The composite is a weighted blend of 9 inputs, each scored 0–100. Each bar is that input's sub-score; the figure is the points it added to the 100-point composite (weight × sub-score).
- Cash flow +30.0/30.0
- DSCR +10.0/10.0
- 1% rule +9.8/10.0
- Rent growth +3.9/5.0
- Livability +3.2/5.0
- ARV discount +3.0/15.0
- Condition / age +2.5/5.0
- Schools +1.7/10.0
- Appreciation +0.0/10.0
$80,000
🖨 Deal sheet 📄 Offer letter ✓ Due diligence
Listing remarks MLS
INVESTORS!! 3BR/2BA with fireplace in great room, kitchen and laundry room. Beautiful front yard with mature trees. Back yard with patio and separate storage building.
Key facts
- Laundry room
- Brick home
- Fenced backyard
Tags
Neighborhood map
What this means for you Summary
Snapshot
- This is a 3-bed/2.0-bath single-family listed at $80k.
Deal economics
- At list price, monthly cash flow is $437 ($5k/yr) — positive.
- The deal already cash-flows at list — no discount required.
- Meets the 1% rule at list price ($1k rent vs $80k).
- Recommended offer: $79k (1.5% below list) — sets the bar for market timing.
- Cap rate 12.8% vs local median 6.0% in Montgomery — top-decile yield for the area; either an underpriced asset or a hidden risk that comps aren't pricing in. Stress-test before assuming the spread holds.
Location & tenants
- Location reads 65/100 on livability (#138 in AL) — a middle-class / working-renter tenant base. Strengths: cost of living A+, housing A+; Watch: schools C-, employment D, crime F.
- Montgomery County (urban): math 9% / reading 31% proficiency, ranked #106 of 129 in AL (top 82%) — low school quality limits family demand, transient renter base, plan for 1-2y turnover; 70% free/reduced lunch — lower-income household profile, screen leases tightly.
- Market conditions: Rents rising fast (+5.7%/yr); 293 active listings in the ZIP; 13 comparable units currently listed for rent nearby; rentals lingering (median 44d on market — plan ~5-8 weeks vacancy on turnover, expect pricing pressure); 69% of comp listings sitting > 30 days — soft ceiling on asking rent; 460 units permitted in Montgomery County in 2024 (37 in 5+ unit buildings).
Forward outlook
- Local home prices are declining (-3.0%/yr); year-one equity from $553 of loan paydown is wiped out by about $2k of value loss. Plan a longer hold.
- Montgomery County population projected to shrink 8% by 2050 — rents likely to lag national; underwrite the cash flow, not the appreciation.
- At projected returns (-3.0% appreciation + 5.7% rent growth), your $22k cash investment doubles in ~5 years — after that, you're playing with house money.
Negotiation context
- It's been on market 17 days — a 2% lower offer ($79k) is reasonable based on typical stale-listing flexibility.
- 9 sale attempts since 21y ago with the ask held roughly flat each time — persistent listings suggest the price (not the market) is what's stuck; bring a comps-based counter.
- Current owner paid $47k; list at $80k implies a 70% gain — meaningful room to come down on a strong offer.
Risks & watch-outs
- Climate carrying-cost: severe wind risk, 80% chance of damaging wind over 30y; extreme-heat days projected 7→20/yr by 2055 (HVAC capex compounding) — expect insurance premiums to compound above CPI over the hold.
Questions for the listing agent
- Is there a deadline driving the sale (1031 exchange, divorce, estate, relocation)? That informs how much negotiation room exists.
- Crime grade is F in this area — have there been break-ins, vandalism, or insurance claims at this property in the last 3 years? What carrier currently insures it and at what premium?
- What's the average days-on-market for RENTAL listings here right now (not sales)? A rising rental-DOM trend means longer vacancies and softer asking-rent achievability than the comps imply.
- What's the recent tenant-quality profile in this submarket — average credit score on applications, eviction rate, late-payment / NSF rate, and stable-employment percentage? A property-management company in the area should have these aggregated.
- How much new for-sale + rental construction is in the pipeline within 1–3 miles? Heavy new supply typically softens prices + rents 12–24 months out; constrained supply supports both.
Investment metrics
- 1% rule
- 1.48% ✓
- Cap rate
- 12.84%
- Cash-on-cash
- 23.39%
- DSCR
- 2.04
- GRM
- 5.6
CMA / ARV
- ARV (median comp)
- $72,711
- List price
- $80,000
- Delta
- 10.02%
- Verdict
- OVERPRICED
- Comps
- 20 within 1.0 mi
Show comp detail 12 sales within ~0.75 mi
| Address | Dist | Beds/Ba | Sqft | Sold | Price | $/sf | Match |
|---|---|---|---|---|---|---|---|
| 6148 Sherburn Rd | 0.35mi | 3/2.0 | 1,209 (+1%) | 0mo | $77,000 | $64 | 82 |
| 6153 Cherry Hill Rd | 0.05mi | 3/2.0 | 1,075 (-10%) | 0mo | $20,000 | $19 | 80 |
| 6140 Cherry Hill Rd | 0.06mi | 4/2.0 (+1) | 1,227 (+2%) | 13mo | $75,000 | $61 | 78 |
| 6012 Oakleigh Rd | 0.26mi | 3/2.0 | 1,161 (-3%) | 6mo | $55,000 | $47 | 77 |
| 6017 Oakleigh Rd | 0.24mi | 3/2.0 | 1,227 (+2%) | 11mo | $68,000 | $55 | 76 |
| 6061 Briarhurst Dr | 0.17mi | 3/2.0 | 1,124 (-6%) | 8mo | $80,500 | $72 | 75 |
| 6000 Oakleigh Rd | 0.29mi | 3/1.0 | 1,080 (-10%) | 0mo | $21,000 | $19 | 65 |
| 4521 Lilly Ln | 0.37mi | 3/2.0 | 1,092 (-9%) | 8mo | $60,500 | $55 | 61 |
| 4535 Wimbledon Rd | 0.36mi | 3/2.0 | 1,092 (-9%) | 11mo | $22,000 | $20 | 59 |
| 6232 S Hampton Dr | 0.42mi | 3/2.0 | 1,068 (-11%) | 8mo | $75,000 | $70 | 55 |
| 6273 Briarwood Ln | 0.39mi | 4/2.0 (+1) | 1,275 (+6%) | 14mo | $75,000 | $59 | 54 |
| 6253 S Hampton Dr | 0.47mi | 3/2.0 | 1,080 (-10%) | 12mo | $75,000 | $69 | 51 |
Match score weights: distance 35% · size 25% · config 20% · recency 20%. Top-matched comps best support the ARV.
Projected returns pro-forma
-3.0% appreciation · 5.65% rent growth · sell at horizon
- IRR
- 19.2%
- Equity multiple
- 1.81×
- Total profit
- $18,057
- Equity at exit
- $11,928
- IRR
- 29.2%
- Equity multiple
- 3.92×
- Total profit
- $65,468
- Equity at exit
- $6,917
Cash invested: $22,400 (down + closing). Projections, not guarantees.
Landlord ↔ Tenant lean methodology
- Overall (STATE)
- 90 Strongly Landlord-Friendly
- State Alabama
- 90 Strongly Landlord-Friendly · R+15
- County
- — inherits STATE
- City
- — inherits STATE
ZIP-level market 36116
- Home prices YoY
- -9.7%
- Rents YoY
- 5.7%
- Active inventory
- 293
- Price-to-rent
- 5.6×
Monthly cashflow live
- Estimated rent
- $1,181 high interval (Pro) →
- Mortgage (P&I)
- −$420
- Tax from tax record
- −$44 /mo · $528/yr
- Insurance
- −$33
- HOA
- −$0
- Vacancy / Maint / Mgmt
- −$248
- Net cashflow
- $437
Break-even live
UW: 25.0% down · 7.5% · 30yr · 1.5% tax · 5.0% vac · 8.0% maint · 8.0% mgmt
Financing live
Cash to close
- Down payment
- $20,000
- Closing costs
- $2,400
- Reserves months
- —
- Total cash needed
- —
Loan-product check · same deal, 3 products live
Conventional
25% down · 7.5% · 30yr
- Down + closing
- —
- Monthly P&I
- —
- Monthly cashflow
- —
- DSCR
- —
- Eligible?
- —
Personal DTI + credit; lowest rate.
DSCR
20% down · 8.5% · 30yr
- Down + closing
- —
- Monthly P&I
- —
- Monthly cashflow
- —
- DSCR
- —
- Eligible?
- —
No personal income docs; deal must DSCR.
Hard money
10% down · 12.0% · 12mo
- Down + closing
- —
- Monthly P&I
- —
- Monthly cashflow
- —
- DSCR
- —
- Eligible?
- —
Short-term bridge; refi at stabilization.
Rent comps 13 comps
| Address | Beds | Baths | Sqft | Rent | $/sqft | DOM | Units | Dist |
|---|---|---|---|---|---|---|---|---|
| 6061 Briarhurst Dr Montgomery, AL | 3.0 | 2.0 | 1124 | $1,075 | $0.96 | 43d | 1 | 0.17mi |
| 6028 Oakleigh Rd Montgomery, AL | 3.0 | 2.0 | 1105 | $850 | $0.77 | 43d | 1 | 0.22mi |
| 5931 Singleton St Montgomery, AL | 3.0 | 2.5 | 1302 | $695 | $0.53 | 43d | 1 | 0.39mi |
| 4590 Troy Hwy Montgomery, AL | 2.0–3.0 | 2.0 | 1330 | $1,299 | $0.98 | 13d | 1 | 0.42mi |
| 5917 Cherry Hill Rd Montgomery, AL | 4.0 | 2.0 | 1161 | $1,450 | $1.25 | 13d | 1 | 0.50mi |
| 5819 Brewbaker Blvd Unit 5819 Montgomery, AL | 2.0 | 2.0 | 1200 | $1,200 | $1.00 | 43d | 1 | 0.90mi |
| 4025 Edge Hill Ln Montgomery, AL | 3.0 | 2.0 | 1154 | $1,350 | $1.17 | 13d | 1 | 1.15mi |
| 4611 Virginia Loop Rd Montgomery, AL | 3.0 | 1.0 | 1029 | $1,195 | $1.16 | 21d | 1 | 1.17mi |
| 3240 Virginia Pines Ln Montgomery, AL | 3.0 | 2.0 | 1215 | $900 | $0.74 | 43d | 1 | 1.21mi |
| 3231 Virginia Pines Ln Montgomery, AL | 2.0 | 2.0 | 1068 | $800 | $0.75 | 43d | 1 | 1.24mi |
| 4604 Virginia Loop Rd Montgomery, AL | 1.0–2.0 | 1.0–2.0 | 810 | $895 | $1.10 | 43d | 1 | 1.27mi |
| 3220 Virginia Downs Montgomery, AL | 3.0 | 2.0 | 1215 | $900 | $0.74 | 43d | 1 | 1.46mi |
| 3248 Meadow Walk Ln Montgomery, AL | 3.0 | 2.0 | 1114 | $1,200 | $1.08 | 43d | 1 | 1.48mi |
Listing history 31 events
-
2026-06-18days on market $80,000 Active 17 DOM
-
2026-06-17days on market $80,000 Active 16 DOM
-
2026-06-16days on market $80,000 Active 15 DOM
-
2026-06-15days on market $80,000 Active 14 DOM
-
2026-06-14days on market $80,000 Active 12 DOM
-
2026-06-13days on market $80,000 Active 11 DOM
-
2026-06-10days on market $80,000 Active 9 DOM
-
2026-06-09days on market $80,000 Active 8 DOM
-
2026-06-08days on market $80,000 Active 7 DOM
-
2026-06-07days on market $80,000 Active 6 DOM
-
2026-06-03days on market $80,000 Active 2 DOM
-
2026-06-02remarks 406-char remark
-
2026-06-02days on market $80,000 Active 1 DOM
-
2026-03-13status Active 168-char remark
Show marketing remark (168 chars)
INVESTORS!! 3BR/2BA with fireplace in great room, kitchen and laundry room. Beautiful front yard with mature trees. Back yard with patio and separate storage building.
-
2026-03-01historical Contingent 168-char remark
Show marketing remark (168 chars)
INVESTORS!! 3BR/2BA with fireplace in great room, kitchen and laundry room. Beautiful front yard with mature trees. Back yard with patio and separate storage building.
-
2026-02-10$80,000 Active 168-char remark
Show marketing remark (168 chars)
INVESTORS!! 3BR/2BA with fireplace in great room, kitchen and laundry room. Beautiful front yard with mature trees. Back yard with patio and separate storage building.
-
2025-09-16status Active
-
2025-04-29historical Contingent
-
2025-01-09status Active
-
2024-11-29historical Contingent
-
2024-10-29status Active
-
2024-10-29historical Contingent
-
2024-10-28status Active
-
2024-10-23historical Contingent
-
2024-08-11$90,000 Active
-
2022-04-08soldstatus $47,000
-
2022-02-08soldstatus $47,000
-
2022-02-03soldstatus $47,000
-
2021-08-14$59,500
-
2005-04-19soldstatus $59,000
-
2005-01-29$55,000
ⓘ Source: listings_history table (triggers on properties + properties_extension) + one-shot
backfill from property_details.listing_events for pre-trigger history.
Tax reassessment forecast AL · Resets to sale price
- Current annual tax
- $528 · $44/mo
- Projected year-2 tax
- $528 · $44/mo
- Expected delta
- $0/yr ($0/mo · 0.0%)
ⓘ Screening estimate from a state-policy table — verify with the county assessor before closing.
Climate risk First Street
- Flood 1/10 Low FEMA zone X (unshaded) · 0% chance over 30 yrs
- Wildfire 3/10 Moderate
- Heat 7/10 Severe 7 d/yr ≥107°F today · 20 d/yr by 30 yrs out
- Wind 8/10 Severe 80% chance of damaging wind over 30 yrs
- Air quality 2/10 Low 1 unhealthy d/yr today · 3 by 30 yrs out
Nearby sold comps map
Loading sold comps map…
Walkable amenities ~0.75 mi
Loading nearby amenities…
Taxation est. · year 1
- Rental income
- $14,178
- − Mortgage interest
- −$4,481
- − Property taxes
- −$528
- − Insurance
- −$400
- − Repairs & maintenance
- −$1,134
- − Management
- −$1,134
- − Depreciation
- −$2,327
- Taxable income
- $4,173
- Est. tax owed @ 24.0%
- −$1,002
- After-tax cash flow
- $4,237/yr
For passive investors: Depreciation is non-cash, so a rental often shows a tax loss while cash-flowing — sheltering income. Rental losses are passive: they offset passive income freely, and up to $25,000/yr can offset ordinary (W-2) income if you actively participate and your MAGI is under $100k (phasing out to $0 by $150k); unused losses carry forward. On sale, claimed depreciation is recaptured at up to 25%, and gains may owe capital-gains tax (a 1031 exchange can defer both). Figures are a year-1 estimate at your 24.0% rate — not tax advice; consult a CPA.
Schools (NCES district)
- District
- Montgomery County
- NCES district ID
- 0102430
- Math proficiency
- 9% ▼ -21.00%
- Reading proficiency
- 31% ▼ -1.00%
- Median HH income
- $43,902
- Composite
- 17.24/100
- National rank
- #9093
- State rank
- #106 of 129 in AL
Livability — Montgomery
- Score
- 65/100
- State rank
- #138
- US rank
- #13416
Category grades
Schools grade is shown separately in the Schools card above.
Census & demographics
- Census place
- Montgomery, AL
- County
- Montgomery County · 190,016 people
- City population
- 175,913
- Metro
- Montgomery, AL
- Population (ZIP)
- 45,250
- Household income
- $55,160
- Rent vs Own
- Severe rent burden
- 2786.0
Population outlook (Montgomery County) Hauer SSP2
- Today (2025)
- 224,008 people
- By 2030
- 221,460 · -1.1%
- By 2040
- 214,179 · -4.4%
- By 2050
- 204,912 · -8.5%
- By 2075
- 177,821 · -20.6%
- By 2100
- 145,134 · -35.2%
Race, ethnicity, and origin ACS 2023
- Neighborhood character
- Predominantly Black (80%)
- Race & ethnicity
- Black 80% White 12% Two or more races 4% Asian 3% Hispanic / Latino 2%
- Common ancestry
- Italian 1%
- Foreign-born
- 5% · Canada, South Korea
- Languages at home
- 94% English-only · Spanish 2% Other Indo-European 1% Korean 1%
Political lean MEDSL · Montgomery
- 2024 margin
- Solid D (+30.7) · D 64.8% · R 34.1% · Other 1.1%
- 2008→2024 swing
- +11.5pp toward D · 2008: 19.2pp · 2024: 30.7pp
- All cycles
- 2024: D+30.7 2020: D+31.5 2016: D+26.2 2012: D+24.3 2008: D+19.2
Not yet ingested
- Civics
- —
Market trends
- HPI YoY
- ▼ -16.31%
- Current HPI
- 151.8598
- Rent YoY
- ▲ 5.65%
- Metro
- Montgomery, AL
- State GDP YoY
- ▲ 2.94%
- F500 in state
- 4
Industry mix (Fortune 500 HQ in AL)
| Industry | F500 HQs | Revenue |
|---|---|---|
| Financial Services | 1 | $8B |
|
||
| Healthcare | 1 | $5B |
|
||
Price history
+45.5% since first listed18 events — show timeline
- 2026-03-13 Relisted — MAAR
- 2026-03-01 Contingent — MAAR
- 2026-02-10 Listed $80,000 MAAR
- 2025-09-16 Relisted — MAAR
- 2025-04-29 Contingent — MAAR
- 2025-01-09 Relisted — MAAR
- 2024-11-29 Contingent — MAAR
- 2024-10-29 Relisted — MAAR
- 2024-10-29 Contingent — MAAR
- 2024-10-28 Relisted — MAAR
- 2024-10-23 Contingent — MAAR
- 2024-08-11 Listed $90,000 MAAR
- 2022-04-08 Sold (Public Records) $47,000 Public Records
- 2022-02-08 Sold (Public Records) $47,000 Public Records
- 2022-02-03 Sold (MLS) $47,000 MAAR
- 2021-08-14 Listed $59,500 MAAR
- 2005-04-19 Sold (MLS) $59,000 MAAR
- 2005-01-29 Listed $55,000 MAAR
Property tax history
+10.3%/yrLatest (2025): $528 · +51.9% YoY. Source: county tax records.
Cash-flow waterfall
monthlySold comps — $/sqft
last 12 mo · ≤1 miLoading sold comps…