8596 Creekwood Way · Jonesboro, GA
Flood risk 1/10 · Minimal
- FEMA flood zone
- X (unshaded)
- Chance of flooding over 30 yrs
- 0.0%
- Est. flood insurance / yr
- $507 – $1,088
Fire risk 3/10 · Minor
- Est. fire insurance / yr
- $963 – $1,789
Heat risk 6/10 · Moderate
- Hot days now (above 105°F)
- 7 days/yr
- Hot days in 30 yrs
- 18 days/yr
Wind risk 6/10 · Moderate
- Chance of severe wind over 30 yrs
- 27.0%
Air-quality risk 4/10 · Minor
- Unhealthy air days now
- 4 days/yr
- Unhealthy air days in 30 yrs
- 6 days/yr
Risk factors via First Street. Map © Google.
Why this score? — see what drove the B grade
The composite is a weighted blend of 9 inputs, each scored 0–100. Each bar is that input's sub-score; the figure is the points it added to the 100-point composite (weight × sub-score).
- Cash flow +30.0/30.0
- ARV discount +15.0/15.0
- DSCR +10.0/10.0
- 1% rule +9.0/10.0
- Livability +3.6/5.0
- Rent growth +3.0/5.0
- Condition / age +2.5/5.0
- Schools +1.3/10.0
- Appreciation +0.0/10.0
$123,800
🖨 Deal sheet (PDF) 📄 Offer letter ✓ Due diligence
Listing remarks
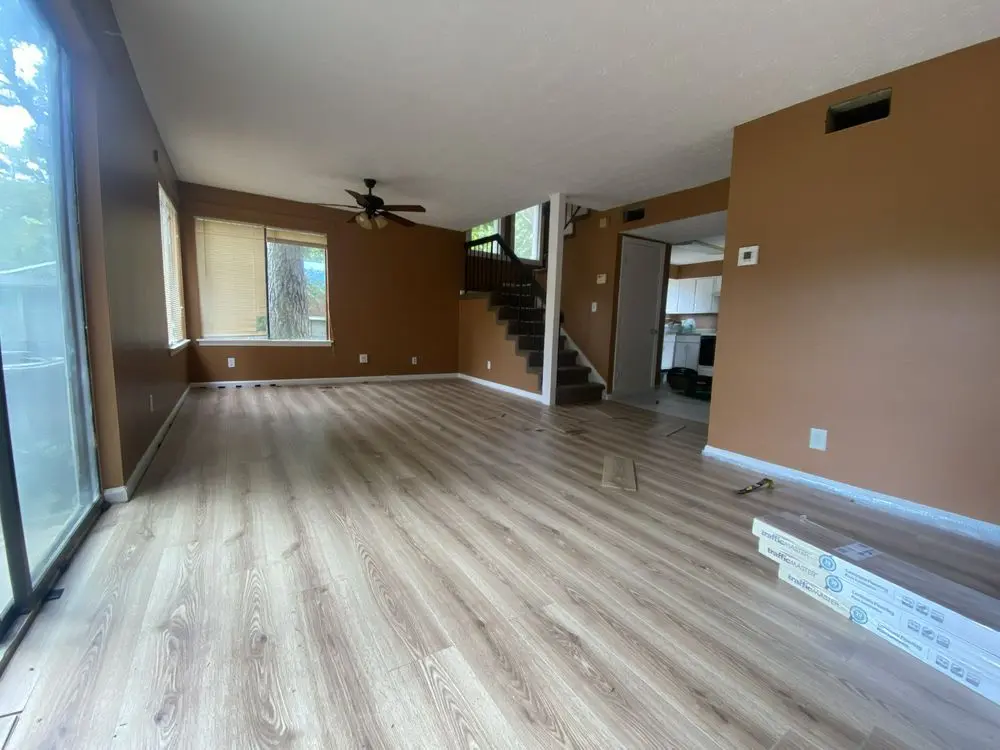
Welcome to this 3-bedroom, 1.5-bath two-story townhome located in Parkvilla Condominiums. Previously utilized as a rental, this property features an open kitchen with abundant cabinet space, along with separate dining and living areas that provide a functional layout for residents. Improvements include a newer water heater and HVAC system for added confidence in the major components. An excellent opportunity for buyers seeking an income-producing property or as a starter home. PROPERTY SOLD AS IS. NO SELLER'S DISCLOSURE. PROOF OF FUNDS AND EARNEST MONEY REQUIRED WITH OFFER. SELLER FINANCING AVAILABLE WITH 20% DOWN PAYMENT.
Key facts
- Newer water heater
- Open kitchen
- Newer hvac system
Tags
Neighborhood map
What this means for you Summary
Snapshot
- This is a 3-bed/2.0-bath townhouse listed at $124k.
Deal economics
- At list price, monthly cash flow is $540 ($6k/yr) — positive.
- The deal already cash-flows at list — no discount required.
- Meets the 1% rule at list price ($2k rent vs $124k).
- Cap rate 11.5% vs local median 5.0% in Jonesboro — top-decile yield for the area; either an underpriced asset or a hidden risk that comps aren't pricing in. Stress-test before assuming the spread holds.
Location & tenants
- Location reads 72/100 on livability (#63 in GA) — a middle-class / working-renter tenant base. Strengths: cost of living A+, housing A-; Watch: crime C-, employment D, schools F.
- Clayton County (suburban): math 11% / reading 20% proficiency, ranked #155 of 174 in GA (top 89%) — low school quality limits family demand, transient renter base, plan for 1-2y turnover; 78% free/reduced lunch — lower-income household profile, screen leases tightly.
- Market conditions: Rents rising (+2.1%/yr); 251 active listings in the ZIP; 40 comparable units currently listed for rent nearby; rentals at typical pace (median 25d on market — plan ~3-4 weeks tenant-placement turnaround); 40% of comp listings sitting > 30 days — soft ceiling on asking rent; 865 units permitted in Clayton County in 2024 (448 in 5+ unit buildings).
- This rent runs 33% of the median local income ($62k/yr) — at the standard rent-burdened threshold; future hikes will face affordability resistance.
Forward outlook
- Local home prices are declining (-3.0%/yr); year-one equity from $856 of loan paydown is wiped out by about $4k of value loss. Plan a longer hold.
- Clayton County population projected at +29% by 2050 — long-run rental-demand tailwind backs the buy-and-hold thesis.
- At projected returns (-3.0% appreciation + 2.1% rent growth), your $35k cash investment doubles in ~7 years — after that, you're playing with house money.
Negotiation context
- Only 1 days on market — expect competitive offers; lowballing is unlikely to land.
- 8 sale attempts since 12y ago with the ask held roughly flat each time — persistent listings suggest the price (not the market) is what's stuck; bring a comps-based counter.
- Current owner paid $38k; list at $124k implies a 226% gain — meaningful room to come down on a strong offer.
Risks & watch-outs
- Climate carrying-cost: major wind risk, 27% chance of damaging wind over 30y; extreme-heat days projected 7→18/yr by 2055 (HVAC capex compounding) — expect insurance premiums to compound above CPI over the hold.
Questions for the listing agent
- Built in 1974 — when were the roof, HVAC, electrical panel, plumbing, and water heater last replaced?
- Is there a deadline driving the sale (1031 exchange, divorce, estate, relocation)? That informs how much negotiation room exists.
- Schools are F-rated, which usually means shorter tenancies and higher turnover. Who's the typical renter profile here, and what's been the actual vacancy rate?
- What's the average days-on-market for RENTAL listings here right now (not sales)? A rising rental-DOM trend means longer vacancies and softer asking-rent achievability than the comps imply.
- What's the recent tenant-quality profile in this submarket — average credit score on applications, eviction rate, late-payment / NSF rate, and stable-employment percentage? A property-management company in the area should have these aggregated.
- How much new for-sale + rental construction is in the pipeline within 1–3 miles? Heavy new supply typically softens prices + rents 12–24 months out; constrained supply supports both.
Investment metrics
- 1% rule
- 1.40% ✓
- Cap rate
- 11.53%
- Cash-on-cash
- 18.69%
- DSCR
- 1.83
- GRM
- 6.0
CMA / ARV
- ARV (on-the-fly)
- $212,352
- Comps found
- 12
Show comp detail 12 sales within ~0.75 mi
| Address | Dist | Beds/Ba | Sqft | Sold | Price | $/sf | Match |
|---|---|---|---|---|---|---|---|
| 8588 Creekwood Way | 0.02mi | 3/1.5 | 1,344 (0%) | 4mo | $94,000 | $70 | 94 |
| 8598 Creekwood Way | 0.00mi | 3/1.5 | 1,344 (0%) | 14mo | $115,000 | $86 | 87 |
| 922 Lakewood Ln | 0.14mi | 3/1.5 | 1,344 (0%) | 13mo | $115,000 | $86 | 80 |
| 8560 Creekwood Way | 0.05mi | 4/1.5 (+1) | 1,423 (+6%) | 3mo | $100,000 | $70 | 78 |
| 8642 Lakeview Cmns Lot 36 | 0.45mi | 3/2.5 | 1,510 (+12%) | 13mo | $245,000 | $162 | 46 |
| 8662 Thomas Rd | 0.58mi | 3/2.5 | 1,530 (+14%) | 2mo | $195,000 | $127 | 46 |
| 8660 Lakeview Cmns Lot 39 | 0.45mi | 3/2.5 | 1,510 (+12%) | 13mo | $245,900 | $163 | 46 |
| 8678 Lakeview Cmns Lot 42 | 0.46mi | 3/2.5 | 1,510 (+12%) | 14mo | $245,000 | $162 | 45 |
| 8708 Lakeview Cmns Lot 47 | 0.47mi | 3/2.5 | 1,510 (+12%) | 13mo | $245,900 | $163 | 45 |
| 8726 Lakeview Cmns Lot 50 | 0.47mi | 3/2.5 | 1,510 (+12%) | 13mo | $245,900 | $163 | 44 |
| 711 Redland Dr | 0.27mi | 2/2.5 (-1) | 1,160 (-14%) | 17mo | $183,000 | $158 | 43 |
| 8628 Thomas Rd | 0.57mi | 3/2.5 | 1,530 (+14%) | 13mo | $180,000 | $118 | 38 |
Match score weights: distance 35% · size 25% · config 20% · recency 20%. Top-matched comps best support the ARV.
Projected returns pro-forma
-3.0% appreciation · 2.06% rent growth · sell at horizon
- IRR
- 9.4%
- Equity multiple
- 1.37×
- Total profit
- $12,708
- Equity at exit
- $18,459
- IRR
- 17.8%
- Equity multiple
- 2.41×
- Total profit
- $48,843
- Equity at exit
- $10,704
Cash invested: $34,664 (down + closing). Projections, not guarantees.
Landlord ↔ Tenant lean methodology
- Overall (STATE)
- 90 Strongly Landlord-Friendly
- State Georgia
- 90 Strongly Landlord-Friendly · R+3
- County
- — inherits STATE
- City
- — inherits STATE
ZIP-level market 30238
- Home prices YoY
- -33.3%
- Rents YoY
- 2.1%
- Active inventory
- 251
- Price-to-rent
- 6.0×
Monthly cashflow live
- Estimated rent
- $1,732 high interval (Pro) →
- Mortgage (P&I)
- −$649
- Tax from tax record
- −$128 /mo · $1,533/yr
- Insurance
- −$52
- HOA
- −$0
- Vacancy / Maint / Mgmt
- −$364
- Net cashflow
- $540
Break-even live
Sensitivity live
| Price | -10% $610 | -5% $575 | +0% $540 | +5% $505 | +10% $470 |
|---|---|---|---|---|---|
| Rent | -10% $403 | -5% $471 | +0% $540 | +5% $608 | +10% $677 |
| Rate | -1.0pp $602 | -0.5pp $571 | base $540 | +0.5pp $508 | +1.0pp $475 |
UW: 25.0% down · 7.5% · 30yr · 1.5% tax · 5.0% vac · 8.0% maint · 8.0% mgmt
Financing live
Cash to close
- Down payment
- $30,950
- Closing costs
- $3,714
- Reserves months
- —
- Total cash needed
- —
Loan-product check · same deal, 3 products live
Conventional
25% down · 7.5% · 30yr
- Down + closing
- —
- Monthly P&I
- —
- Monthly cashflow
- —
- DSCR
- —
- Eligible?
- —
Personal DTI + credit; lowest rate.
DSCR
20% down · 8.5% · 30yr
- Down + closing
- —
- Monthly P&I
- —
- Monthly cashflow
- —
- DSCR
- —
- Eligible?
- —
No personal income docs; deal must DSCR.
Hard money
10% down · 12.0% · 12mo
- Down + closing
- —
- Monthly P&I
- —
- Monthly cashflow
- —
- DSCR
- —
- Eligible?
- —
Short-term bridge; refi at stabilization.
Rent comps 40 comps
| Address | Beds | Baths | Sqft | Rent | $/sqft | DOM | Units | Dist |
|---|---|---|---|---|---|---|---|---|
| 8588 Creekwood Way Jonesboro, GA | 3.0 | 1.5 | 1344 | $1,300 | $0.97 | 5d | 1 | 0.03mi |
| 8671 Woodside Ln Jonesboro, GA | 2.0 | 2.0 | 1025 | $1,350 | $1.32 | 22d | 1 | 0.17mi |
| 8671 Woodside Ln Jonesboro, GA | 2.0 | 2.0 | 1025 | $1,350 | $1.32 | 13d | 1 | 0.17mi |
| 785 Redland Dr Jonesboro, GA | 4.0 | 2.0 | 1496 | $1,935 | $1.29 | 13d | 1 | 0.17mi |
| 801 Redland Dr Jonesboro, GA | 3.0 | 2.0 | 1370 | $1,725 | $1.26 | 13d | 1 | 0.19mi |
| 801 Redland Dr Jonesboro, GA | 3.0 | 2.0 | 1370 | $1,750 | $1.28 | 44d | 1 | 0.19mi |
| 634 Morton Ct Unit 636 Jonesboro, GA | 2.0 | 1.5 | 1050 | $1,225 | $1.17 | 44d | 1 | 0.41mi |
| 1022 Brandon Hill Way Jonesboro, GA | 3.0 | 2.0 | 1022 | $1,615 | $1.58 | 24d | 1 | 0.42mi |
| 693 Oak Dr Riverdale, GA | 4.0 | 2.5 | 1325 | $1,825 | $1.38 | 5d | 1 | 0.43mi |
| 1 Lakeview Way Jonesboro, GA | 2.0 | 2.0 | 1160 | $1,937 | $1.67 | 24d | 1 | 0.45mi |
| 1 Lakeview Way Jonesboro, GA | 2.0 | 2.0 | 1160 | $1,531 | $1.32 | 44d | 1 | 0.45mi |
| 772 Pointe South Pkwy Jonesboro, GA | 3.0 | 2.5 | 1202 | $1,384 | $1.15 | 44d | 1 | 0.46mi |
| 8609 Thomas Ln Riverdale, GA | 3.0 | 2.5 | 1530 | $1,658 | $1.08 | 24d | 1 | 0.48mi |
| 8631 Thomas Ln Riverdale, GA | 3.0 | 2.5 | 1530 | $1,673 | $1.09 | 22d | 1 | 0.48mi |
| 8641 Thomas Ln Riverdale, GA | 4.0 | 3.0 | 1540 | $1,863 | $1.21 | 5d | 1 | 0.49mi |
| 8643 Thomas Ln Riverdale, GA | 3.0 | 2.5 | 1530 | $1,818 | $1.19 | 24d | 1 | 0.49mi |
| 8640 Thomas Ln Riverdale, GA | 3.0 | 2.5 | 1530 | $1,673 | $1.09 | 24d | 1 | 0.51mi |
| 100 Chase Ridge Dr Riverdale, GA | 2.0 | 2.0 | 1175 | $1,545 | $1.31 | 44d | 1 | 0.51mi |
| 100 Chase Ridge Dr Riverdale, GA | 1.0–2.0 | 1.0–2.0 | 1002 | $1,545 | $1.54 | 5d | 6 | 0.51mi |
| 8644 Thomas Ln Riverdale, GA | 3.0 | 2.5 | 1530 | $1,623 | $1.06 | 44d | 1 | 0.51mi |
| 8669 Thomas Rd Riverdale, GA | 3.0 | 2.5 | 1532 | $1,623 | $1.06 | 44d | 1 | 0.54mi |
| 8612 Thomas Rd Riverdale, GA | 3.0 | 2.5 | 1532 | $1,623 | $1.06 | 44d | 1 | 0.57mi |
| 8630 Thomas Rd Riverdale, GA | 3.0 | 2.5 | 1530 | $1,500 | $0.98 | 24d | 1 | 0.57mi |
| 100 Chase Ridge Dr Unit 1005 Riverdale, GA | 2.0 | 2.0 | 1175 | $1,395 | $1.19 | 44d | 1 | 0.58mi |
| 8443 Cedar Creek Rdg Riverdale, GA | 3.0 | 2.0 | 1476 | $1,735 | $1.18 | 20d | 1 | 0.61mi |
| 8584 Guthrie Dr Riverdale, GA | 3.0 | 2.0 | 1445 | $1,650 | $1.14 | 15d | 1 | 0.72mi |
| 8600 Cedar Creek Rdg Riverdale, GA | 3.0 | 2.0 | 1555 | $1,745 | $1.12 | 5d | 1 | 0.78mi |
| 8614 Cedar Creek Rdg Riverdale, GA | 3.0 | 2.5 | 1728 | $1,500 | $0.87 | 44d | 1 | 0.78mi |
| 8983 Habersham Dr Jonesboro, GA | 4.0 | 2.0 | 1770 | $1,910 | $1.08 | 45d | 1 | 0.79mi |
| 575 Oak Trace Ct Jonesboro, GA | 3.0 | 2.0 | 1302 | $1,761 | $1.35 | 44d | 1 | 0.79mi |
| 1124 Cliftwood Dr Riverdale, GA | 4.0 | 3.0 | 1845 | $2,165 | $1.17 | 22d | 1 | 0.79mi |
| 1132 Cliftwood Dr Riverdale, GA | 3.0 | 2.5 | 1616 | $2,200 | $1.36 | 44d | 1 | 0.81mi |
| 9039 Raven Dr Jonesboro, GA | 4.0 | 2.0 | 1560 | $1,795 | $1.15 | 44d | 1 | 0.89mi |
| 372 Cheri Pl Jonesboro, GA | 3.0 | 2.0 | 1468 | $1,749 | $1.19 | 24d | 1 | 0.90mi |
| 432 Wesley Park Dr Jonesboro, GA | 3.0 | 2.0 | 1350 | $1,685 | $1.25 | 24d | 1 | 0.90mi |
| 655 Post Oak Rd Jonesboro, GA | 3.0 | 1.0 | 1302 | $1,600 | $1.23 | 15d | 1 | 0.96mi |
| 640 Post Oak Rd Jonesboro, GA | 3.0 | 2.0 | 1508 | $1,780 | $1.18 | 5d | 1 | 1.01mi |
| 426 Park Ridge Cir Riverdale, GA | 3.0 | 2.0 | 1578 | $1,773 | $1.12 | 44d | 1 | 1.04mi |
| 672 Raven Ct Jonesboro, GA | 3.0 | 2.0 | 1362 | $1,645 | $1.21 | 44d | 1 | 1.04mi |
| 8931 Wesley Pl Jonesboro, GA | 3.0 | 2.0 | 1216 | $1,498 | $1.23 | 24d | 1 | 1.05mi |
Listing history 2 events
-
2026-06-10remarks 630-char remark
-
2026-06-10$123,800 Active 1 DOM
ⓘ Source: listings_history table (triggers on properties + properties_extension) + one-shot
backfill from property_details.listing_events for pre-trigger history.
Tax reassessment forecast GA · Resets to sale price
- Current annual tax
- $1,533 · $128/mo
- Projected year-2 tax
- $1,533 · $128/mo
- Expected delta
- $0/yr ($0/mo · 0.0%)
ⓘ Screening estimate from a state-policy table — verify with the county assessor before closing.
Climate risk First Street
- Flood 1/10 Low FEMA zone X (unshaded) · 0% chance over 30 yrs
- Wildfire 3/10 Moderate
- Heat 6/10 Major 7 d/yr ≥105°F today · 18 d/yr by 30 yrs out
- Wind 6/10 Major 27% chance of damaging wind over 30 yrs
- Air quality 4/10 Moderate 4 unhealthy d/yr today · 6 by 30 yrs out
Nearby sold comps map
Loading sold comps map…
Walkable amenities ~0.75 mi
Loading nearby amenities…
Taxation est. · year 1
- Rental income
- $20,786
- − Mortgage interest
- −$6,935
- − Property taxes
- −$1,533
- − Insurance
- −$619
- − Repairs & maintenance
- −$1,663
- − Management
- −$1,663
- − Depreciation
- −$3,601
- Taxable income
- $4,772
- Est. tax owed @ 24.0%
- −$1,145
- After-tax cash flow
- $5,333/yr
For passive investors: Depreciation is non-cash, so a rental often shows a tax loss while cash-flowing — sheltering income. Rental losses are passive: they offset passive income freely, and up to $25,000/yr can offset ordinary (W-2) income if you actively participate and your MAGI is under $100k (phasing out to $0 by $150k); unused losses carry forward. On sale, claimed depreciation is recaptured at up to 25%, and gains may owe capital-gains tax (a 1031 exchange can defer both). Figures are a year-1 estimate at your 24.0% rate — not tax advice; consult a CPA.
Schools (NCES district)
- District
- Clayton County
- NCES district ID
- 1301230
- Math proficiency
- 11% ▼ -13.00%
- Reading proficiency
- 20% ▼ -9.00%
- Median HH income
- $42,266
- Composite
- 13.41/100
- National rank
- #9527
- State rank
- #155 of 174 in GA
Livability — Jonesboro
- Score
- 72/100
- State rank
- #63
- US rank
- #6030
Category grades
Schools grade is shown separately in the Schools card above.
Census & demographics
- County
- Clayton County · 230,153 people
- City population
- 93,280
- Metro
- Atlanta-Sandy Springs-Alpharetta, GA
- Population (ZIP)
- 43,191
- Household income
- $62,185
- Rent vs Own
- Severe rent burden
- 1992.0
Population outlook (Clayton County) Hauer SSP2
- Today (2025)
- 310,777 people
- By 2030
- 329,762 · +6.1%
- By 2040
- 368,052 · +18.4%
- By 2050
- 401,196 · +29.1%
- By 2075
- 472,488 · +52.0%
- By 2100
- 500,446 · +61.0%
Race, ethnicity, and origin ACS 2023
- Neighborhood character
- Predominantly Black (71%)
- Race & ethnicity
- Black 71% Hispanic / Latino 17% White 7% Two or more races 7%
- Hispanic origin (detail)
- Mexican 13% Puerto Rican 2%
- Foreign-born
- 11% · Canada, United Kingdom
- Languages at home
- 83% English-only · Spanish 14% French/Haitian/Cajun 1%
Political lean MEDSL · Clayton
- 2024 margin
- Solid D (+69.2) · D 84.3% · R 15.1%
- 2008→2024 swing
- +2.8pp toward D · 2008: 66.4pp · 2024: 69.2pp
- All cycles
- 2024: D+69.2 2020: D+70.9 2016: D+71.9 2012: D+70.1 2008: D+66.4
Not yet ingested
- Civics
- —
Market trends
- HPI YoY
- ▼ -105.48%
- Current HPI
- 211.6309
- Rent YoY
- ▲ 2.06%
- Metro
- Atlanta-Sandy Springs-Alpharetta, GA
- State GDP YoY
- ▲ 2.66%
- F500 in state
- 28
Industry mix (Fortune 500 HQ in GA)
| Industry | F500 HQs | Revenue |
|---|---|---|
| Paper / Packaging | 2 | $29B |
|
||
| Retail | 1 | $160B |
|
||
| Transportation / Logistics | 1 | $91B |
|
||
| Airlines | 1 | $62B |
|
||
| Consumer Goods | 1 | $47B |
|
||
| Utilities | 1 | $25B |
|
||
Price history
+249.7% since first listed44 events — show timeline
- 2026-06-09 Listed $123,800 ForSaleByOwner.com
- 2025-08-31 Listing Removed — GAMLS
- 2025-07-01 Listed $115,000 GAMLS
- 2025-06-18 Listing Removed — GAMLS
- 2025-06-16 Listing Removed — FMLS
- 2025-01-06 Price Changed $118,000 FMLS
- 2025-01-06 Price Changed $118,000 GAMLS
- 2024-12-27 Price Changed $126,000 FMLS
- 2024-11-27 Price Changed $126,000 GAMLS
- 2024-10-29 Price Changed $129,000 GAMLS
- 2024-10-28 Listed $129,000 FMLS
- 2024-10-28 Listed $132,000 GAMLS
- 2018-02-23 Sold (Public Records) $38,000 Public Records
- 2017-10-08 Listing Removed — GAMLS
- 2017-10-04 Price Changed $49,000 GAMLS
- 2017-08-05 Price Changed $52,400 GAMLS
- 2017-07-07 Listed $52,500 GAMLS
- 2017-07-01 Listing Removed — GAMLS
- 2017-06-14 Price Changed $53,500 GAMLS
- 2017-05-03 Listed $55,000 GAMLS
- 2015-03-31 Price Changed $39,000 GAMLS
- 2015-03-24 Sold (Public Records) $39,000 Public Records
- 2015-03-12 Sold (MLS) $39,000 GAMLS
- 2015-03-03 Pending — GAMLS
- 2015-02-25 Price Changed $42,500 GAMLS
- 2015-01-19 Price Changed $42,500 GAMLS
- 2014-12-20 Price Changed $45,000 GAMLS
- 2014-12-17 Price Changed $46,000 GAMLS
- 2014-12-16 Price Changed $47,000 GAMLS
- 2014-12-16 Price Changed $46,000 GAMLS
- 2014-12-04 Price Changed $48,000 GAMLS
- 2014-09-25 Listing Removed — GAMLS
- 2014-09-25 Listed $50,000 GAMLS
- 2014-09-24 Listed $50,000 GAMLS
- 2014-08-22 Sold (Public Records) $40,000 Public Records
- 2010-10-02 Price Changed $9,500 GAMLS
- 2010-09-01 Price Changed $11,300 GAMLS
- 2010-06-11 Price Changed $14,155 GAMLS
- 2010-05-25 Price Changed $14,900 GAMLS
- 2010-03-16 Price Changed $17,900 GAMLS
- 2005-12-13 Sold (Public Records) $65,400 Public Records
- 2005-09-27 Sold (Public Records) $44,500 Public Records
- 1998-01-12 Sold (Public Records) $47,500 Public Records
- 1980-04-30 Sold (Public Records) $35,400 Public Records
Property tax history
+3.4%/yrLatest (2025): $1,533 · +0.9% YoY. Source: county tax records.
Cash-flow waterfall
monthlySold comps — $/sqft
last 12 mo · ≤1 miLoading sold comps…