22301 Colorado River Dr S · Mono Vista, CA
Flood risk 1/10 · Minimal
- FEMA flood zone
- X (unshaded)
- Chance of flooding over 30 yrs
- 0.0%
- Est. flood insurance / yr
- $507 – $1,088
Fire risk 8/10 · Major
- Est. fire insurance / yr
- $659 – $1,223
Heat risk 4/10 · Minor
- Hot days now (above 93°F)
- 6 days/yr
- Hot days in 30 yrs
- 14 days/yr
Wind risk 1/10 · Minimal
- Chance of severe wind over 30 yrs
- —
Air-quality risk 10/10 · Severe
- Unhealthy air days now
- 29 days/yr
- Unhealthy air days in 30 yrs
- 33 days/yr
Risk factors via First Street. Map © Google.
Why this score? — see what drove the C grade
The composite is a weighted blend of 9 inputs, each scored 0–100. Each bar is that input's sub-score; the figure is the points it added to the 100-point composite (weight × sub-score).
- Cash flow +21.8/30.0
- ARV discount +15.0/15.0
- DSCR +7.0/10.0
- 1% rule +5.2/10.0
- Schools +3.1/10.0
- Livability +2.8/5.0
- Rent growth +2.5/5.0
- Condition / age +2.5/5.0
- Appreciation +0.0/10.0
$245,000
🖨 Deal sheet (PDF) 📄 Offer letter ✓ Due diligence
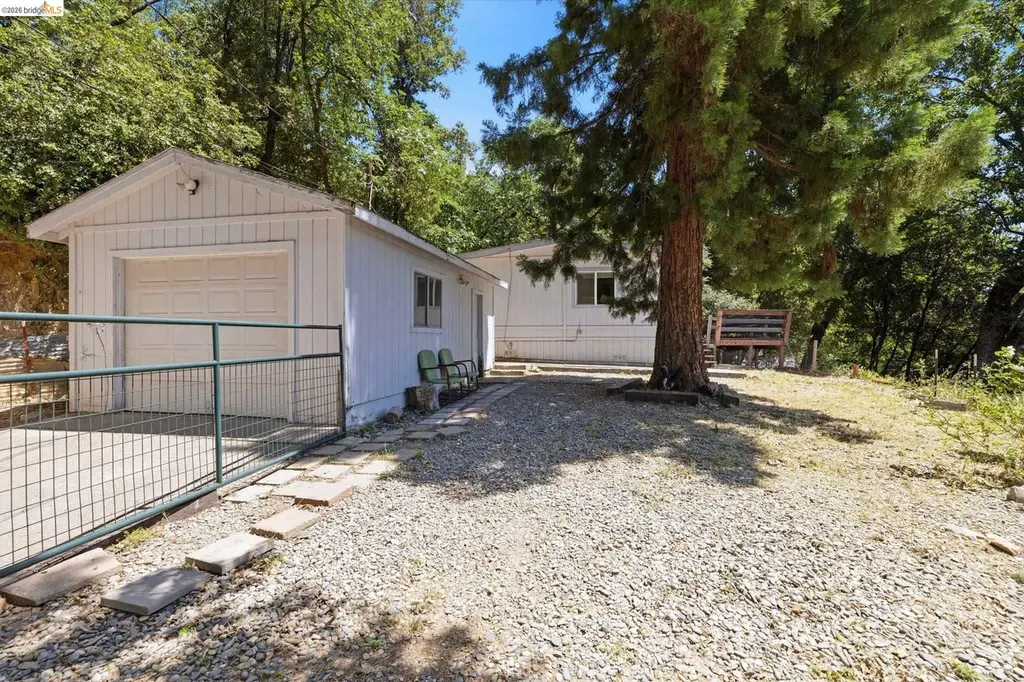
Listing remarks
Do you know what you get at the top of this driveway? VIEWS!!! There are not very many homes that you can get with this price tag, so bring your toolbelt and your imagination to bring it back to it's former glory! This home on ACREAGE is outside of any HOA. It offers privacy and space from neighbors, and is up and away from the street noise. Open floorplan with freestanding wood stove, central heat and evaporative cooler. Primary bedroom suite has bathroom with separate shower. Hall bathroom has a tub/shower near guest bedrooms on the opposite side of the primary suite. Owners had set up an outdoor seating area to enjoy the beauty of the outdoors, sunsets and the view that extends to the ci
Key facts
- Acreage
- Central heat
- Privacy
Tags
Property features AI
Exterior
- Parking: Detached covered garage (1 covered space, 1 garage space)
- Utilities: Public water
- Home design: Manufactured home (single-story); Built in 1982
- Construction: Wood construction
- Exterior features: Yard space; Sloped-up lot
Interior
- Kitchen: Gas range; Free-standing range/oven; Refrigerator; Solid surface countertops
- Flooring: Laminate flooring
- Bathrooms: 2 full bathrooms
- Heating & cooling: Central heating; Propane heating; Wood stove; Evaporative cooling
- Interior features: Solid surface counters; Wood-burning fireplace
- Laundry & utility: Laundry room with hookups
Neighborhood map
What this means for you Summary
Snapshot
- This is a 2-bed/2.0-bath single-family listed at $245k.
Deal economics
- At list price, monthly cash flow is $380 ($5k/yr) — positive.
- The deal already cash-flows at list — no discount required.
- Meets the 1% rule at list price ($3k rent vs $245k).
- Recommended offer: $238k (3.0% below list) — sets the bar for market timing.
- Cap rate 8.2% vs local median 5.0% in Mono Vista — top-decile yield for the area; either an underpriced asset or a hidden risk that comps aren't pricing in. Stress-test before assuming the spread holds.
Location & tenants
- Location reads 56/100 on livability (#793 in CA) — a working-class tenant base; expect higher turnover. Strengths: housing A+, crime B, employment B; Watch: schools D, amenities F, commute F.
- Soulsbyville Elementary (town): math 30% / reading 38% proficiency, ranked #272 of 517 in CA (top 53%) — families likely to look elsewhere, expect single-tenant / working-renter base with shorter leases.
- Market conditions: 299 active listings in the ZIP; 2 comparable units currently listed for rent nearby; 60 units permitted in Tuolumne County in 2024 (0 in 5+ unit buildings).
Forward outlook
- Local home prices are declining (-3.0%/yr); year-one equity from $2k of loan paydown is wiped out by about $7k of value loss. Plan a longer hold.
- Tuolumne County population projected at -15% by 2050 — secular population decline; favor cash flow + early exit over multi-decade hold.
Negotiation context
- It's been on market 31 days — a 3% lower offer ($238k) is reasonable based on typical stale-listing flexibility.
Risks & watch-outs
- Climate carrying-cost: severe wildfire risk — expect insurance premiums to compound above CPI over the hold.
Questions for the listing agent
- It's been on market 31 days. Have you received any prior offers? Is the seller open to a 3% concession, seller financing, or rate buy-down credit?
- Is there a deadline driving the sale (1031 exchange, divorce, estate, relocation)? That informs how much negotiation room exists.
- Schools are D-rated, which usually means shorter tenancies and higher turnover. Who's the typical renter profile here, and what's been the actual vacancy rate?
- What's the average days-on-market for RENTAL listings here right now (not sales)? A rising rental-DOM trend means longer vacancies and softer asking-rent achievability than the comps imply.
- What's the recent tenant-quality profile in this submarket — average credit score on applications, eviction rate, late-payment / NSF rate, and stable-employment percentage? A property-management company in the area should have these aggregated.
- How much new for-sale + rental construction is in the pipeline within 1–3 miles? Heavy new supply typically softens prices + rents 12–24 months out; constrained supply supports both.
Investment metrics
- 1% rule
- 1.02% ✓
- Cap rate
- 8.15%
- Cash-on-cash
- 6.64%
- DSCR
- 1.30
- GRM
- 8.1
CMA / ARV
- ARV (on-the-fly)
- $326,904
- Comps found
- 12
Show comp detail 12 sales within ~0.75 mi
| Address | Dist | Beds/Ba | Sqft | Sold | Price | $/sf | Match |
|---|---|---|---|---|---|---|---|
| 22407 Red River Dr | 0.35mi | 3/2.0 (+1) | 1,212 (-5%) | 0mo | $385,000 | $318 | 70 |
| 22376 Red River Dr | 0.34mi | 2/2.0 | 1,188 (-7%) | 12mo | $379,900 | $320 | 63 |
| 22192 Crystal Falls Dr | 0.26mi | 3/2.0 (+1) | 1,374 (+8%) | 11mo | $369,000 | $269 | 60 |
| 22484 Longeway Rd | 0.29mi | 2/2.0 | 1,092 (-14%) | 3mo | $305,000 | $279 | 60 |
| 22528 E Rhine River Dr | 0.47mi | 3/2.0 (+1) | 1,340 (+5%) | 7mo | $308,000 | $230 | 58 |
| 22447 Colorado River Dr | 0.23mi | 2/2.0 | 1,440 (+13%) | 14mo | $355,000 | $247 | 56 |
| 21786 Crystal Lake Dr | 0.68mi | 3/2.0 (+1) | 1,269 (-0%) | 10mo | $419,000 | $330 | 55 |
| 21931 Glenwood Rd | 0.59mi | 3/2.0 (+1) | 1,416 (+11%) | 1mo | $351,000 | $248 | 48 |
| 17272 Nile River Dr | 0.44mi | 3/2.0 (+1) | 1,422 (+12%) | 9mo | $297,000 | $209 | 48 |
| 22071 Fallview Ct | 0.56mi | 3/2.5 (+1) | 1,120 (-12%) | 2mo | $210,000 | $188 | 46 |
| 21881 Phoenix Lake Rd | 0.67mi | 3/2.0 (+1) | 1,400 (+10%) | 2mo | $360,000 | $257 | 45 |
| 16853 E Meadow Ln | 0.46mi | 3/2.0 (+1) | 1,440 (+13%) | 14mo | $336,500 | $234 | 40 |
Match score weights: distance 35% · size 25% · config 20% · recency 20%. Top-matched comps best support the ARV.
Projected returns pro-forma
-3.0% appreciation · 3.0% rent growth · sell at horizon
- IRR
- -6.1%
- Equity multiple
- 0.77×
- Total profit
- $-15,526
- Equity at exit
- $36,530
- IRR
- 3.5%
- Equity multiple
- 1.26×
- Total profit
- $17,562
- Equity at exit
- $21,183
Cash invested: $68,600 (down + closing). Projections, not guarantees.
Landlord ↔ Tenant lean methodology
- Overall (STATE)
- 18 Strongly Tenant-Friendly
- State California
- 18 Strongly Tenant-Friendly · D+13
- County
- — inherits STATE
- City
- — inherits STATE
ZIP-level market 95370
- Active inventory
- 299
- Price-to-rent
- 8.1×
Monthly cashflow live
- Estimated rent
- $2,511 medium interval (Pro) →
- Mortgage (P&I)
- −$1,285
- Tax from tax record
- −$217 /mo · $2,599/yr
- Insurance
- −$102
- HOA
- −$0
- Vacancy / Maint / Mgmt
- −$527
- Net cashflow
- $380
Break-even live
Sensitivity live
| Price | -10% $519 | -5% $449 | +0% $380 | +5% $310 | +10% $241 |
|---|---|---|---|---|---|
| Rent | -10% $182 | -5% $281 | +0% $380 | +5% $479 | +10% $578 |
| Rate | -1.0pp $503 | -0.5pp $442 | base $380 | +0.5pp $316 | +1.0pp $252 |
UW: 25.0% down · 7.5% · 30yr · 1.5% tax · 5.0% vac · 8.0% maint · 8.0% mgmt
Financing live
Cash to close
- Down payment
- $61,250
- Closing costs
- $7,350
- Reserves months
- —
- Total cash needed
- —
Loan-product check · same deal, 3 products live
Conventional
25% down · 7.5% · 30yr
- Down + closing
- —
- Monthly P&I
- —
- Monthly cashflow
- —
- DSCR
- —
- Eligible?
- —
Personal DTI + credit; lowest rate.
DSCR
20% down · 8.5% · 30yr
- Down + closing
- —
- Monthly P&I
- —
- Monthly cashflow
- —
- DSCR
- —
- Eligible?
- —
No personal income docs; deal must DSCR.
Hard money
10% down · 12.0% · 12mo
- Down + closing
- —
- Monthly P&I
- —
- Monthly cashflow
- —
- DSCR
- —
- Eligible?
- —
Short-term bridge; refi at stabilization.
Rent comps 2 comps
| Address | Beds | Baths | Sqft | Rent | $/sqft | DOM | Units | Dist |
|---|---|---|---|---|---|---|---|---|
| 19011 Middle Camp Rd Twain Harte, CA | 3.0 | 2.0 | 1586 | $2,295 | $1.45 | 14d | 1 | 0.36mi |
| 21593 Crystal Falls Dr Sonora, CA | 3.0 | 2.0 | 1250 | $2,950 | $2.36 | 24d | 1 | 0.90mi |
Listing history 19 events
-
2026-06-19days on market $245,000 Active 31 DOM
-
2026-06-18days on market $245,000 Active 30 DOM
-
2026-06-17days on market $245,000 Active 29 DOM
-
2026-06-16days on market $245,000 Active 28 DOM
-
2026-06-15days on market $245,000 Active 27 DOM
-
2026-06-14days on market $245,000 Active 25 DOM
-
2026-06-12days on market $245,000 Active 24 DOM
-
2026-06-10days on market $245,000 Active 22 DOM
-
2026-06-09days on market $245,000 Active 21 DOM
-
2026-06-08days on market $245,000 Active 20 DOM
-
2026-06-07days on market $245,000 Active 19 DOM
-
2026-06-05days on market $245,000 Active 17 DOM
-
2026-06-05days on market $245,000 Active 16 DOM
-
2026-06-03days on market $245,000 Active 15 DOM
-
2026-06-02days on market $245,000 Active 14 DOM
-
2026-06-01days on market $245,000 Active 13 DOM
-
2026-05-31days on market $245,000 Active 12 DOM
-
2026-05-30days on market $245,000 Active 11 DOM
-
2026-05-19$245,000 Active
ⓘ Source: listings_history table (triggers on properties + properties_extension) + one-shot
backfill from property_details.listing_events for pre-trigger history.
Tax reassessment forecast CA · Resets to sale price
- Current annual tax
- $2,599 · $217/mo
- Projected year-2 tax
- $2,599 · $217/mo
- Expected delta
- $0/yr ($0/mo · 0.0%)
ⓘ Screening estimate from a state-policy table — verify with the county assessor before closing.
Climate risk First Street
- Flood 1/10 Low FEMA zone X (unshaded) · 0% chance over 30 yrs
- Wildfire 8/10 Severe
- Heat 4/10 Moderate 6 d/yr ≥93°F today · 14 d/yr by 30 yrs out
- Wind 1/10 Low
- Air quality 10/10 Extreme 29 unhealthy d/yr today · 33 by 30 yrs out
Nearby sold comps map
Loading sold comps map…
Walkable amenities ~0.75 mi
Loading nearby amenities…
Taxation est. · year 1
- Rental income
- $30,126
- − Mortgage interest
- −$13,724
- − Property taxes
- −$2,599
- − Insurance
- −$1,225
- − Repairs & maintenance
- −$2,410
- − Management
- −$2,410
- − Depreciation
- −$7,127
- Taxable income
- $631
- Est. tax owed @ 24.0%
- −$151
- After-tax cash flow
- $4,407/yr
For passive investors: Depreciation is non-cash, so a rental often shows a tax loss while cash-flowing — sheltering income. Rental losses are passive: they offset passive income freely, and up to $25,000/yr can offset ordinary (W-2) income if you actively participate and your MAGI is under $100k (phasing out to $0 by $150k); unused losses carry forward. On sale, claimed depreciation is recaptured at up to 25%, and gains may owe capital-gains tax (a 1031 exchange can defer both). Figures are a year-1 estimate at your 24.0% rate — not tax advice; consult a CPA.
Schools (NCES district)
- District
- Soulsbyville Elementary
- NCES district ID
- 0637320
- Math proficiency
- 30% ▼ -4.00%
- Reading proficiency
- 38% ▼ -10.00%
- Median HH income
- $60,518
- Composite
- 30.5/100
- National rank
- #6217
- State rank
- #272 of 517 in CA
Livability — Mono Vista
- Score
- 56/100
- State rank
- #793
- US rank
- #22675
Category grades
Schools grade is shown separately in the Schools card above.
Census & demographics
- Census place
- Mono Vista, CA
- Population (ZIP)
- 28,373
Population outlook (Tuolumne County) Hauer SSP2
- Today (2025)
- 50,349 people
- By 2030
- 48,708 · -3.3%
- By 2040
- 45,284 · -10.1%
- By 2050
- 42,575 · -15.4%
- By 2075
- 36,827 · -26.9%
- By 2100
- 30,369 · -39.7%
Race, ethnicity, and origin ACS 2023
- Neighborhood character
- Predominantly White (82%)
- Race & ethnicity
- White 82% Hispanic / Latino 11% Two or more races 9% Asian 1% Native American 1%
- Hispanic origin (detail)
- Mexican 7% Puerto Rican 1%
- Common ancestry
- Italian 5% Russian 4% Slovak 3%
- Foreign-born
- 5% · Canada
- Languages at home
- 95% English-only · Spanish 3%
Political lean MEDSL · Tuolumne
- 2024 margin
- Strong R (+21.9) · D 37.9% · R 59.7% · Other 2.4%
- 2008→2024 swing
- -9.2pp toward R · 2008: -12.7pp · 2024: -21.9pp
- All cycles
- 2024: R+21.9 2020: R+18.8 2016: R+20.9 2012: R+15.9 2008: R+12.7
Not yet ingested
- Civics
- —
Market trends
- HPI YoY
- ▼ -322.67%
- Current HPI
- 130.9637
- Rent YoY
- —
- Metro
- —
- State GDP YoY
- ▲ 3.21%
- F500 in state
- 116
Industry mix (Fortune 500 HQ in CA)
| Industry | F500 HQs | Revenue |
|---|---|---|
| Technology | 27 | $1,492B |
|
||
| Financial Services | 3 | $174B |
|
||
| Retail | 3 | $44B |
|
||
| Insurance | 3 | $26B |
|
||
| Media / Entertainment | 2 | $115B |
|
||
| Pharmaceuticals / Biotech | 2 | $62B |
|
||
Price history
1 event — show timeline
- 2026-05-19 Listed $245,000 bridgeMLS, Bay East AOR, or Contra Costa AOR
Property tax history
+7.2%/yrLatest (2025): $2,599 · +1.7% YoY. Source: county tax records.
Cash-flow waterfall
monthlySold comps — $/sqft
last 12 mo · ≤1 miLoading sold comps…