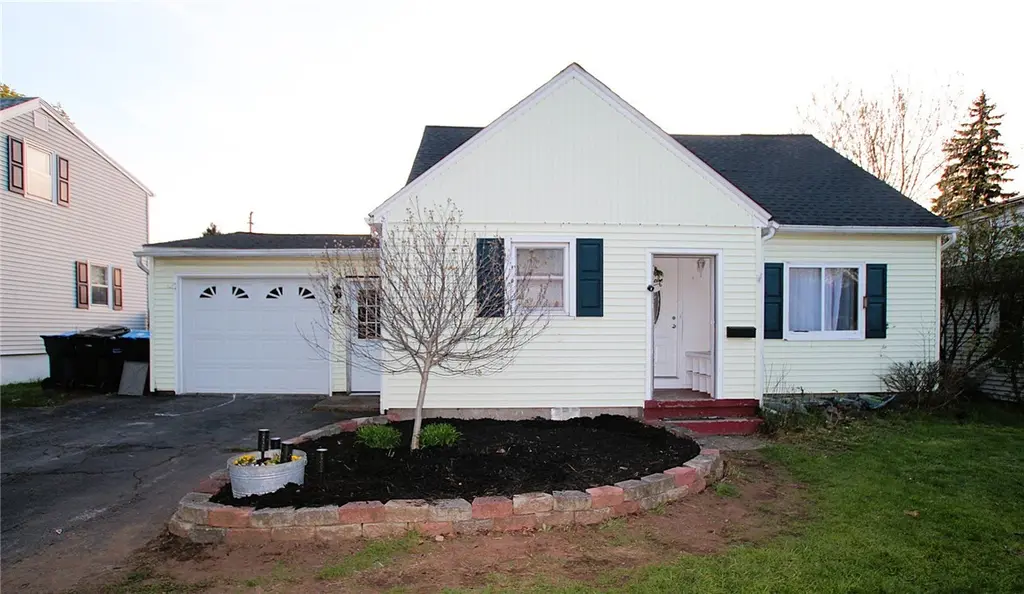
71 Standish Rd · Greece, NY
Flood risk 1/10 · Minimal
- FEMA flood zone
- X (unshaded)
- Chance of flooding over 30 yrs
- 0.0%
- Est. flood insurance / yr
- $507 – $1,088
Fire risk 1/10 · Minimal
- Est. fire insurance / yr
- $691 – $1,283
Heat risk 3/10 · Minor
- Hot days now (above 95°F)
- 7 days/yr
- Hot days in 30 yrs
- 15 days/yr
Wind risk 1/10 · Minimal
- Chance of severe wind over 30 yrs
- —
Air-quality risk 2/10 · Minimal
- Unhealthy air days now
- 1 days/yr
- Unhealthy air days in 30 yrs
- 2 days/yr
Risk factors via First Street. Map © Google.
Why this score? — see what drove the C grade
The composite is a weighted blend of 9 inputs, each scored 0–100. Each bar is that input's sub-score; the figure is the points it added to the 100-point composite (weight × sub-score).
- Cash flow +17.8/30.0
- ARV discount +15.0/15.0
- 1% rule +7.2/10.0
- DSCR +5.6/10.0
- Livability +4.0/5.0
- Schools +3.2/10.0
- Rent growth +3.1/5.0
- Condition / age +2.5/5.0
- Appreciation +0.0/10.0
$149,900
🖨 Deal sheet (PDF) 📄 Offer letter ✓ Due diligence
Listing remarks
This lovely cape features 3 bedrooms and 2 full baths, first floor living space has 1-bedroom, full bath, great room, kitchen and laundry. Upstairs boast 2 bedrooms, one with a walk-in closet. Newly remodeled full bath with jacuzzi tub. Have some piece of mind with newer roof (2020), furnace (2020), a/c (2020) on demand hot water. Close to shopping, expressways and dining. All in Greece Central School District. A MUST SEE! Delayed negotiations 5/4/2026 at 12pm.
Key facts
- Walk-in closet
- Newer roof
- Great room
Tags
Property features AI
Exterior
- Parking: Attached garage; 1 garage space
- Utilities: Public water connection; Sewer connected; Circuit breaker electric; Cable available; High-speed internet available
- Home design: Single-story residence; Resale property
- Construction: Vinyl siding; Copper plumbing; Architectural shingle roof; Block foundation; Existing (built previously)
- Exterior features: Blacktop driveway; Fully fenced yard; Full fencing; City street frontage; Rectangular residential lot (approx. 0.194 acres, 65 x 130)
Interior
- Kitchen: Electric oven; Electric range; Microwave; Dishwasher; Refrigerator
- Bedrooms: 1 main-level bedroom
- Flooring: Hardwood; Vinyl; Varied flooring
- Bathrooms: 2 full bathrooms; 1 main-level bathroom
- Heating & cooling: Gas forced-air heating; Central air conditioning
- Interior features: Eat-in kitchen; Bedroom on main level; Crawl space basement
- Laundry & utility: Main-level laundry; Dryer; Tankless water heater
Neighborhood map
What this means for you Summary
Snapshot
- This is a 3-bed/1.0-bath single-family listed at $150k.
Deal economics
- At list price, monthly cash flow is $124 ($1k/yr) — positive.
- The deal already cash-flows at list — no discount required.
- Meets the 1% rule at list price ($2k rent vs $150k).
- Cap rate 7.3% vs local median 3.7% in Greece — top-decile yield for the area; either an underpriced asset or a hidden risk that comps aren't pricing in. Stress-test before assuming the spread holds.
Location & tenants
- Location reads 79/100 on livability (#145 in NY, #2,223 nationally) — a middle-class / working-renter tenant base. Strengths: commute A+, housing A+, health & safety A+; Watch: schools D-, crime D-.
- Greece Central School District (suburban): math 35% / reading 39% proficiency, ranked #544 of 590 in NY (top 92%) — families likely to look elsewhere, expect single-tenant / working-renter base with shorter leases.
- Market conditions: Rents rising (+2.5%/yr); 126 active listings in the ZIP; 1 comparable units currently listed for rent nearby; solid renter incomes; 1,169 units permitted in Monroe County in 2024 (591 in 5+ unit buildings).
Forward outlook
- Local home prices are declining (-3.0%/yr); year-one equity from $1k of loan paydown is wiped out by about $4k of value loss. Plan a longer hold.
- Monroe County population projected to shrink 6% by 2050 — rents likely to lag national; underwrite the cash flow, not the appreciation.
Negotiation context
- Only 7 days on market — expect competitive offers; lowballing is unlikely to land.
- Current owner paid $71k; list at $150k implies a 111% gain — meaningful room to come down on a strong offer.
Risks & watch-outs
- Watch-outs: property tax is 3.8% of price; built in 1949 — expect roof / HVAC / electrical / plumbing capex.
Questions for the listing agent
- Built in 1949 — when were the roof, HVAC, electrical panel, plumbing, and water heater last replaced?
- Property tax is high relative to price — has the assessment been appealed recently, and will the sale trigger a re-assessment?
- Is there a deadline driving the sale (1031 exchange, divorce, estate, relocation)? That informs how much negotiation room exists.
- Schools are D-rated, which usually means shorter tenancies and higher turnover. Who's the typical renter profile here, and what's been the actual vacancy rate?
- Crime grade is D in this area — have there been break-ins, vandalism, or insurance claims at this property in the last 3 years? What carrier currently insures it and at what premium?
- What's the average days-on-market for RENTAL listings here right now (not sales)? A rising rental-DOM trend means longer vacancies and softer asking-rent achievability than the comps imply.
- What's the recent tenant-quality profile in this submarket — average credit score on applications, eviction rate, late-payment / NSF rate, and stable-employment percentage? A property-management company in the area should have these aggregated.
- How much new for-sale + rental construction is in the pipeline within 1–3 miles? Heavy new supply typically softens prices + rents 12–24 months out; constrained supply supports both.
Investment metrics
- 1% rule
- 1.22% ✓
- Cap rate
- 7.29%
- Cash-on-cash
- 3.56%
- DSCR
- 1.16
- GRM
- 6.8
CMA / ARV
- ARV (median comp)
- $202,921
- List price
- $149,900
- Delta
- -26.13%
- Verdict
- UNDERPRICED
- Comps
- 20 within 1.0 mi
Show comp detail 12 sales within ~0.75 mi
| Address | Dist | Beds/Ba | Sqft | Sold | Price | $/sf | Match |
|---|---|---|---|---|---|---|---|
| 21 Alden Rd | 0.18mi | 3/1.0 | 1,320 (+5%) | 4mo | $115,000 | $87 | 79 |
| 274 Newton Rd | 0.35mi | 3/1.0 | 1,243 (-1%) | 4mo | $162,000 | $130 | 79 |
| 13 Alden Rd | 0.18mi | 3/1.0 | 1,152 (-8%) | 1mo | $195,500 | $170 | 77 |
| 128 Ridgecrest Rd | 0.11mi | 4/1.0 (+1) | 1,152 (-8%) | 4mo | $176,000 | $153 | 72 |
| 73 Alcott Rd | 0.06mi | 3/1.5 | 1,404 (+12%) | 4mo | $115,000 | $82 | 72 |
| 211 Cabot Rd | 0.24mi | 2/1.0 (-1) | 1,341 (+7%) | 1mo | $237,800 | $177 | 72 |
| 232 Fielding Rd | 0.42mi | 4/1.0 (+1) | 1,224 (-2%) | 1mo | $227,007 | $185 | 71 |
| 460 Alfonso Dr | 0.47mi | 3/1.5 | 1,264 (+1%) | 5mo | $220,000 | $174 | 70 |
| 89 Haddon Rd | 0.42mi | 3/1.0 | 1,147 (-8%) | 0mo | $240,000 | $209 | 66 |
| 99 Chesterton Rd | 0.37mi | 3/1.0 | 1,105 (-12%) | 4mo | $222,000 | $201 | 60 |
| 142 Frandee Ln | 0.56mi | 3/2.0 | 1,180 (-6%) | 3mo | $260,000 | $220 | 58 |
| 347 Fetzner Rd | 0.49mi | 3/1.5 | 1,429 (+14%) | 2mo | $205,000 | $143 | 50 |
Match score weights: distance 35% · size 25% · config 20% · recency 20%. Top-matched comps best support the ARV.
Projected returns pro-forma
-3.0% appreciation · 2.5% rent growth · sell at horizon
- IRR
- -11.3%
- Equity multiple
- 0.59×
- Total profit
- $-17,082
- Equity at exit
- $22,351
- IRR
- -2.7%
- Equity multiple
- 0.82×
- Total profit
- $-7,571
- Equity at exit
- $12,961
Cash invested: $41,972 (down + closing). Projections, not guarantees.
Landlord ↔ Tenant lean methodology
- Overall (STATE)
- 15 Strongly Tenant-Friendly
- State New York
- 15 Strongly Tenant-Friendly · D+10
- County
- — inherits STATE
- City
- — inherits STATE
ZIP-level market 14626
- Home prices YoY
- -31.4%
- Rents YoY
- 2.5%
- Active inventory
- 126
- Price-to-rent
- 6.8×
Monthly cashflow live
- Estimated rent
- $1,834 medium interval (Pro) →
- Mortgage (P&I)
- −$786
- Tax from tax record
- −$476 /mo · $5,712/yr
- Insurance
- −$62
- HOA
- −$0
- Vacancy / Maint / Mgmt
- −$385
- Net cashflow
- $124
Break-even live
Sensitivity live
| Price | -10% $209 | -5% $167 | +0% $124 | +5% $82 | +10% $40 |
|---|---|---|---|---|---|
| Rent | -10% $-21 | -5% $52 | +0% $124 | +5% $197 | +10% $269 |
| Rate | -1.0pp $200 | -0.5pp $163 | base $124 | +0.5pp $86 | +1.0pp $46 |
UW: 25.0% down · 7.5% · 30yr · 1.5% tax · 5.0% vac · 8.0% maint · 8.0% mgmt
Financing live
Cash to close
- Down payment
- $37,475
- Closing costs
- $4,497
- Reserves months
- —
- Total cash needed
- —
Loan-product check · same deal, 3 products live
Conventional
25% down · 7.5% · 30yr
- Down + closing
- —
- Monthly P&I
- —
- Monthly cashflow
- —
- DSCR
- —
- Eligible?
- —
Personal DTI + credit; lowest rate.
DSCR
20% down · 8.5% · 30yr
- Down + closing
- —
- Monthly P&I
- —
- Monthly cashflow
- —
- DSCR
- —
- Eligible?
- —
No personal income docs; deal must DSCR.
Hard money
10% down · 12.0% · 12mo
- Down + closing
- —
- Monthly P&I
- —
- Monthly cashflow
- —
- DSCR
- —
- Eligible?
- —
Short-term bridge; refi at stabilization.
Rent comps 1 comps
| Address | Beds | Baths | Sqft | Rent | $/sqft | DOM | Units | Dist |
|---|---|---|---|---|---|---|---|---|
| 176 Kingsberry Dr Greece, NY | 1.0–2.0 | 1.0–1.5 | 757 | $1,535 | $2.03 | 3d | 7 | 0.48mi |
Listing history 4 events
-
2026-05-05status Pending 466-char remark
-
2026-04-28$149,900 Active 466-char remark
-
2015-10-22soldstatus $71,000
-
1998-12-15soldstatus $57,900
ⓘ Source: listings_history table (triggers on properties + properties_extension) + one-shot
backfill from property_details.listing_events for pre-trigger history.
Tax reassessment forecast NY · Partial reset (capped growth)
- Current annual tax
- $5,712 · $476/mo
- Projected year-2 tax
- $5,712 · $476/mo
- Expected delta
- $0/yr ($0/mo · 0.0%)
ⓘ Screening estimate from a state-policy table — verify with the county assessor before closing.
Climate risk First Street
- Flood 1/10 Low FEMA zone X (unshaded) · 0% chance over 30 yrs
- Wildfire 1/10 Low
- Heat 3/10 Moderate 7 d/yr ≥95°F today · 15 d/yr by 30 yrs out
- Wind 1/10 Low
- Air quality 2/10 Low 1 unhealthy d/yr today · 2 by 30 yrs out
Nearby sold comps map
Loading sold comps map…
Walkable amenities ~0.75 mi
Loading nearby amenities…
Taxation est. · year 1
- Rental income
- $22,008
- − Mortgage interest
- −$8,397
- − Property taxes
- −$5,712
- − Insurance
- −$750
- − Repairs & maintenance
- −$1,761
- − Management
- −$1,761
- − Depreciation
- −$4,361
- Taxable loss
- −$731
- Est. tax savings @ 24.0%
- +$176
- After-tax cash flow
- $1,668/yr
For passive investors: Depreciation is non-cash, so a rental often shows a tax loss while cash-flowing — sheltering income. Rental losses are passive: they offset passive income freely, and up to $25,000/yr can offset ordinary (W-2) income if you actively participate and your MAGI is under $100k (phasing out to $0 by $150k); unused losses carry forward. On sale, claimed depreciation is recaptured at up to 25%, and gains may owe capital-gains tax (a 1031 exchange can defer both). Figures are a year-1 estimate at your 24.0% rate — not tax advice; consult a CPA.
Schools (NCES district)
- District
- Greece Central School District
- NCES district ID
- 3612630
- Math proficiency
- 35% ▼ -14.00%
- Reading proficiency
- 39% ▼ -3.00%
- Median HH income
- $52,718
- Composite
- 32.26/100
- National rank
- #5761
- State rank
- #544 of 590 in NY
Livability — Greece
- Score
- 79/100
- State rank
- #145
- US rank
- #2223
Category grades
Schools grade is shown separately in the Schools card above.
Census & demographics
- Census place
- Greece, NY
- County
- Monroe County · 674,131 people
- City population
- 29,210
- Metro
- Rochester, NY
- Population (ZIP)
- 29,273
- Household income
- $78,204
- Rent vs Own
- Severe rent burden
- 810.0
Population outlook (Monroe County) Hauer SSP2
- Today (2025)
- 759,460 people
- By 2030
- 757,154 · -0.3%
- By 2040
- 740,644 · -2.5%
- By 2050
- 714,443 · -5.9%
- By 2075
- 645,883 · -15.0%
- By 2100
- 547,084 · -28.0%
Race, ethnicity, and origin ACS 2023
- Neighborhood character
- Predominantly White (77%)
- Race & ethnicity
- White 77% Black 9% Hispanic / Latino 8% Two or more races 6% Asian 3%
- Hispanic origin (detail)
- Mexican 1% Puerto Rican 5%
- Common ancestry
- Romanian 5% Lithuanian 2% Subsaharan African 2%
- Foreign-born
- 9% · Canada, Vietnam, South Korea
- Languages at home
- 89% English-only · Other Indo-European 3% Spanish 3% Russian/Polish/Slavic 1%
Political lean MEDSL · Monroe
- 2024 margin
- D (+19.1) · D 59.5% · R 40.5%
- 2008→2024 swing
- +1.4pp toward D · 2008: 17.7pp · 2024: 19.1pp
- All cycles
- 2024: D+19.1 2020: D+21.0 2016: D+14.1 2012: D+17.4 2008: D+17.7
Not yet ingested
- Civics
- —
Market trends
- HPI YoY
- ▼ -113.91%
- Current HPI
- 248.9836
- Rent YoY
- ▲ 2.50%
- Metro
- Rochester, NY
- State GDP YoY
- ▲ 2.60%
- F500 in state
- 92
Industry mix (Fortune 500 HQ in NY)
| Industry | F500 HQs | Revenue |
|---|---|---|
| Financial Services | 10 | $950B |
|
||
| Consumer Goods | 9 | $162B |
|
||
| Insurance | 4 | $225B |
|
||
| Telecommunications | 2 | $144B |
|
||
| Pharmaceuticals | 2 | $112B |
|
||
| Media / Entertainment | 2 | $69B |
|
||
Price history
+158.9% since first listed4 events — show timeline
- 2026-05-05 Pending — UNYREIS
- 2026-04-28 Listed $149,900 UNYREIS
- 2015-10-22 Sold (Public Records) $71,000 Public Records
- 1998-12-15 Sold (Public Records) $57,900 Public Records
Property tax history
+8.4%/yrLatest (2025): $5,712 · +3.3% YoY. Source: county tax records.
Cash-flow waterfall
monthlySold comps — $/sqft
last 12 mo · ≤1 miLoading sold comps…