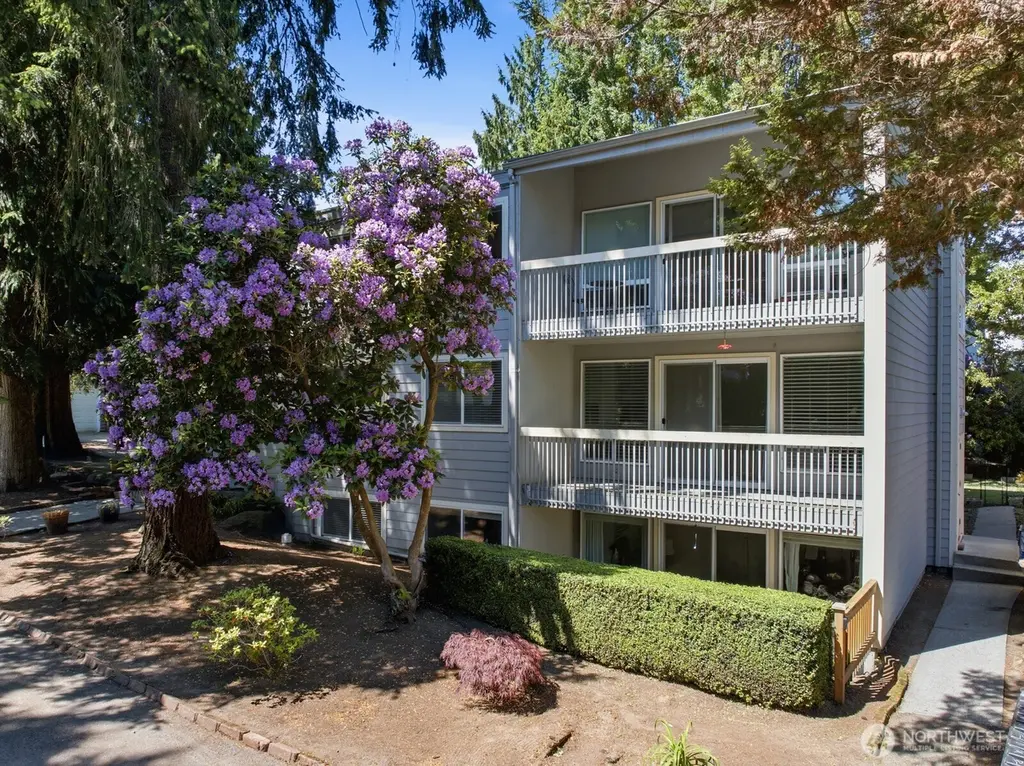
 8-Plex
3510 W Elmore St · Seattle, WA
Flood risk 1/10 · Minimal
- FEMA flood zone
- X (unshaded)
- Chance of flooding over 30 yrs
- 0.0%
- Est. flood insurance / yr
- $507 – $1,088
Fire risk 1/10 · Minimal
- Est. fire insurance / yr
- $604 – $1,122
Heat risk 3/10 · Minor
- Hot days now (above 86°F)
- 7 days/yr
- Hot days in 30 yrs
- 15 days/yr
Wind risk 1/10 · Minimal
- Chance of severe wind over 30 yrs
- —
Air-quality risk 7/10 · Major
- Unhealthy air days now
- 10 days/yr
- Unhealthy air days in 30 yrs
- 11 days/yr
Risk factors via First Street. Map © Google.
Why this score? — see what drove the C+ grade
The composite is a weighted blend of 9 inputs, each scored 0–100. Each bar is that input's sub-score; the figure is the points it added to the 100-point composite (weight × sub-score).
- Cash flow +25.9/30.0
- DSCR +8.7/10.0
- ARV discount +7.5/15.0
- 1% rule +6.2/10.0
- Schools +6.1/10.0
- Livability +3.8/5.0
- Rent growth +3.6/5.0
- Condition / age +2.5/5.0
- Appreciation +0.0/10.0
$2,400,000
🖨 Deal sheet 📄 Offer letter ✓ Due diligence
Multi-family units
County records classify this as Multi-Family (5+ Unit). Listing-text estimate: 8 units. confirmed
5+ unit building — per-unit beds/baths from public records are typically unavailable; the breakdown below (if shown) is an estimate from the listing text.
Listing remarks
We are pleased to present Twin Cedars Apartments, an 8-unit apartment built in 1968 in Seattle’s coveted Magnolia neighborhood, within steps of Discovery Park. The building offers 31BD averaging 732SF and 5 2BD averaging 967SF, with efficient floor plans. With 2BD units comprising 63% of the building, the unit mix is squarely aligned with the unit type that drives the strongest tenant demand and longest retention across Seattle’s rental market. _of the 8 units have been updated with stone countertops and LVP flooring, delivering a modernized interior foundation. Roof replaced and cedar siding resided in 2020 keep the exterior in sound condition, and a newly improved bike storage
Key facts
- Cedar siding resided
- Parking income
- Lvp flooring
Tags
Property features AI
Finance
- Financial info: Total units: 8; Vacancy rate reported at 5%; Gross scheduled income: $184,489; Gross adjusted income: $175,265; Total monthly income: $15,760; Net operating income: $126,733; Total expenses: $62,385; Insurance expense: $7,142; Other expense: $21,055; Gross rent multiplier: 13; Listing terms: Cash or Conventional
- HOA & community: Storage available
Exterior
- Parking: 8 uncovered parking spaces
- Utilities: Electric service; Public water; Sewer connected
- Home design: Residential income property (multi-family); 5–9 unit style code; Two stories; Property in very good condition; Has a view
- Construction: Wood construction; Composition, flat and torch-down roofing; Poured concrete foundation; Effective year built 1992
- Exterior features: Wood exterior; Deck; Alley access; Dead-end street location; Paved lot
Interior
- Kitchen: Range/oven in all units; Refrigerator in all units; Dishwasher in all units
- Bedrooms: Mix of 1- and 2-bedroom units
- Flooring: Vinyl plank
- Bathrooms: Each unit has one bathroom
- Heating & cooling: Baseboard heating; No central cooling
- Interior features: Vinyl plank flooring
- Laundry & utility: Washer and dryer in all units
Neighborhood map
What this means for you Summary
Snapshot
- This is a 8 × 13-bed/8.0-bath units multifamily listed at $2.40M.
Deal economics
- At list price, monthly cash flow is $6k ($71k/yr) — positive. Per door: $739/mo.
- The deal already cash-flows at list — no discount required.
- Meets the 1% rule at list price ($27k rent vs $2.40M).
- Cap rate 9.2% vs local median 1.6% in Seattle — top-decile yield for the area; either an underpriced asset or a hidden risk that comps aren't pricing in. Stress-test before assuming the spread holds.
Location & tenants
- Location reads 75/100 on livability (#166 in WA, #4,033 nationally) — a middle-class / working-renter tenant base. Strengths: amenities A+, commute A+, employment A+; Watch: crime F, cost of living F.
- Seattle Public Schools (urban): math 64% / reading 72% proficiency, ranked #19 of 291 in WA (top 6%) — acceptable for families but not a draw, mixed tenant base, ~2y average lease.
- Market conditions: Rents rising fast (+4.3%/yr); 145 active listings in the ZIP; high-income renter base; 10,555 units permitted in King County in 2024 (7,119 in 5+ unit buildings).
- At $26,787/mo this rent would consume 178% of the median local household income ($181k/yr) (locally 432% of renters already pay >50% of income on rent) — very limited rent-growth headroom before tenants either downsize or default.
Forward outlook
- Local home prices are declining (-3.0%/yr); year-one equity from $17k of loan paydown is wiped out by about $72k of value loss. Plan a longer hold.
- King County population projected at +44% by 2050 — long-run rental-demand tailwind backs the buy-and-hold thesis.
- At projected returns (-3.0% appreciation + 4.3% rent growth), your $672k cash investment doubles in ~10 years — after that, you're playing with house money.
Negotiation context
- Only 10 days on market — expect competitive offers; lowballing is unlikely to land.
- 2 sale attempts since 2y ago with the ask held roughly flat each time — persistent listings suggest the price (not the market) is what's stuck; bring a comps-based counter.
- Current owner paid $1.02M; list at $2.40M implies a 134% gain — meaningful room to come down on a strong offer.
Questions for the listing agent
- Can we see the unit-by-unit rent roll, current vacancy, and any below-market leases? What's the average tenancy length?
- What capital expenditures (roof, boiler, parking lot, exteriors) have been made in the last 5 years, and what's planned in the next 2?
- Built in 1968 — when were the roof, HVAC, electrical panel, plumbing, and water heater last replaced?
- Is there a deadline driving the sale (1031 exchange, divorce, estate, relocation)? That informs how much negotiation room exists.
- Schools are A-rated — typically a magnet for longer-tenancy family renters. What's the average tenant stay here, and is there a school-zone premium baked into asking?
- Crime grade is F in this area — have there been break-ins, vandalism, or insurance claims at this property in the last 3 years? What carrier currently insures it and at what premium?
- What's the average days-on-market for RENTAL listings here right now (not sales)? A rising rental-DOM trend means longer vacancies and softer asking-rent achievability than the comps imply.
- What's the recent tenant-quality profile in this submarket — average credit score on applications, eviction rate, late-payment / NSF rate, and stable-employment percentage? A property-management company in the area should have these aggregated.
- How much new apartment / multifamily construction is in the pipeline within 1–3 miles? Heavy new supply (>2% of stock underway) typically softens rents 12–24 months out; light construction supports rent growth.
Investment metrics
- 1% rule
- 1.12% ✓
- Cap rate
- 9.25%
- Cash-on-cash
- 10.56%
- DSCR
- 1.47
- GRM
- 7.5
CMA / ARV
No comps found within radius.
Projected returns pro-forma
-3.0% appreciation · 4.28% rent growth · sell at horizon
- IRR
- 0.8%
- Equity multiple
- 1.03×
- Total profit
- $22,082
- Equity at exit
- $357,848
- IRR
- 11.7%
- Equity multiple
- 1.97×
- Total profit
- $649,451
- Equity at exit
- $207,508
Cash invested: $672,000 (down + closing). Projections, not guarantees.
Landlord ↔ Tenant lean methodology
- Overall (CITY)
- 0 Strongly Tenant-Friendly
- State Washington
- 28 Tenant-Leaning · D+8
- County
- — inherits STATE
- City Seattle
- 0 Strongly Tenant-Friendly · D+52
ZIP-level market 98199
- Rents YoY
- 4.3%
- Active inventory
- 145
- Price-to-rent
- 59.7×
Monthly cashflow live
- Estimated rent
- $26,787 medium interval (Pro) →
- Mortgage (P&I)
- −$12,586
- Tax from tax record
- −$1,665 /mo · $19,980/yr
- Insurance
- −$1,000
- HOA
- −$0
- Vacancy / Maint / Mgmt
- −$5,625
- Net cashflow
- $5,911
Break-even live
8-unit breakdown (identical units grouped — click to expand)
| Units | Beds | Baths | Est. rent |
|---|---|---|---|
| 8× units | 13 | 8 | $26,784 |
| #1 | 13 | 8 | $3,348 |
| #2 | 13 | 8 | $3,348 |
| #3 | 13 | 8 | $3,348 |
| #4 | 13 | 8 | $3,348 |
| #5 | 13 | 8 | $3,348 |
| #6 | 13 | 8 | $3,348 |
| #7 | 13 | 8 | $3,348 |
| #8 | 13 | 8 | $3,348 |
| Total (8 units) | $26,787 | ||
UW: 25.0% down · 7.5% · 30yr · 1.5% tax · 5.0% vac · 8.0% maint · 8.0% mgmt
Financing live
Cash to close
- Down payment
- $600,000
- Closing costs
- $72,000
- Reserves months
- —
- Total cash needed
- —
Loan-product check · same deal, 3 products live
Conventional
25% down · 7.5% · 30yr
- Down + closing
- —
- Monthly P&I
- —
- Monthly cashflow
- —
- DSCR
- —
- Eligible?
- —
Personal DTI + credit; lowest rate.
DSCR
20% down · 8.5% · 30yr
- Down + closing
- —
- Monthly P&I
- —
- Monthly cashflow
- —
- DSCR
- —
- Eligible?
- —
No personal income docs; deal must DSCR.
Hard money
10% down · 12.0% · 12mo
- Down + closing
- —
- Monthly P&I
- —
- Monthly cashflow
- —
- DSCR
- —
- Eligible?
- —
Short-term bridge; refi at stabilization.
Listing history 10 events
-
2026-06-19days on market $2,400,000 Active 10 DOM
-
2026-06-18days on market $2,400,000 Active 9 DOM
-
2026-06-17days on market $2,400,000 Active 8 DOM
-
2026-06-16days on market $2,400,000 Active 7 DOM
-
2026-06-15days on market $2,400,000 Active 6 DOM
-
2026-06-15days on market $2,400,000 Active 5 DOM
-
2026-06-13days on market $2,400,000 Active 4 DOM
-
2026-06-12days on market $2,400,000 Active 3 DOM
-
2026-06-09remarks 687-char remark
-
2026-06-09$2,400,000 Active 1 DOM
ⓘ Source: listings_history table (triggers on properties + properties_extension) + one-shot
backfill from property_details.listing_events for pre-trigger history.
Tax reassessment forecast WA · Resets to sale price
- Current annual tax
- $19,980 · $1,665/mo
- Projected year-2 tax
- $23,520 · $1,960/mo
- Expected delta
- +$3,540/yr (+$295/mo · 17.7%)
ⓘ Screening estimate from a state-policy table — verify with the county assessor before closing.
Climate risk First Street
- Flood 1/10 Low FEMA zone X (unshaded) · 0% chance over 30 yrs
- Wildfire 1/10 Low
- Heat 3/10 Moderate 7 d/yr ≥86°F today · 15 d/yr by 30 yrs out
- Wind 1/10 Low
- Air quality 7/10 Severe 10 unhealthy d/yr today · 11 by 30 yrs out
Nearby sold comps map
Loading sold comps map…
Walkable amenities ~0.75 mi
Loading nearby amenities…
Taxation est. · year 1
- Rental income
- $321,444
- − Mortgage interest
- −$134,437
- − Property taxes
- −$19,980
- − Insurance
- −$12,000
- − Repairs & maintenance
- −$25,716
- − Management
- −$25,716
- − Depreciation
- −$69,818
- Taxable income
- $33,777
- Est. tax owed @ 24.0%
- −$8,107
- After-tax cash flow
- $62,824/yr
For passive investors: Depreciation is non-cash, so a rental often shows a tax loss while cash-flowing — sheltering income. Rental losses are passive: they offset passive income freely, and up to $25,000/yr can offset ordinary (W-2) income if you actively participate and your MAGI is under $100k (phasing out to $0 by $150k); unused losses carry forward. On sale, claimed depreciation is recaptured at up to 25%, and gains may owe capital-gains tax (a 1031 exchange can defer both). Figures are a year-1 estimate at your 24.0% rate — not tax advice; consult a CPA.
Schools (NCES district)
- District
- Seattle Public Schools
- NCES district ID
- 5307710
- Math proficiency
- 64% ▼ -1.00%
- Reading proficiency
- 72% ▬ 0.00%
- Median HH income
- $68,695
- Composite
- 60.76/100
- National rank
- #1649
- State rank
- #19 of 291 in WA
Livability — Seattle
- Score
- 75/100
- State rank
- #166
- US rank
- #4033
Category grades
Schools grade is shown separately in the Schools card above.
Census & demographics
- Census place
- Seattle, WA
- County
- King County · 2,251,916 people
- City population
- 706,262
- Metro
- Seattle-Tacoma-Bellevue, WA
- Population (ZIP)
- 22,468
- Household income
- $180,789
- Rent vs Own
- Severe rent burden
- 432.0
Population outlook (King County) Hauer SSP2
- Today (2025)
- 2,576,485 people
- By 2030
- 2,803,316 · +8.8%
- By 2040
- 3,255,921 · +26.4%
- By 2050
- 3,706,444 · +43.9%
- By 2075
- 4,746,063 · +84.2%
- By 2100
- 5,407,730 · +109.9%
Race, ethnicity, and origin ACS 2023
- Neighborhood character
- Predominantly White (73%)
- Race & ethnicity
- White 73% Asian 12% Two or more races 8% Hispanic / Latino 6% Black 2%
- Hispanic origin (detail)
- Mexican 4%
- Common ancestry
- Italian 4% Portuguese 4% Lithuanian 4%
- Foreign-born
- 14% · China, Canada, Vietnam
- Languages at home
- 84% English-only · Other Indo-European 5% Chinese 3% Spanish 3%
Political lean MEDSL · King
- 2024 margin
- Solid D (+51.7) · D 74.2% · R 22.5% · Other 3.4%
- 2008→2024 swing
- +9.6pp toward D · 2008: 42.1pp · 2024: 51.7pp
- All cycles
- 2024: D+51.7 2020: D+52.7 2016: D+50.4 2012: D+39.9 2008: D+42.1
Not yet ingested
- Civics
- —
Market trends
- HPI YoY
- ▼ -1534.61%
- Current HPI
- 306.6426
- Rent YoY
- ▲ 4.28%
- Metro
- Seattle-Tacoma-Bellevue, WA
- State GDP YoY
- ▲ 4.65%
- F500 in state
- 22
Industry mix (Fortune 500 HQ in WA)
| Industry | F500 HQs | Revenue |
|---|---|---|
| Retail | 2 | $269B |
|
||
| Technology / Retail | 1 | $638B |
|
||
| Technology | 1 | $245B |
|
||
| Telecommunications | 1 | $38B |
|
||
| Food / Beverage | 1 | $36B |
|
||
| Automotive / Trucks | 1 | $34B |
|
||
Price history
+686.9% since first listed6 events — show timeline
- 2026-06-09 Listed $2,400,000 NWMLS as Distributed by MLS Grid
- 2024-04-10 Rental Removed $2,100 APPFOLIO
- 2024-01-30 Listed for Rent $2,100 APPFOLIO
- 2011-08-31 Sold (Public Records) $1,023,750 Public Records
- 1996-12-31 Sold (Public Records) $573,800 Public Records
- 1985-07-01 Sold (Public Records) $305,000 Public Records
Property tax history
+5.8%/yrLatest (2025): $19,980 · -6.5% YoY. Source: county tax records.
Cash-flow waterfall
monthlySold comps — $/sqft
last 12 mo · ≤1 miLoading sold comps…