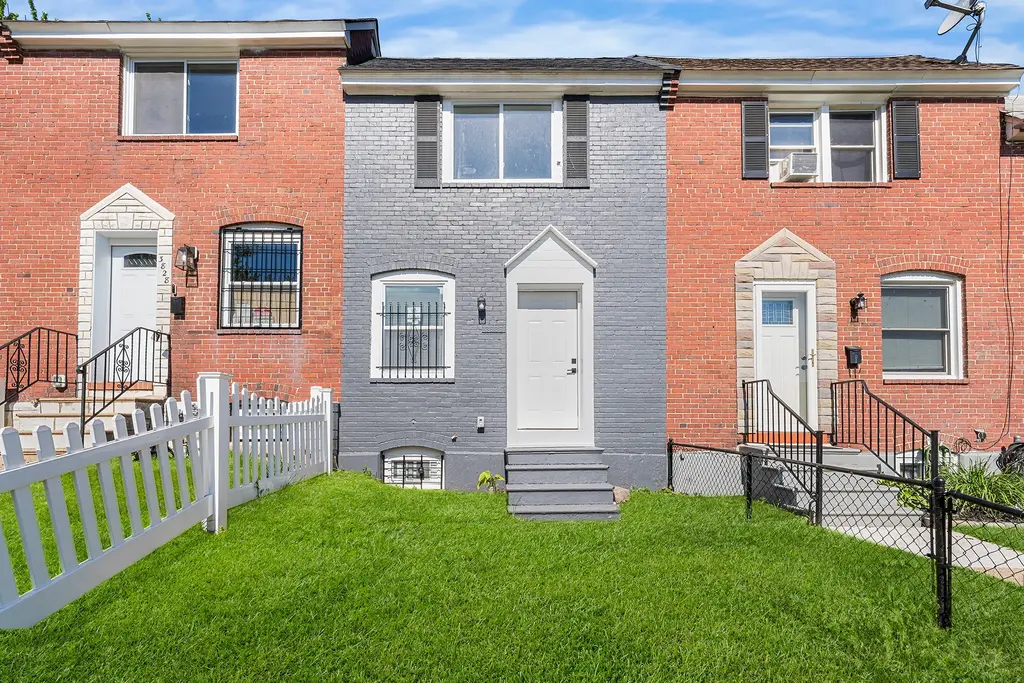
3826 10th St · Baltimore, MD
Flood risk 1/10 · Minimal
- FEMA flood zone
- X (unshaded)
- Chance of flooding over 30 yrs
- 0.0%
- Est. flood insurance / yr
- $473 – $860
Fire risk 1/10 · Minimal
- Est. fire insurance / yr
- $755 – $1,403
Heat risk 8/10 · Major
- Hot days now (above 103°F)
- 7 days/yr
- Hot days in 30 yrs
- 15 days/yr
Wind risk 6/10 · Moderate
- Chance of severe wind over 30 yrs
- 27.0%
Air-quality risk 4/10 · Minor
- Unhealthy air days now
- 5 days/yr
- Unhealthy air days in 30 yrs
- 7 days/yr
Risk factors via First Street. Map © Google.
Why this score? — see what drove the C grade
The composite is a weighted blend of 9 inputs, each scored 0–100. Each bar is that input's sub-score; the figure is the points it added to the 100-point composite (weight × sub-score).
- Cash flow +28.2/30.0
- DSCR +10.0/10.0
- 1% rule +6.4/10.0
- Livability +3.8/5.0
- Rent growth +3.5/5.0
- Condition / age +2.5/5.0
- Schools +1.0/10.0
- ARV discount +0.0/15.0
- Appreciation +0.0/10.0
$180,000
🖨 Deal sheet (PDF) 📄 Offer letter ✓ Due diligence
Listing remarks
Fully renovated and move in ready! This beautifully updated home offers the perfect opportunity to stop renting and start building equity. Enjoy modern finishes, updated living spaces, and the peace of mind that comes with a recently renovated home. Conveniently located near shopping, dining, schools, public transportation, and major commuter routes. Homeownership may be more affordable than you think. Qualified buyers may be eligible for down payment and closing cost assistance programs, and the seller is offering up to 3% closing cost assistance to help reduce out of pocket expenses. Whether you are a first time homebuyer or looking for your next home, this property delivers exceptional v
Key facts
- Built 1943
- Listed 4 days
Property features AI
Finance
- Other: Total below-grade area of 405 (finished and unfinished combined); Above-grade finished area recorded as 810; Below-grade finished area recorded as 300 and unfinished area recorded as 105
- HOA & community: Ground rent paid annually
Exterior
- Parking: On-street parking
- Utilities: Public water; Public sewer
- Home design: Interior townhouse/rowhouse; Fee simple ownership; Located within city limits
- Construction: Brick construction; Other foundation details; Assessor-recorded year built
- Exterior features: Above grade and below grade structures
Interior
- Bedrooms: Three bedrooms on the first upper level; One bedroom on the first lower level
- Bathrooms: Two full bathrooms (one on upper level, one on lower level)
- Heating & cooling: Heat pump heating; Central air conditioning; Electric heating and cooling; Electric hot water
- Interior features: Improved basement; Other interior features
Neighborhood map
What this means for you Summary
Snapshot
- This is a 4-bed/1.0-bath townhouse listed at $180k.
Deal economics
- At list price, monthly cash flow is $569 ($7k/yr) — positive.
- The deal already cash-flows at list — no discount required.
- Meets the 1% rule at list price ($2k rent vs $180k).
- Cap rate 10.1% vs local median 6.0% in Baltimore — top-decile yield for the area; either an underpriced asset or a hidden risk that comps aren't pricing in. Stress-test before assuming the spread holds.
Location & tenants
- Location reads 76/100 on livability (#90 in MD, #3,396 nationally) — a middle-class / working-renter tenant base. Strengths: amenities A+, commute A+, housing A+; Watch: crime F.
- Baltimore City Public Schools (urban): math 7% / reading 16% proficiency, ranked #24 of 24 in MD (top 100%) — low school quality limits family demand, transient renter base, plan for 1-2y turnover; 79% free/reduced lunch — lower-income household profile, screen leases tightly.
- Zoned schools: Elmer A. Henderson: A Johns Hopkins Partnership (math 2% / reading 16%, grade F, #650 of 860 statewide, top 77%, 642 students, 80% FRL); Baltimore Polytechnic Institute (math 71% / reading 84%, grade A-, #22 of 222 statewide, top 10%, 1,555 students, 43% FRL) — zoned schools average 62% FRL vs 79% district-wide (17 pts lower); this property's tenant base skews higher-income than the district average.
- Zoned-school proficiency averages 43% at this address vs 12% district-wide (+32 pts) — the actual schools serving this property are materially stronger than the Baltimore City Public Schools average implies; a family-tenant draw the district grade alone would hide.
- Market conditions: Rents rising fast (+4.1%/yr); 165 active listings in the ZIP; 12 comparable units currently listed for rent nearby; rentals at typical pace (median 25d on market — plan ~3-4 weeks tenant-placement turnaround); 1,273 units permitted in Baltimore city in 2024 (1,104 in 5+ unit buildings).
Forward outlook
- Local home prices are declining (-3.0%/yr); year-one equity from $1k of loan paydown is wiped out by about $5k of value loss. Plan a longer hold.
- Baltimore County population projected to shrink 4% by 2050 — rents likely to lag national; underwrite the cash flow, not the appreciation.
- At projected returns (-3.0% appreciation + 4.1% rent growth), your $50k cash investment doubles in ~8 years — after that, you're playing with house money.
Negotiation context
- Only 4 days on market — expect competitive offers; lowballing is unlikely to land.
- 10 sale attempts since 31y ago with the ask held roughly flat each time — persistent listings suggest the price (not the market) is what's stuck; bring a comps-based counter.
- Current owner paid $68k; list at $180k implies a 165% gain — meaningful room to come down on a strong offer.
Risks & watch-outs
- Watch-outs: built in 1943 — expect roof / HVAC / electrical / plumbing capex.
- Climate carrying-cost: major wind risk, 27% chance of damaging wind over 30y; extreme-heat days projected 7→15/yr by 2055 (HVAC capex compounding) — expect insurance premiums to compound above CPI over the hold.
Questions for the listing agent
- Built in 1943 — when were the roof, HVAC, electrical panel, plumbing, and water heater last replaced?
- Is there a deadline driving the sale (1031 exchange, divorce, estate, relocation)? That informs how much negotiation room exists.
- Schools are D-rated, which usually means shorter tenancies and higher turnover. Who's the typical renter profile here, and what's been the actual vacancy rate?
- Crime grade is F in this area — have there been break-ins, vandalism, or insurance claims at this property in the last 3 years? What carrier currently insures it and at what premium?
- What's the average days-on-market for RENTAL listings here right now (not sales)? A rising rental-DOM trend means longer vacancies and softer asking-rent achievability than the comps imply.
- What's the recent tenant-quality profile in this submarket — average credit score on applications, eviction rate, late-payment / NSF rate, and stable-employment percentage? A property-management company in the area should have these aggregated.
- How much new for-sale + rental construction is in the pipeline within 1–3 miles? Heavy new supply typically softens prices + rents 12–24 months out; constrained supply supports both.
Investment metrics
- 1% rule
- 1.14% ✓
- Cap rate
- 10.08%
- Cash-on-cash
- 13.54%
- DSCR
- 1.60
- GRM
- 7.3
CMA / ARV
- ARV (median comp)
- $147,091
- List price
- $180,000
- Delta
- 32.57%
- Verdict
- OVERPRICED
- Comps
- 20 within 1.0 mi
Show comp detail 9 sales within ~0.75 mi
| Address | Dist | Beds/Ba | Sqft | Sold | Price | $/sf | Match |
|---|---|---|---|---|---|---|---|
| 3825 10th St | 0.03mi | 3/1.0 (-1) | 810 (0%) | 10mo | $110,000 | $136 | 85 |
| 3743 Saint Victor St | 0.06mi | 3/1.0 (-1) | 810 (0%) | 20mo | $155,000 | $191 | 76 |
| 3608 Saint Victor St | 0.16mi | 3/2.0 (-1) | 864 (+7%) | 11mo | $150,000 | $174 | 63 |
| 5333 Wasena Ave | 0.69mi | 3/1.5 (-1) | 856 (+6%) | 1mo | $215,000 | $251 | 51 |
| 4116 Curtis Ave | 0.60mi | 3/1.0 (-1) | 832 (+3%) | 15mo | $40,000 | $48 | 50 |
| 4113 Townsend Ave | 0.37mi | 3/1.0 (-1) | 928 (+15%) | 8mo | $185,000 | $199 | 46 |
| 5208 Wasena | 0.62mi | 3/2.0 (-1) | 920 (+14%) | 5mo | $207,000 | $225 | 35 |
| 5242 4th | 0.69mi | 3/1.0 (-1) | 736 (-9%) | 22mo | $75,000 | $102 | 29 |
| 3541 Horton Ave | 0.64mi | 3/1.0 (-1) | 921 (+14%) | 23mo | $150,000 | $163 | 23 |
Match score weights: distance 35% · size 25% · config 20% · recency 20%. Top-matched comps best support the ARV.
Projected returns pro-forma
-3.0% appreciation · 4.08% rent growth · sell at horizon
- IRR
- 4.7%
- Equity multiple
- 1.18×
- Total profit
- $9,202
- Equity at exit
- $26,839
- IRR
- 15.0%
- Equity multiple
- 2.26×
- Total profit
- $63,715
- Equity at exit
- $15,563
Cash invested: $50,400 (down + closing). Projections, not guarantees.
Landlord ↔ Tenant lean methodology
- Overall (CITY)
- 12 Strongly Tenant-Friendly
- State Maryland
- 27 Tenant-Leaning · D+14
- County
- — inherits STATE
- City Baltimore
- 12 Strongly Tenant-Friendly · D+58
ZIP-level market 21225
- Home prices YoY
- -31.9%
- Rents YoY
- 4.1%
- Active inventory
- 165
- Price-to-rent
- 7.3×
Monthly cashflow live
- Estimated rent
- $2,048 high interval (Pro) →
- Mortgage (P&I)
- −$944
- Tax from tax record
- −$31 /mo · $369/yr
- Insurance
- −$75
- HOA
- −$0
- Vacancy / Maint / Mgmt
- −$430
- Net cashflow
- $569
Break-even live
Sensitivity live
| Price | -10% $670 | -5% $619 | +0% $569 | +5% $312 | +10% $250 |
|---|---|---|---|---|---|
| Rent | -10% $407 | -5% $488 | +0% $569 | +5% $649 | +10% $730 |
| Rate | -1.0pp $659 | -0.5pp $614 | base $569 | +0.5pp $522 | +1.0pp $474 |
UW: 25.0% down · 7.5% · 30yr · 1.5% tax · 5.0% vac · 8.0% maint · 8.0% mgmt
Financing live
Cash to close
- Down payment
- $45,000
- Closing costs
- $5,400
- Reserves months
- —
- Total cash needed
- —
Loan-product check · same deal, 3 products live
Conventional
25% down · 7.5% · 30yr
- Down + closing
- —
- Monthly P&I
- —
- Monthly cashflow
- —
- DSCR
- —
- Eligible?
- —
Personal DTI + credit; lowest rate.
DSCR
20% down · 8.5% · 30yr
- Down + closing
- —
- Monthly P&I
- —
- Monthly cashflow
- —
- DSCR
- —
- Eligible?
- —
No personal income docs; deal must DSCR.
Hard money
10% down · 12.0% · 12mo
- Down + closing
- —
- Monthly P&I
- —
- Monthly cashflow
- —
- DSCR
- —
- Eligible?
- —
Short-term bridge; refi at stabilization.
Rent comps 12 comps
| Address | Beds | Baths | Sqft | Rent | $/sqft | DOM | Units | Dist |
|---|---|---|---|---|---|---|---|---|
| 3826 10th St Unit Entire House Baltimore, MD | 3.0 | 2.0 | 1110 | $2,400 | $2.16 | 25d | 1 | 0.03mi |
| 3840 8th St Brooklyn, MD | 3.0 | 1.5 | 1088 | $1,606 | $1.48 | 6d | 1 | 0.24mi |
| 1305 E Patapsco Ave Brooklyn, MD | 3.0 | 1.5 | 930 | $1,650 | $1.77 | 6d | 1 | 0.27mi |
| 1353 Cambria St Brooklyn, MD | 3.0 | 2.0 | 986 | $1,600 | $1.62 | 19d | 1 | 0.31mi |
| 507 Washburn Ave Brooklyn, MD | 3.0 | 1.5 | 1024 | $2,500 | $2.44 | 25d | 1 | 0.41mi |
| 507 Washburn Ave Brooklyn, MD | 3.0 | 1.5 | 1024 | $2,500 | $2.44 | 21d | 1 | 0.41mi |
| 507 Washburn Ave Brooklyn, MD | 3.0 | 1.5 | 1024 | $2,500 | $2.44 | 6d | 1 | 0.41mi |
| 4216 Prudence St Curtis Bay, MD | 4.0 | 3.0 | 1116 | $2,100 | $1.88 | 45d | 1 | 0.45mi |
| 4206 Audrey Ave Brooklyn, MD | 3.0 | 3.0 | 1104 | $1,950 | $1.77 | 25d | 1 | 0.48mi |
| 5215 Wasena Ave Brooklyn, MD | 3.0 | 1.0 | 1030 | $1,650 | $1.60 | 45d | 1 | 0.63mi |
| 3513 Horton Ave Brooklyn, MD | 3.0 | 1.0 | 1020 | $1,600 | $1.57 | 19d | 1 | 0.66mi |
| 217 W Edgevale Rd Brooklyn, MD | 3.0 | 1.5 | 992 | $1,800 | $1.81 | 25d | 1 | 1.09mi |
Listing history 38 events
-
2026-06-21days on market $180,000 Active 4 DOM
-
2026-06-17remarks 699-char remark
-
2026-06-17pricedays on market $180,000 Active 1 DOM
-
2026-06-09days on market $195,000 Active 48 DOM
-
2026-06-08days on market $195,000 Active 47 DOM
-
2026-06-07days on market $195,000 Active 46 DOM
-
2026-06-04days on market $195,000 Active 43 DOM
-
2026-06-03days on market $195,000 Active 42 DOM
-
2026-06-02days on market $195,000 Active 41 DOM
-
2026-06-01days on market $195,000 Active 40 DOM
-
2026-05-31days on market $195,000 Active 39 DOM
-
2026-05-11price $195,000 1079-char remark
-
2026-04-23$200,000 Active 1079-char remark
-
2026-03-24historical $200,000 1079-char remark
-
2015-04-01historical
-
2015-04-01historical Expired
-
2014-10-07price
-
2014-06-02price
-
2014-04-25Active
-
2014-04-25$20,000
-
2010-07-13historical Withdrawn
-
2010-06-30historical
-
2010-01-19status Contract
-
2009-11-11Active
-
2009-11-11$30,000
-
2007-01-09soldstatus $68,000
-
2007-01-09soldstatus $68,000
-
2006-12-20soldstatus $68,000
-
2006-11-08historical
-
2006-09-26$75,500
-
2003-06-17historical
-
2002-11-07
-
1999-08-04historical
-
1999-06-03
-
1996-06-19historical
-
1995-11-20
-
1992-12-11soldstatus $62,500
-
1988-06-10soldstatus $45,500
ⓘ Source: listings_history table (triggers on properties + properties_extension) + one-shot
backfill from property_details.listing_events for pre-trigger history.
Tax reassessment forecast MD · Partial reset (capped growth)
- Current annual tax
- $369 · $31/mo
- Projected year-2 tax
- $1,165 · $97/mo
- Expected delta
- +$797/yr (+$66/mo · 216.0%)
ⓘ Screening estimate from a state-policy table — verify with the county assessor before closing.
Climate risk First Street
- Flood 1/10 Low FEMA zone X (unshaded) · 0% chance over 30 yrs
- Wildfire 1/10 Low
- Heat 8/10 Severe 7 d/yr ≥103°F today · 15 d/yr by 30 yrs out
- Wind 6/10 Major 27% chance of damaging wind over 30 yrs
- Air quality 4/10 Moderate 5 unhealthy d/yr today · 7 by 30 yrs out
Nearby sold comps map
Loading sold comps map…
Walkable amenities ~0.75 mi
Loading nearby amenities…
Taxation est. · year 1
- Rental income
- $24,580
- − Mortgage interest
- −$10,083
- − Property taxes
- −$369
- − Insurance
- −$900
- − Repairs & maintenance
- −$1,966
- − Management
- −$1,966
- − Depreciation
- −$5,236
- Taxable income
- $4,059
- Est. tax owed @ 24.0%
- −$974
- After-tax cash flow
- $5,848/yr
For passive investors: Depreciation is non-cash, so a rental often shows a tax loss while cash-flowing — sheltering income. Rental losses are passive: they offset passive income freely, and up to $25,000/yr can offset ordinary (W-2) income if you actively participate and your MAGI is under $100k (phasing out to $0 by $150k); unused losses carry forward. On sale, claimed depreciation is recaptured at up to 25%, and gains may owe capital-gains tax (a 1031 exchange can defer both). Figures are a year-1 estimate at your 24.0% rate — not tax advice; consult a CPA.
Schools (NCES district)
- District
- Baltimore City Public Schools
- NCES district ID
- 2400090
- Math proficiency
- 7% ▼ -9.00%
- Reading proficiency
- 16% ▼ -5.00%
- Median HH income
- $42,108
- Composite
- 10.08/100
- National rank
- #9805
- State rank
- #24 of 24 in MD
Livability — Baltimore
- Score
- 76/100
- State rank
- #90
- US rank
- #3396
Category grades
Schools grade is shown separately in the Schools card above.
Census & demographics
- Census place
- Baltimore, MD
- County
- Anne Arundel County · 535,653 people
- City population
- 588,727
- Metro
- Baltimore-Columbia-Towson, MD
- Population (ZIP)
- 34,062
- Household income
- $54,020
- Rent vs Own
- Severe rent burden
- 1440.0
Population outlook (Baltimore County) Hauer SSP2
- Today (2025)
- 624,249 people
- By 2030
- 621,541 · -0.4%
- By 2040
- 609,756 · -2.3%
- By 2050
- 597,249 · -4.3%
- By 2075
- 552,236 · -11.5%
- By 2100
- 513,934 · -17.7%
Race, ethnicity, and origin ACS 2023
- Neighborhood character
- Diverse neighborhood (Simpson 0.68)
- Race & ethnicity
- Black 42% White 32% Hispanic / Latino 20% Two or more races 8% Native American 3% Asian 2%
- Hispanic origin (detail)
- Mexican 5% Puerto Rican 1%
- Common ancestry
- Romanian 2% Lithuanian 1% Iranian 1%
- Foreign-born
- 12% · Canada, China
- Languages at home
- 81% English-only · Spanish 16% Other Indo-European 1% French/Haitian/Cajun 1%
Political lean MEDSL · Baltimore
- 2024 margin
- Solid D (+73.0) · D 85.2% · R 12.2% · Other 2.6%
- 2008→2024 swing
- -2.5pp toward R · 2008: 75.5pp · 2024: 73.0pp
- All cycles
- 2024: D+73.0 2020: D+76.6 2016: D+74.6 2012: D+76.4 2008: D+75.5
Not yet ingested
- Civics
- —
Market trends
- HPI YoY
- ▼ -119.44%
- Current HPI
- 254.5089
- Rent YoY
- ▲ 4.08%
- Metro
- Baltimore-Columbia-Towson, MD
- State GDP YoY
- ▲ 2.97%
- F500 in state
- 12
Industry mix (Fortune 500 HQ in MD)
| Industry | F500 HQs | Revenue |
|---|---|---|
| Aerospace / Defense | 1 | $71B |
|
||
| Utilities | 1 | $25B |
|
||
| Hotels | 1 | $24B |
|
||
| Consumer Goods | 1 | $7B |
|
||
| Real Estate | 1 | $6B |
|
||
| Chemicals | 1 | $2B |
|
||
Price history
+295.6% since first listed29 events — show timeline
- 2026-06-17 Listed $180,000 BRIGHT MLS
- 2026-06-11 Listing Removed — BRIGHT MLS
- 2026-05-11 Price Changed $195,000 BRIGHT MLS
- 2026-04-23 Listed $200,000 BRIGHT MLS
- 2026-03-24 Coming Soon — BRIGHT MLS
- 2015-04-01 Delisted — MRIS
- 2015-04-01 Listing Removed — BRIGHT MLS
- 2014-10-07 Price Changed — MRIS
- 2014-06-02 Price Changed — MRIS
- 2014-04-25 Listed — MRIS
- 2014-04-25 Listed $20,000 BRIGHT MLS
- 2010-07-13 Delisted — MRIS
- 2010-06-30 Listing Removed — BRIGHT MLS
- 2010-01-19 Pending — MRIS
- 2009-11-11 Listed — MRIS
- 2009-11-11 Listed $30,000 BRIGHT MLS
- 2007-01-09 Sold (Public Records) $68,000 Public Records
- 2007-01-09 Sold (Public Records) $68,000 Public Records
- 2006-12-20 Sold (MLS) $68,000 MRIS
- 2006-11-08 Delisted — MRIS
- 2006-09-26 Listed $75,500 MRIS
- 2003-06-17 Delisted — MRIS
- 2002-11-07 Listed — MRIS
- 1999-08-04 Delisted — MRIS
- 1999-06-03 Listed — MRIS
- 1996-06-19 Delisted — MRIS
- 1995-11-20 Listed — MRIS
- 1992-12-11 Sold (Public Records) $62,500 Public Records
- 1988-06-10 Sold (Public Records) $45,500 Public Records
Property tax history
-8.9%/yrLatest (2025): $369 · +0.0% YoY. Source: county tax records.
Cash-flow waterfall
monthlySold comps — $/sqft
last 12 mo · ≤1 miLoading sold comps…