 🔨 Auction
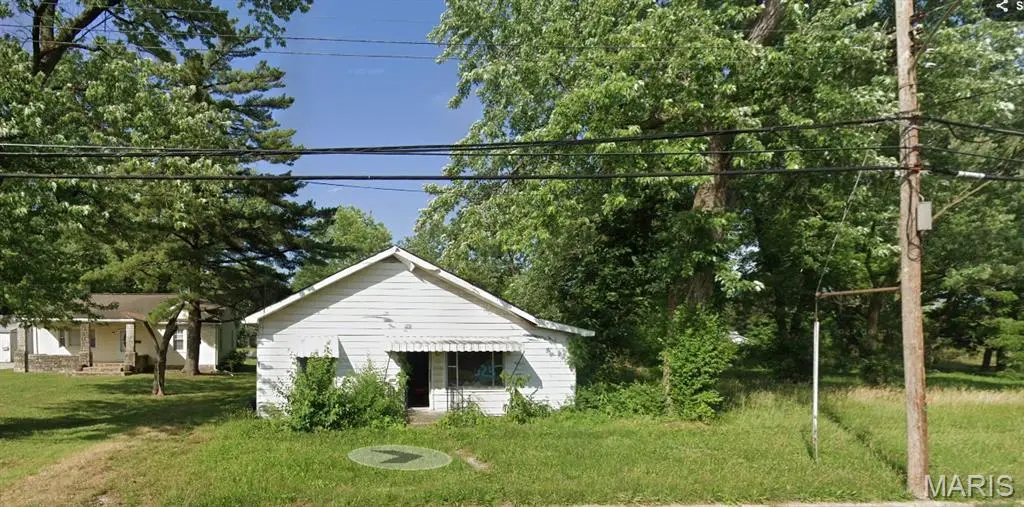
825 Mildred Ave · Cahokia Heights, IL
Flood risk 1/10 · Minimal
- FEMA flood zone
- —
- Chance of flooding over 30 yrs
- 0.0%
- Est. flood insurance / yr
- —
Fire risk 1/10 · Minimal
- Est. fire insurance / yr
- $804 – $1,492
Heat risk 5/10 · Moderate
- Hot days now (above 108°F)
- 7 days/yr
- Hot days in 30 yrs
- 21 days/yr
Wind risk 2/10 · Minimal
- Chance of severe wind over 30 yrs
- 1.0%
Air-quality risk 3/10 · Minor
- Unhealthy air days now
- 3 days/yr
- Unhealthy air days in 30 yrs
- 4 days/yr
Risk factors via First Street. Map © Google.
Why this score? — see what drove the B- grade
The composite is a weighted blend of 9 inputs, each scored 0–100. Each bar is that input's sub-score; the figure is the points it added to the 100-point composite (weight × sub-score).
- Cash flow +30.0/30.0
- 1% rule +10.0/10.0
- DSCR +10.0/10.0
- ARV discount +7.5/15.0
- Rent growth +2.5/5.0
- Livability +2.5/5.0
- Condition / age +2.5/5.0
- Schools +0.6/10.0
- Appreciation +0.0/10.0
$12,000
🖨 Deal sheet (PDF) 📄 Offer letter ✓ Due diligence
Listing remarks MLS
This Property will be auctioned on Auction.com - please go to the website, register an account and submit your offer(s). Listed as "825 Mildred Ave Sauget, IL 62206" on Auction.com Estimated as 3BR/1BA ranch with 1341 sq ft and crawl space on HUGE 1.19 acres lot! Built in 1923. SAME STREET as 731 Mildred (also in portfolio) - buying both creates huge advantages! Paired benefits: 10-15% bulk labor discount ($5K savings), 8% bulk materials savings ($3K), synchronized timeline, shared permitting ($500), single marketing campaign. Real savings: $8,500 if both purchased. Cahokia Heights/Sauget area shows stable values. Perfect for portfolio investors, systematic flippers with capacity for multiple projects, contractors leveraging economies of scale, BRRRR investors building rental portfolios. Exterior showing (curb viewing) only. NO inside showings available, no more inside pictures available. No contingencies will be accepted. Cash sale only. Sold "where is and as is" No Survey or Keys Provided. Interior Access for Home Inspections Will Not Be Granted. Listing Information May Not Be Accurate. Buyers Must Do Their Own Due Diligence to Verify Number of Beds, Baths, Square Footage, Room Sizes, Lot Size & Any Other Property Details. Photos, Marketing Comments, and Due Diligence Items are Provided for Guidance Purposes Only. By Making an Offer on This Property, the Buyer Represents They Have Independently Verified All Information and Have Made the Decision to Make an Offer Based Upon Their Own Investigation.
Key facts
- 1.19 acre lot
- Built 1923
- Listed 150 days
Neighborhood map
What this means for you Summary
Snapshot
- This is a 3-bed/2.0-bath single-family listed at $12k.
Deal economics
- At list price, monthly cash flow is $522 ($6k/yr) — positive.
- The deal already cash-flows at list — no discount required.
- Meets the 1% rule at list price ($1k rent vs $12k).
- Recommended offer: $11k (12.0% below list) — sets the bar for market timing.
Location & tenants
- Location reads: area grade B — affects rentability + tenant quality, not the cash-flow math above.
- Cahokia CUSD 187 (suburban): math 3% / reading 5% proficiency, ranked #864 of 919 in IL (top 94%) — low school quality limits family demand, transient renter base, plan for 1-2y turnover; 85% free/reduced lunch — lower-income household profile, screen leases tightly.
- Zoned schools: Wirth/Parks Middle School (617 students, 0% FRL) — zoned schools average 0% FRL vs 85% district-wide (85 pts lower); this property's tenant base skews higher-income than the district average.
- Market conditions: 152 active listings in the ZIP; 31 comparable units currently listed for rent nearby; rentals at typical pace (median 25d on market — plan ~3-4 weeks tenant-placement turnaround); 42% of comp listings sitting > 30 days — soft ceiling on asking rent; lower-income renter base — watch delinquency; 783 units permitted in St. Clair County in 2024 (378 in 5+ unit buildings).
- At $1,437/mo this rent would consume 51% of the median local household income ($34k/yr) (locally 729% of renters already pay >50% of income on rent) — very limited rent-growth headroom before tenants either downsize or default.
Forward outlook
- Local home prices are declining (-3.0%/yr); year-one equity from $613 of loan paydown is wiped out by about $3k of value loss. Plan a longer hold.
- St. Clair County population projected at -23% by 2050 — secular population decline; favor cash flow + early exit over multi-decade hold.
- At projected returns (-3.0% appreciation + 3.0% rent growth), your $25k cash investment doubles in ~5 years — after that, you're playing with house money.
Negotiation context
- It's been on market 150 days — a 12% lower offer ($11k) is reasonable based on typical stale-listing flexibility.
- 2 sale attempts with the ask held roughly flat each time — persistent listings suggest the price (not the market) is what's stuck; bring a comps-based counter.
Risks & watch-outs
- Watch-outs: property tax is 11.1% of price; built in 1923 — expect roof / HVAC / electrical / plumbing capex.
- Climate carrying-cost: extreme-heat days projected 7→21/yr by 2055 (HVAC capex compounding) — expect insurance premiums to compound above CPI over the hold.
Questions for the listing agent
- It's been on market 150 days. Have you received any prior offers? Is the seller open to a 12% concession, seller financing, or rate buy-down credit?
- Built in 1923 — when were the roof, HVAC, electrical panel, plumbing, and water heater last replaced?
- Property tax is high relative to price — has the assessment been appealed recently, and will the sale trigger a re-assessment?
- Why hasn't it sold? Are there any deal-killer items the seller is aware of (foundation, flood, title, zoning, code violations)?
- Is there a deadline driving the sale (1031 exchange, divorce, estate, relocation)? That informs how much negotiation room exists.
- What's the average days-on-market for RENTAL listings here right now (not sales)? A rising rental-DOM trend means longer vacancies and softer asking-rent achievability than the comps imply.
- What's the recent tenant-quality profile in this submarket — average credit score on applications, eviction rate, late-payment / NSF rate, and stable-employment percentage? A property-management company in the area should have these aggregated.
- How much new for-sale + rental construction is in the pipeline within 1–3 miles? Heavy new supply typically softens prices + rents 12–24 months out; constrained supply supports both.
Investment metrics
- 1% rule
- 1.62% ✓
- Cap rate
- 13.35%
- Cash-on-cash
- 25.20%
- DSCR
- 2.12
- GRM
- 5.1
CMA / ARV
- ARV (median comp)
- $88,771
- List price
- $12,000
- Delta
- -86.48%
- Verdict
- UNDERPRICED
- Comps
- 20 within 1.0 mi
Show comp detail 12 sales within ~0.75 mi
| Address | Dist | Beds/Ba | Sqft | Sold | Price | $/sf | Match |
|---|---|---|---|---|---|---|---|
| 614 Cooper Dr | 0.26mi | 4/2.0 (+1) | 1,363 (+2%) | 2mo | $90,000 | $66 | 78 |
| 804 Otto St | 0.13mi | 3/1.0 | 1,260 (-6%) | 6mo | $35,000 | $28 | 75 |
| 815 Sparks Ave | 0.16mi | 4/1.0 (+1) | 1,398 (+4%) | 3mo | $110,000 | $79 | 74 |
| 505 Garrison Ave | 0.46mi | 3/1.0 | 1,391 (+4%) | 0mo | $105,000 | $75 | 68 |
| 794 Mildred Ave | 0.06mi | 4/1.0 (+1) | 1,480 (+10%) | 4mo | $77,500 | $52 | 68 |
| 1115 St Bartholemew Dr Dr | 0.52mi | 4/2.0 (+1) | 1,305 (-3%) | 4mo | $110,000 | $84 | 63 |
| 1100 Richard Dr | 0.19mi | 3/1.0 | 1,177 (-12%) | 5mo | $105,000 | $89 | 62 |
| 1128 Saint Boniface Dr | 0.51mi | 4/1.0 (+1) | 1,305 (-3%) | 2mo | $80,000 | $61 | 62 |
| 1624 Doris Ave | 0.64mi | 3/2.0 | 1,272 (-5%) | 2mo | $105,000 | $83 | 60 |
| 1620 Doris Ave | 0.63mi | 3/1.0 | 1,282 (-4%) | 2mo | $105,000 | $82 | 57 |
| 1427 Williams St | 0.73mi | 4/1.0 (+1) | 1,300 (-3%) | 2mo | $59,500 | $46 | 50 |
| 725 St Nicholas Dr | 0.68mi | 4/1.0 (+1) | 1,400 (+4%) | 6mo | $52,000 | $37 | 48 |
Match score weights: distance 35% · size 25% · config 20% · recency 20%. Top-matched comps best support the ARV.
Projected returns pro-forma
-3.0% appreciation · 3.0% rent growth · sell at horizon
- IRR
- 18.7%
- Equity multiple
- 1.76×
- Total profit
- $18,878
- Equity at exit
- $13,236
- IRR
- 27.1%
- Equity multiple
- 3.39×
- Total profit
- $59,329
- Equity at exit
- $7,675
Cash invested: $24,856 (down + closing). Projections, not guarantees.
Landlord ↔ Tenant lean methodology
- Overall (STATE)
- 43 Moderately Tenant-Leaning
- State Illinois
- 43 Moderately Tenant-Leaning · D+7
- County
- — inherits STATE
- City
- — inherits STATE
ZIP-level market 62206
- Home prices YoY
- -20.2%
- Active inventory
- 152
- Price-to-rent
- 0.7×
Monthly cashflow live
- Estimated rent
- $1,437 high interval (Pro) →
- Mortgage (P&I)
- −$466
- Tax est. 1.5%
- −$111 /mo · $1,332/yr
- Insurance
- −$37
- HOA
- −$0
- Vacancy / Maint / Mgmt
- −$302
- Net cashflow
- $522
Break-even live
Sensitivity live
| Price | -10% $583 | -5% $553 | +0% $522 | +5% $491 | +10% $461 |
|---|---|---|---|---|---|
| Rent | -10% $408 | -5% $465 | +0% $522 | +5% $579 | +10% $635 |
| Rate | -1.0pp $567 | -0.5pp $544 | base $522 | +0.5pp $499 | +1.0pp $476 |
UW: 25.0% down · 7.5% · 30yr · 1.5% tax · 5.0% vac · 8.0% maint · 8.0% mgmt
Financing live
Cash to close
- Down payment
- $22,193
- Closing costs
- $2,663
- Reserves months
- —
- Total cash needed
- —
Loan-product check · same deal, 3 products live
Conventional
25% down · 7.5% · 30yr
- Down + closing
- —
- Monthly P&I
- —
- Monthly cashflow
- —
- DSCR
- —
- Eligible?
- —
Personal DTI + credit; lowest rate.
DSCR
20% down · 8.5% · 30yr
- Down + closing
- —
- Monthly P&I
- —
- Monthly cashflow
- —
- DSCR
- —
- Eligible?
- —
No personal income docs; deal must DSCR.
Hard money
10% down · 12.0% · 12mo
- Down + closing
- —
- Monthly P&I
- —
- Monthly cashflow
- —
- DSCR
- —
- Eligible?
- —
Short-term bridge; refi at stabilization.
Rent comps 31 comps
| Address | Beds | Baths | Sqft | Rent | $/sqft | DOM | Units | Dist |
|---|---|---|---|---|---|---|---|---|
| 819 Mildred Ave East Saint Louis, IL | 3.0 | 1.0 | 936 | $1,250 | $1.34 | 23d | 1 | 0.04mi |
| 818 La Salle Dr East Saint Louis, IL | 3.0 | 1.0 | 1106 | $1,300 | $1.18 | 25d | 1 | 0.12mi |
| 1220 Williams St East Saint Louis, IL | 3.0 | 1.0 | 876 | $1,500 | $1.71 | 16d | 1 | 0.34mi |
| 302 Saint Leonard Dr East Saint Louis, IL | 3.0 | 1.0 | 1155 | $1,300 | $1.13 | 45d | 1 | 0.37mi |
| 850 Saint Bartholomew Dr Cahokia, IL | 3.0 | 1.0 | 1050 | $1,285 | $1.22 | 0d | 1 | 0.38mi |
| 850 Saint Bartholomew Dr Cahokia, IL | 3.0 | 1.0 | 1050 | $1,285 | $1.22 | 18d | 1 | 0.38mi |
| 1312 Saint Raphael St East Saint Louis, IL | 3.0 | 1.0 | 1280 | $1,500 | $1.17 | 45d | 1 | 0.54mi |
| 1405 Williams St Cahokia Heights, IL | 3.0 | 1.0 | 900 | $1,500 | $1.67 | 45d | 1 | 0.58mi |
| 1417 Richard Dr East Saint Louis, IL | 3.0 | 1.0 | 936 | $1,400 | $1.50 | 23d | 1 | 0.65mi |
| 1420 Williams St East Saint Louis, IL | 4.0 | 1.0 | 1300 | $1,500 | $1.15 | 45d | 1 | 0.66mi |
| 1162 Smith St East Saint Louis, IL | 3.0 | 1.0 | 988 | $1,295 | $1.31 | 23d | 1 | 0.67mi |
| 121 Saint Dorothy Dr Cahokia, IL | 3.0 | 1.0 | 988 | $1,500 | $1.52 | 45d | 1 | 0.68mi |
| 1421 Richard Dr East Saint Louis, IL | 3.0 | 1.0 | 936 | $1,100 | $1.18 | 3d | 1 | 0.68mi |
| 1713 Loretta Ave East Saint Louis, IL | 3.0 | 1.0 | 944 | $1,095 | $1.16 | 45d | 1 | 0.69mi |
| 142 Saint Barbara Ln East Saint Louis, IL | 3.0 | 2.0 | 990 | $1,300 | $1.31 | 45d | 1 | 0.71mi |
| 223 Donald St East Saint Louis, IL | 4.0 | 1.0 | 1794 | $1,550 | $0.86 | 45d | 1 | 0.72mi |
| 811 Saint Thomas Ln East Saint Louis, IL | 3.0 | 1.0 | 1040 | $1,295 | $1.25 | 0d | 1 | 0.75mi |
| 811 Saint Thomas Ln East Saint Louis, IL | 3.0 | 1.0 | 1040 | $1,295 | $1.25 | 25d | 1 | 0.75mi |
| 124 Saint James Ln Cahokia Heights, IL | 3.0 | 1.0 | 1064 | $1,350 | $1.27 | 45d | 1 | 0.80mi |
| 1808 Mullens Ave Cahokia Heights, IL | 3.0 | 1.0 | 992 | $1,500 | $1.51 | 4d | 1 | 0.84mi |
| 111 Saint Thomas Ln East Saint Louis, IL | 3.0 | 1.0 | 1040 | $1,350 | $1.30 | 45d | 1 | 0.87mi |
| 526 Saint Leo Dr East Saint Louis, IL | 3.0 | 1.0 | 925 | $1,400 | $1.51 | 4d | 1 | 1.00mi |
| 705 Saint Martin Dr East Saint Louis, IL | 4.0 | 1.0 | 1033 | $1,600 | $1.55 | 23d | 1 | 1.06mi |
| 725 Saint Norbert Dr East Saint Louis, IL | 3.0 | 1.0 | 1232 | $1,500 | $1.22 | 45d | 1 | 1.07mi |
| 1614 Parklane Dr East Saint Louis, IL | 4.0 | 1.0 | 1152 | $1,400 | $1.22 | 25d | 1 | 1.09mi |
| 102 Melvin Dr Unit 34 Sauget, IL | 4.0 | 1.0 | 1352 | $1,700 | $1.26 | 9d | 1 | 1.10mi |
| 1710 Parklane Dr East Saint Louis, IL | 4.0 | 1.0 | 1225 | $1,395 | $1.14 | 45d | 1 | 1.17mi |
| 1706 Andrews Dr East Saint Louis, IL | 4.0 | 1.0 | 925 | $1,320 | $1.43 | 25d | 1 | 1.18mi |
| 58 David St East Saint Louis, IL | 3.0 | 1.0 | 900 | $1,450 | $1.61 | 45d | 1 | 1.19mi |
| 2008 Delores St East Saint Louis, IL | 3.0 | 1.0 | 925 | $1,250 | $1.35 | 6d | 1 | 1.27mi |
| 2116 Doris Ave Cahokia Heights, IL | 3.0 | 1.0 | 880 | $1,400 | $1.59 | 23d | 1 | 1.43mi |
Listing history 18 events
-
2026-06-21days on market $12,000 Active 150 DOM
-
2026-06-18days on market $12,000 Active 147 DOM
-
2026-06-17days on market $12,000 Active 146 DOM
-
2026-06-16days on market $12,000 Active 145 DOM
-
2026-06-15days on market $12,000 Active 144 DOM
-
2026-06-13days on market $12,000 Active 142 DOM
-
2026-06-13days on market $12,000 Active 141 DOM
-
2026-06-09days on market $12,000 Active 138 DOM
-
2026-06-08days on market $12,000 Active 137 DOM
-
2026-06-07days on market $12,000 Active 136 DOM
-
2026-06-05days on market $12,000 Active 133 DOM
-
2026-06-03days on market $12,000 Active 132 DOM
-
2026-06-02days on market $12,000 Active 131 DOM
-
2026-06-01days on market $12,000 Active 130 DOM
-
2026-05-31days on market $12,000 Active 129 DOM
-
2026-01-22$12,000 Active 1548-char remark
Show marketing remark (1548 chars)
This Property will be auctioned on Auction.com - please go to the website, register an account and submit your offer(s). Listed as "825 Mildred Ave Sauget, IL 62206" on Auction.com Estimated as 3BR/1BA ranch with 1341 sq ft and crawl space on HUGE 1.19 acres lot! Built in 1923. SAME STREET as 731 Mildred (also in portfolio) - buying both creates huge advantages! Paired benefits: 10-15% bulk labor discount ($5K savings), 8% bulk materials savings ($3K), synchronized timeline, shared permitting ($500), single marketing campaign. Real savings: $8,500 if both purchased. Cahokia Heights/Sauget area shows stable values. Perfect for portfolio investors, systematic flippers with capacity for multiple projects, contractors leveraging economies of scale, BRRRR investors building rental portfolios. Exterior showing (curb viewing) only. NO inside showings available, no more inside pictures available. No contingencies will be accepted. Cash sale only. Sold "where is and as is" No Survey or Keys Provided. Interior Access for Home Inspections Will Not Be Granted. Listing Information May Not Be Accurate. Buyers Must Do Their Own Due Diligence to Verify Number of Beds, Baths, Square Footage, Room Sizes, Lot Size & Any Other Property Details. Photos, Marketing Comments, and Due Diligence Items are Provided for Guidance Purposes Only. By Making an Offer on This Property, the Buyer Represents They Have Independently Verified All Information and Have Made the Decision to Make an Offer Based Upon Their Own Investigation.
-
2025-10-09$16,000 Active
-
2025-10-03historical
ⓘ Source: listings_history table (triggers on properties + properties_extension) + one-shot
backfill from property_details.listing_events for pre-trigger history.
Climate risk First Street
- Flood 1/10 Low 0% chance over 30 yrs
- Wildfire 1/10 Low
- Heat 5/10 Major 7 d/yr ≥108°F today · 21 d/yr by 30 yrs out
- Wind 2/10 Low 100% chance of damaging wind over 30 yrs
- Air quality 3/10 Moderate 3 unhealthy d/yr today · 4 by 30 yrs out
Nearby sold comps map
Loading sold comps map…
Walkable amenities ~0.75 mi
Loading nearby amenities…
Taxation est. · year 1
- Rental income
- $17,246
- − Mortgage interest
- −$4,973
- − Property taxes
- −$1,332
- − Insurance
- −$444
- − Repairs & maintenance
- −$1,380
- − Management
- −$1,380
- − Depreciation
- −$2,582
- Taxable income
- $5,157
- Est. tax owed @ 24.0%
- −$1,238
- After-tax cash flow
- $5,025/yr
For passive investors: Depreciation is non-cash, so a rental often shows a tax loss while cash-flowing — sheltering income. Rental losses are passive: they offset passive income freely, and up to $25,000/yr can offset ordinary (W-2) income if you actively participate and your MAGI is under $100k (phasing out to $0 by $150k); unused losses carry forward. On sale, claimed depreciation is recaptured at up to 25%, and gains may owe capital-gains tax (a 1031 exchange can defer both). Figures are a year-1 estimate at your 24.0% rate — not tax advice; consult a CPA.
Schools (NCES district)
- District
- Cahokia CUSD 187
- NCES district ID
- 1708040
- Math proficiency
- 3% ▼ -2.00%
- Reading proficiency
- 5% ▬ 0.00%
- Median HH income
- $28,028
- Composite
- 6.44/100
- National rank
- #14827
- State rank
- #864 of 919 in IL
Livability — Cahokia Heights
No livability data for this city. (Only ~50 U.S. cities are tracked.)
Census & demographics
- Census place
- Cahokia Heights, IL
- County
- Saint Clair County · 169,691 people
- City population
- 19,956
- Metro
- St. Louis, MO-IL
- Population (ZIP)
- 12,959
- Household income
- $33,838
- Rent vs Own
- Severe rent burden
- 729.0
Population outlook (St. Clair County) Hauer SSP2
- Today (2025)
- 250,366 people
- By 2030
- 240,511 · -3.9%
- By 2040
- 217,391 · -13.2%
- By 2050
- 192,699 · -23.0%
- By 2075
- 140,637 · -43.8%
- By 2100
- 100,499 · -59.9%
Race, ethnicity, and origin ACS 2023
- Neighborhood character
- Diverse neighborhood (Simpson 0.56)
- Race & ethnicity
- Black 59% White 29% Two or more races 6% Hispanic / Latino 3% Asian 2%
- Common ancestry
- Romanian 2% Lithuanian 1% Iranian 1%
- Foreign-born
- 2% · China
- Languages at home
- 95% English-only · Spanish 3% Other Indo-European 1% Chinese 1%
Political lean MEDSL · St. Clair
- 2024 margin
- Lean D (+7.9) · D 53.0% · R 45.1% · Other 1.8%
- 2008→2024 swing
- -14.6pp toward R · 2008: 22.4pp · 2024: 7.9pp
- All cycles
- 2024: D+7.9 2020: D+8.7 2016: D+5.6 2012: D+14.5 2008: D+22.4
Not yet ingested
- Civics
- —
Market trends
- HPI YoY
- ▼ -33.26%
- Current HPI
- 131.5144
- Rent YoY
- —
- Metro
- St. Louis, MO-IL
- State GDP YoY
- ▲ 1.59%
- F500 in state
- 60
Industry mix (Fortune 500 HQ in IL)
| Industry | F500 HQs | Revenue |
|---|---|---|
| Insurance | 4 | $201B |
|
||
| Consumer Goods | 4 | $87B |
|
||
| Industrial Machinery | 3 | $64B |
|
||
| Healthcare | 2 | $55B |
|
||
| Retail / Pharmacy | 1 | $148B |
|
||
| Agriculture / Food | 1 | $86B |
|
||
Price history
-25.0% since first listed3 events — show timeline
- 2026-01-22 Listed $12,000 MARIS as Distributed by MLS Grid
- 2025-10-09 Listed $16,000 MARIS as Distributed by MLS Grid
- 2025-10-03 Coming Soon — MARIS as Distributed by MLS Grid
Property tax history
+3.5%/yrLatest (2019): $1,304 · -19.4% YoY. Source: county tax records.
Cash-flow waterfall
monthlySold comps — $/sqft
last 12 mo · ≤1 miLoading sold comps…