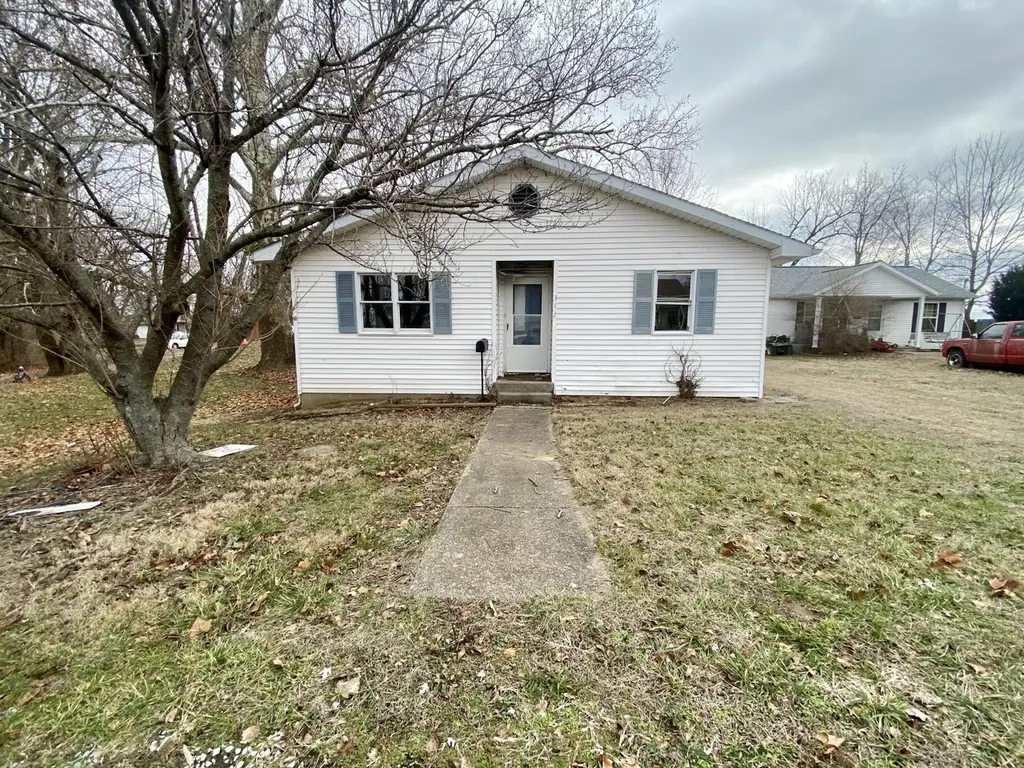
317 N Padgett · Morganfield, KY
Flood risk 1/10 · Minimal
- FEMA flood zone
- X (unshaded)
- Chance of flooding over 30 yrs
- 0.0%
- Est. flood insurance / yr
- $507 – $1,088
Fire risk 1/10 · Minimal
- Est. fire insurance / yr
- $839 – $1,559
Heat risk 5/10 · Moderate
- Hot days now (above 108°F)
- 7 days/yr
- Hot days in 30 yrs
- 20 days/yr
Wind risk 3/10 · Minor
- Chance of severe wind over 30 yrs
- 6.0%
Air-quality risk 2/10 · Minimal
- Unhealthy air days now
- 0 days/yr
- Unhealthy air days in 30 yrs
- 2 days/yr
Risk factors via First Street. Map © Google.
Why this score? — see what drove the D+ grade
The composite is a weighted blend of 9 inputs, each scored 0–100. Each bar is that input's sub-score; the figure is the points it added to the 100-point composite (weight × sub-score).
- Cash flow +15.0/30.0
- ARV discount +7.5/15.0
- 1% rule +5.0/10.0
- DSCR +5.0/10.0
- Appreciation +4.2/10.0
- Livability +3.2/5.0
- Rent growth +2.5/5.0
- Condition / age +2.5/5.0
- Schools +2.2/10.0
$25,000
🖨 Deal sheet (PDF) 📄 Offer letter ✓ Due diligence
Listing remarks
This 3 bedroom, 1 bath home in Morganfield, KY offers 1280 square feet of living space and is a great investment opportunity for anyone looking for a project. The home is in need of some repairs, but with the right repairs and updates, it has the potential to become a beautiful and modern property. This property could be transformed into a cozy and comfortable home. Don't miss out on this great investment opportunity!
Key facts
- 0.45 acre lot
- Listed 541 days
Property features AI
Exterior
- Utilities: Public sewer
- Home design: One level
- Construction: Vinyl siding; Block foundation
- Exterior features: Rural view; Public water
Interior
- Flooring: Hardwood
- Bathrooms: 1 full bathroom
- Heating & cooling: Electric heating; Electric cooling
- Interior features: Hardwood flooring; Total of 4 rooms
Neighborhood map
What this means for you Summary
Snapshot
- This is a 3-bed/1.0-bath single-family listed at $25k.
Deal economics
- At list price, monthly cash flow is $671 ($8k/yr) — positive.
- The deal already cash-flows at list — no discount required.
- Meets the 1% rule at list price ($1k rent vs $25k).
- Recommended offer: $22k (12.0% below list) — sets the bar for market timing.
Location & tenants
- Location reads 63/100 on livability (#336 in KY) — a middle-class / working-renter tenant base. Strengths: crime A+, cost of living A+, housing A+; Watch: amenities F, commute F, employment D-.
- Union County (rural): math 20% / reading 33% proficiency, ranked #134 of 165 in KY (top 81%) — low school quality limits family demand, transient renter base, plan for 1-2y turnover.
- Zoned schools: Sturgis Elementary School (math 32% / reading 42%, grade F, #255 of 676 statewide, top 42%, 369 students, 60% FRL); Union County High School (math 22% / reading 42%, grade F, #97 of 254 statewide, top 46%, 630 students, 50% FRL) — zoned schools at 55% FRL track the district average.
- Market conditions: 24 active listings in the ZIP.
Forward outlook
- Local home prices are declining (-1.6%/yr); year-one equity from $173 of loan paydown is wiped out by about $389 of value loss. Plan a longer hold.
- Union County population projected at -18% by 2050 — secular population decline; favor cash flow + early exit over multi-decade hold.
- At projected returns (-1.6% appreciation + 3.0% rent growth), your $7k cash investment doubles in ~1 year — after that, you're playing with house money.
Negotiation context
- It's been on market 541 days — a 12% lower offer ($22k) is reasonable based on typical stale-listing flexibility.
- 6 sale attempts since 3y ago with the ask held roughly flat each time — persistent listings suggest the price (not the market) is what's stuck; bring a comps-based counter.
Risks & watch-outs
- Climate carrying-cost: extreme-heat days projected 7→20/yr by 2055 (HVAC capex compounding) — expect insurance premiums to compound above CPI over the hold.
Questions for the listing agent
- It's been on market 541 days. Have you received any prior offers? Is the seller open to a 12% concession, seller financing, or rate buy-down credit?
- Why hasn't it sold? Are there any deal-killer items the seller is aware of (foundation, flood, title, zoning, code violations)?
- Is there a deadline driving the sale (1031 exchange, divorce, estate, relocation)? That informs how much negotiation room exists.
- Schools are F-rated, which usually means shorter tenancies and higher turnover. Who's the typical renter profile here, and what's been the actual vacancy rate?
- The area grade is low — what's the realistic commute time and amenity access for the typical tenant pool here? Any planned neighborhood developments (good or bad) we should know about?
- What's the average days-on-market for RENTAL listings here right now (not sales)? A rising rental-DOM trend means longer vacancies and softer asking-rent achievability than the comps imply.
- What's the recent tenant-quality profile in this submarket — average credit score on applications, eviction rate, late-payment / NSF rate, and stable-employment percentage? A property-management company in the area should have these aggregated.
- How much new for-sale + rental construction is in the pipeline within 1–3 miles? Heavy new supply typically softens prices + rents 12–24 months out; constrained supply supports both.
Investment metrics
- 1% rule
- 4.24% ✓
- Cap rate
- 38.48%
- Cash-on-cash
- 114.95%
- DSCR
- 6.11
- GRM
- 2.0
CMA / ARV
- ARV (median comp)
- $138,056
- List price
- $25,000
- Delta
- -81.89%
- Verdict
- UNDERPRICED
- Comps
- 20 within 1.0 mi
Show comp detail 9 sales within ~0.75 mi
| Address | Dist | Beds/Ba | Sqft | Sold | Price | $/sf | Match |
|---|---|---|---|---|---|---|---|
| 714 E Lyon St | 0.11mi | 3/2.0 | 1,300 (+2%) | 1mo | $177,625 | $137 | 87 |
| 718 E Lyon St | 0.11mi | 3/2.0 | 1,305 (+2%) | 1mo | $185,000 | $142 | 86 |
| 215 N Mart St | 0.22mi | 3/1.0 | 1,416 (+11%) | 11mo | $160,000 | $113 | 63 |
| 43 Senate Ave | 0.51mi | 3/2.0 | 1,350 (+6%) | 5mo | $164,900 | $122 | 58 |
| 309 E Manning St | 0.29mi | 3/2.0 | 1,152 (-10%) | 10mo | $118,500 | $103 | 57 |
| 211 E Geiger St | 0.64mi | 2/1.0 (-1) | 1,316 (+3%) | 9mo | $200,000 | $152 | 53 |
| 18 Senate Ave | 0.59mi | 3/1.0 | 1,124 (-12%) | 2mo | $125,000 | $111 | 51 |
| 17 Congress Dr | 0.59mi | 3/2.0 | 1,100 (-14%) | 6mo | $121,000 | $110 | 40 |
| 405 N Townsend St | 0.64mi | 3/1.0 | 1,088 (-15%) | 9mo | $183,000 | $168 | 38 |
Match score weights: distance 35% · size 25% · config 20% · recency 20%. Top-matched comps best support the ARV.
Projected returns pro-forma
-1.56% appreciation · 3.0% rent growth · sell at horizon
- IRR
- —
- Equity multiple
- 6.75×
- Total profit
- $40,215
- Equity at exit
- $5,373
- IRR
- —
- Equity multiple
- 14.07×
- Total profit
- $91,475
- Equity at exit
- $5,095
Cash invested: $7,000 (down + closing). Projections, not guarantees.
Landlord ↔ Tenant lean methodology
- Overall (STATE)
- 83 Strongly Landlord-Friendly
- State Kentucky
- 83 Strongly Landlord-Friendly · R+16
- County
- — inherits STATE
- City
- — inherits STATE
ZIP-level market 42437
- Home prices YoY
- -0.7%
- Active inventory
- 24
- Price-to-rent
- 2.0×
Monthly cashflow live
- Estimated rent
- $1,061 medium interval (Pro) →
- Mortgage (P&I)
- −$131
- Tax from tax record
- −$26 /mo · $315/yr
- Insurance
- −$10
- HOA
- −$0
- Vacancy / Maint / Mgmt
- −$223
- Net cashflow
- $671
Break-even live
Sensitivity live
| Price | -10% $685 | -5% $678 | +0% $671 | +5% $663 | +10% $656 |
|---|---|---|---|---|---|
| Rent | -10% $587 | -5% $629 | +0% $671 | +5% $712 | +10% $754 |
| Rate | -1.0pp $683 | -0.5pp $677 | base $671 | +0.5pp $664 | +1.0pp $657 |
UW: 25.0% down · 7.5% · 30yr · 1.5% tax · 5.0% vac · 8.0% maint · 8.0% mgmt
Financing live
Cash to close
- Down payment
- $6,250
- Closing costs
- $750
- Reserves months
- —
- Total cash needed
- —
Loan-product check · same deal, 3 products live
Conventional
25% down · 7.5% · 30yr
- Down + closing
- —
- Monthly P&I
- —
- Monthly cashflow
- —
- DSCR
- —
- Eligible?
- —
Personal DTI + credit; lowest rate.
DSCR
20% down · 8.5% · 30yr
- Down + closing
- —
- Monthly P&I
- —
- Monthly cashflow
- —
- DSCR
- —
- Eligible?
- —
No personal income docs; deal must DSCR.
Hard money
10% down · 12.0% · 12mo
- Down + closing
- —
- Monthly P&I
- —
- Monthly cashflow
- —
- DSCR
- —
- Eligible?
- —
Short-term bridge; refi at stabilization.
Listing history 23 events
-
2026-06-13days on market $25,000 Active 541 DOM
-
2026-06-12days on market $25,000 Active 540 DOM
-
2026-06-09days on market $25,000 Active 537 DOM
-
2026-06-08days on market $25,000 Active 536 DOM
-
2026-06-07days on market $25,000 Active 535 DOM
-
2026-06-07days on market $25,000 Active 534 DOM
-
2026-06-04days on market $25,000 Active 531 DOM
-
2026-06-02days on market $25,000 Active 530 DOM
-
2026-06-01days on market $25,000 Active 529 DOM
-
2026-05-31days on market $25,000 Active 528 DOM
-
2026-05-31days on market $25,000 Active 527 DOM
-
2026-01-13status Active
-
2025-10-29status Pending
-
2024-11-11status Active
-
2024-04-29status Active
-
2024-01-18status Active
-
2023-03-06status Active
-
2023-03-01status Pending
-
2023-03-01historical
-
2023-03-01historical
-
2023-03-01historical
-
2023-01-22$25,000 Active
-
2005-02-01soldstatus $40,600
ⓘ Source: listings_history table (triggers on properties + properties_extension) + one-shot
backfill from property_details.listing_events for pre-trigger history.
Tax reassessment forecast KY · Resets to sale price
- Current annual tax
- $315 · $26/mo
- Projected year-2 tax
- $315 · $26/mo
- Expected delta
- $0/yr ($0/mo · 0.0%)
ⓘ Screening estimate from a state-policy table — verify with the county assessor before closing.
Climate risk First Street
- Flood 1/10 Low FEMA zone X (unshaded) · 0% chance over 30 yrs
- Wildfire 1/10 Low
- Heat 5/10 Major 7 d/yr ≥108°F today · 20 d/yr by 30 yrs out
- Wind 3/10 Moderate 6% chance of damaging wind over 30 yrs
- Air quality 2/10 Low 0 unhealthy d/yr today · 2 by 30 yrs out
Nearby sold comps map
Loading sold comps map…
Walkable amenities ~0.75 mi
Loading nearby amenities…
Taxation est. · year 1
- Rental income
- $12,734
- − Mortgage interest
- −$1,400
- − Property taxes
- −$315
- − Insurance
- −$125
- − Repairs & maintenance
- −$1,019
- − Management
- −$1,019
- − Depreciation
- −$727
- Taxable income
- $8,129
- Est. tax owed @ 24.0%
- −$1,951
- After-tax cash flow
- $6,096/yr
For passive investors: Depreciation is non-cash, so a rental often shows a tax loss while cash-flowing — sheltering income. Rental losses are passive: they offset passive income freely, and up to $25,000/yr can offset ordinary (W-2) income if you actively participate and your MAGI is under $100k (phasing out to $0 by $150k); unused losses carry forward. On sale, claimed depreciation is recaptured at up to 25%, and gains may owe capital-gains tax (a 1031 exchange can defer both). Figures are a year-1 estimate at your 24.0% rate — not tax advice; consult a CPA.
Schools (NCES district)
- District
- Union County
- NCES district ID
- 2105640
- Math proficiency
- 20% ▼ -20.00%
- Reading proficiency
- 33% ▼ -20.00%
- Median HH income
- $39,776
- Composite
- 22.27/100
- National rank
- #8139
- State rank
- #134 of 165 in KY
Livability — Morganfield
- Score
- 63/100
- State rank
- #336
- US rank
- #15964
Category grades
Schools grade is shown separately in the Schools card above.
Census & demographics
- Census place
- Morganfield, KY
- Population (ZIP)
- 7,250
Population outlook (Union County) Hauer SSP2
- Today (2025)
- 15,038 people
- By 2030
- 14,681 · -2.4%
- By 2040
- 13,607 · -9.5%
- By 2050
- 12,406 · -17.5%
- By 2075
- 9,720 · -35.4%
- By 2100
- 7,841 · -47.9%
Race, ethnicity, and origin ACS 2023
- Neighborhood character
- Predominantly White (84%)
- Race & ethnicity
- White 84% Black 10% Two or more races 3% Hispanic / Latino 2%
- Common ancestry
- Italian 7% Lithuanian 2% Slovak 1%
- Foreign-born
- 1% · Canada
- Languages at home
- 98% English-only · Spanish 1% Other Asian/Pacific 1%
Political lean MEDSL · Union
- 2024 margin
- Solid R (+58.3) · D 20.2% · R 78.5% · Other 1.2%
- 2008→2024 swing
- -53.1pp toward R · 2008: -5.2pp · 2024: -58.3pp
- All cycles
- 2024: R+58.3 2020: R+52.2 2016: R+54.3 2012: R+33.6 2008: R+5.2
Not yet ingested
- Civics
- —
Market trends
- HPI YoY
- ▼ -1.56%
- Current HPI
- 222.4762
- Rent YoY
- —
- Metro
- —
- State GDP YoY
- ▲ 1.81%
- F500 in state
- 4
Industry mix (Fortune 500 HQ in KY)
| Industry | F500 HQs | Revenue |
|---|---|---|
| Healthcare | 1 | $118B |
|
||
| Food / Beverage | 1 | $7B |
|
||
Price history
-38.4% since first listed12 events — show timeline
- 2026-01-13 Relisted — ImagineMLS
- 2025-10-29 Pending — ImagineMLS
- 2024-11-11 Relisted — ImagineMLS
- 2024-04-29 Relisted — ImagineMLS
- 2024-01-18 Relisted — ImagineMLS
- 2023-03-06 Relisted — ImagineMLS
- 2023-03-01 Pending — ImagineMLS
- 2023-03-01 Listing Removed — ImagineMLS
- 2023-03-01 Listing Removed — ImagineMLS
- 2023-03-01 Listing Removed — ImagineMLS
- 2023-01-22 Listed $25,000 ImagineMLS
- 2005-02-01 Sold (Public Records) $40,600 Public Records
Property tax history
-1.0%/yrLatest (2025): $315 · -1.1% YoY. Source: county tax records.
Cash-flow waterfall
monthlySold comps — $/sqft
last 12 mo · ≤1 miLoading sold comps…