 7-Plex
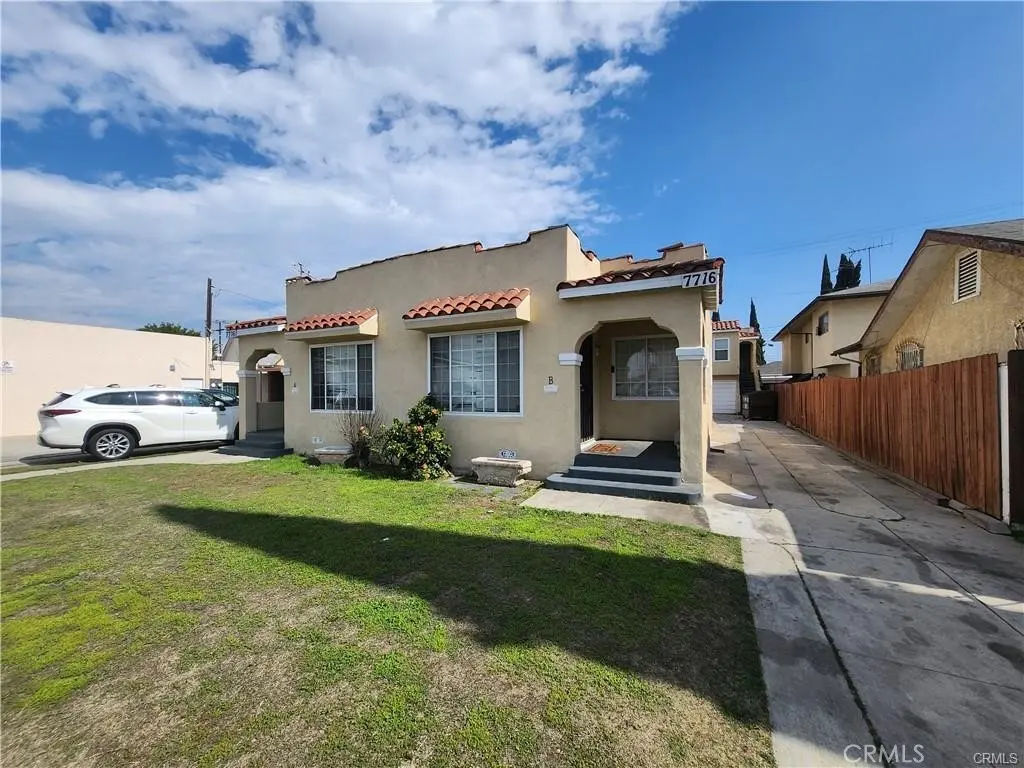
7716 California · Huntington Park, CA
Flood risk 1/10 · Minimal
- FEMA flood zone
- X (unshaded)
- Chance of flooding over 30 yrs
- 0.0%
- Est. flood insurance / yr
- $507 – $1,088
Fire risk 1/10 · Minimal
- Est. fire insurance / yr
- $659 – $1,223
Heat risk 5/10 · Moderate
- Hot days now (above 91°F)
- 7 days/yr
- Hot days in 30 yrs
- 21 days/yr
Wind risk 1/10 · Minimal
- Chance of severe wind over 30 yrs
- —
Air-quality risk 5/10 · Moderate
- Unhealthy air days now
- 9 days/yr
- Unhealthy air days in 30 yrs
- 9 days/yr
Risk factors via First Street. Map © Google.
Why this score? — see what drove the C grade
The composite is a weighted blend of 9 inputs, each scored 0–100. Each bar is that input's sub-score; the figure is the points it added to the 100-point composite (weight × sub-score).
- Cash flow +24.7/30.0
- DSCR +8.0/10.0
- ARV discount +7.5/15.0
- 1% rule +6.4/10.0
- Condition / age +3.8/5.0
- Schools +3.6/10.0
- Livability +3.1/5.0
- Rent growth +2.1/5.0
- Appreciation +0.0/10.0
$1,375,000
🖨 Deal sheet 📄 Offer letter ✓ Due diligence
Multi-family units
County records classify this as Multi-Family (5+ Unit). Listing-text estimate: 7 units. confirmed
5+ unit building — per-unit beds/baths from public records are typically unavailable; the breakdown below (if shown) is an estimate from the listing text.
Listing remarks MLS
Attention Investors! Prime 7-Unit Opportunity with Value-Add Potential Near Downtown LA! Exceptional opportunity to own a 7-unit income property located at 7716 California Ave in the centrally located city of Huntington Park—a high-demand rental market just minutes from Downtown Los Angeles. This property offers immediate upside and strong income potential, featuring 4 vacant units ready to be leased at current market rents, allowing a new owner to increase cash flow from day one significantly. With rental demand continuing to grow in Huntington Park, this is a rare opportunity to stabilize and maximize returns quickly. The property also includes 4 garages with excellent potential for ADU (Accessory Dwelling Unit) conversion (buyer to verify with city)—creating additional income streams and long-term value appreciation. Ideally located near major freeways, public transportation, shopping, dining, and employment centers, tenants enjoy convenient access to everything Downtown Los Angeles has to offer while benefiting from more affordable housing options.
Key facts
- 5,436 sq ft lot
- 4 garage spots
- Built 1938
Neighborhood map
What this means for you Summary
Snapshot
- This is a 7 × 3-bed/7.0-bath units multifamily listed at $1.38M. Condition is rated good.
Deal economics
- At list price, monthly cash flow is $3k ($34k/yr) — positive. Per door: $409/mo.
- The deal already cash-flows at list — no discount required.
- Meets the 1% rule at list price ($16k rent vs $1.38M).
- Recommended offer: $1.33M (3.0% below list) — sets the bar for market timing.
- Cap rate 8.8% vs local median 3.1% in Huntington Park — top-decile yield for the area; either an underpriced asset or a hidden risk that comps aren't pricing in. Stress-test before assuming the spread holds.
Location & tenants
- Location reads 62/100 on livability (#491 in CA) — a middle-class / working-renter tenant base. Strengths: commute A+; Watch: employment D+, health & safety D, schools D-.
- Los Angeles Unified (urban): math 29% / reading 54% proficiency, ranked #223 of 517 in CA (top 43%) — families likely to look elsewhere, expect single-tenant / working-renter base with shorter leases; 67% free/reduced lunch — lower-income household profile, screen leases tightly.
- Market conditions: Rents soft (-1.4%/yr); 52 active listings in the ZIP; 19,697 units permitted in Los Angeles County in 2024 (9,426 in 5+ unit buildings).
- At $15,648/mo this rent would consume 290% of the median local household income ($65k/yr) (locally 3774% of renters already pay >50% of income on rent) — very limited rent-growth headroom before tenants either downsize or default.
Forward outlook
- Local home prices are declining (-3.0%/yr); year-one equity from $10k of loan paydown is wiped out by about $41k of value loss. Plan a longer hold.
- Los Angeles County population projected at +9% by 2050 — modest demand growth; plan on rents tracking national, not racing it.
Negotiation context
- It's been on market 48 days — a 3% lower offer ($1.33M) is reasonable based on typical stale-listing flexibility.
- 4 sale attempts since 3y ago; this cycle's ask has dropped $75k (5%) from the opening price — seller is motivated, your offer sets the floor, not the list.
Risks & watch-outs
- Watch-outs: built in 1938 — expect roof / HVAC / electrical / plumbing capex.
- Climate carrying-cost: extreme-heat days projected 7→21/yr by 2055 (HVAC capex compounding) — expect insurance premiums to compound above CPI over the hold.
Questions for the listing agent
- It's been on market 48 days. Have you received any prior offers? Is the seller open to a 3% concession, seller financing, or rate buy-down credit?
- Can we see the unit-by-unit rent roll, current vacancy, and any below-market leases? What's the average tenancy length?
- What capital expenditures (roof, boiler, parking lot, exteriors) have been made in the last 5 years, and what's planned in the next 2?
- Built in 1938 — when were the roof, HVAC, electrical panel, plumbing, and water heater last replaced?
- Is there a deadline driving the sale (1031 exchange, divorce, estate, relocation)? That informs how much negotiation room exists.
- Schools are D-rated, which usually means shorter tenancies and higher turnover. Who's the typical renter profile here, and what's been the actual vacancy rate?
- Crime grade is F in this area — have there been break-ins, vandalism, or insurance claims at this property in the last 3 years? What carrier currently insures it and at what premium?
- What's the average days-on-market for RENTAL listings here right now (not sales)? A rising rental-DOM trend means longer vacancies and softer asking-rent achievability than the comps imply.
- What's the recent tenant-quality profile in this submarket — average credit score on applications, eviction rate, late-payment / NSF rate, and stable-employment percentage? A property-management company in the area should have these aggregated.
- How much new apartment / multifamily construction is in the pipeline within 1–3 miles? Heavy new supply (>2% of stock underway) typically softens rents 12–24 months out; light construction supports rent growth.
Investment metrics
- 1% rule
- 1.14% ✓
- Cap rate
- 8.79%
- Cash-on-cash
- 8.91%
- DSCR
- 1.40
- GRM
- 7.3
CMA / ARV
- ARV (median comp)
- $864,973
- List price
- $1,375,000
- Delta
- 58.96%
- Verdict
- OVERPRICED
- Comps
- 20 within 1.0 mi
Projected returns pro-forma
-3.0% appreciation · 0.0% rent growth · sell at horizon
- IRR
- -6.2%
- Equity multiple
- 0.78×
- Total profit
- $-86,301
- Equity at exit
- $205,017
- IRR
- -0.7%
- Equity multiple
- 0.96×
- Total profit
- $-16,893
- Equity at exit
- $118,885
Cash invested: $385,000 (down + closing). Projections, not guarantees.
Landlord ↔ Tenant lean methodology
- Overall (STATE)
- 18 Strongly Tenant-Friendly
- State California
- 18 Strongly Tenant-Friendly · D+13
- County
- — inherits STATE
- City
- — inherits STATE
ZIP-level market 90255
- Rents YoY
- -1.4%
- Active inventory
- 52
- Price-to-rent
- 51.3×
Monthly cashflow live
- Estimated rent
- $15,648 medium interval (Pro) →
- Mortgage (P&I)
- −$7,211
- Tax est. 1.5%
- −$1,719 /mo · $20,625/yr
- Insurance
- −$573
- HOA
- −$0
- Vacancy / Maint / Mgmt
- −$3,286
- Net cashflow
- $2,860
Break-even live
7-unit breakdown (identical units grouped — click to expand)
| Units | Beds | Baths | Est. rent |
|---|---|---|---|
| 7× units | 3 | 7 | $15,645 |
| #1 | 3 | 7 | $2,235 |
| #2 | 3 | 7 | $2,235 |
| #3 | 3 | 7 | $2,235 |
| #4 | 3 | 7 | $2,235 |
| #5 | 3 | 7 | $2,235 |
| #6 | 3 | 7 | $2,235 |
| #7 | 3 | 7 | $2,235 |
| Total (7 units) | $15,648 | ||
UW: 25.0% down · 7.5% · 30yr · 1.5% tax · 5.0% vac · 8.0% maint · 8.0% mgmt
Financing live
Cash to close
- Down payment
- $343,750
- Closing costs
- $41,250
- Reserves months
- —
- Total cash needed
- —
Loan-product check · same deal, 3 products live
Conventional
25% down · 7.5% · 30yr
- Down + closing
- —
- Monthly P&I
- —
- Monthly cashflow
- —
- DSCR
- —
- Eligible?
- —
Personal DTI + credit; lowest rate.
DSCR
20% down · 8.5% · 30yr
- Down + closing
- —
- Monthly P&I
- —
- Monthly cashflow
- —
- DSCR
- —
- Eligible?
- —
No personal income docs; deal must DSCR.
Hard money
10% down · 12.0% · 12mo
- Down + closing
- —
- Monthly P&I
- —
- Monthly cashflow
- —
- DSCR
- —
- Eligible?
- —
Short-term bridge; refi at stabilization.
Listing history 28 events
-
2026-06-18days on market $1,375,000 Active 48 DOM
-
2026-06-17days on market $1,375,000 Active 47 DOM
-
2026-06-16days on market $1,375,000 Active 46 DOM
-
2026-06-15days on market $1,375,000 Active 45 DOM
-
2026-06-13days on market $1,375,000 Active 43 DOM
-
2026-06-09days on market $1,375,000 Active 39 DOM
-
2026-06-08days on market $1,375,000 Active 38 DOM
-
2026-06-07days on market $1,375,000 Active 37 DOM
-
2026-06-04days on market $1,375,000 Active 34 DOM
-
2026-06-03days on market $1,375,000 Active 33 DOM
-
2026-06-02days on market $1,375,000 Active 32 DOM
-
2026-06-01days on market $1,375,000 Active 31 DOM
-
2026-05-31days on market $1,375,000 Active 30 DOM
-
2026-05-07price $1,375,000 1083-char remark
Show marketing remark (1083 chars)
Attention Investors! Prime 7-Unit Opportunity with Value-Add Potential Near Downtown LA! Exceptional opportunity to own a 7-unit income property located at 7716 California Ave in the centrally located city of Huntington Park—a high-demand rental market just minutes from Downtown Los Angeles. This property offers immediate upside and strong income potential, featuring 4 vacant units ready to be leased at current market rents, allowing a new owner to increase cash flow from day one significantly. With rental demand continuing to grow in Huntington Park, this is a rare opportunity to stabilize and maximize returns quickly. The property also includes 4 garages with excellent potential for ADU (Accessory Dwelling Unit) conversion (buyer to verify with city)—creating additional income streams and long-term value appreciation. Ideally located near major freeways, public transportation, shopping, dining, and employment centers, tenants enjoy convenient access to everything Downtown Los Angeles has to offer while benefiting from more affordable housing options.
-
2026-05-01$1,450,000 Active 1083-char remark
Show marketing remark (1083 chars)
Attention Investors! Prime 7-Unit Opportunity with Value-Add Potential Near Downtown LA! Exceptional opportunity to own a 7-unit income property located at 7716 California Ave in the centrally located city of Huntington Park—a high-demand rental market just minutes from Downtown Los Angeles. This property offers immediate upside and strong income potential, featuring 4 vacant units ready to be leased at current market rents, allowing a new owner to increase cash flow from day one significantly. With rental demand continuing to grow in Huntington Park, this is a rare opportunity to stabilize and maximize returns quickly. The property also includes 4 garages with excellent potential for ADU (Accessory Dwelling Unit) conversion (buyer to verify with city)—creating additional income streams and long-term value appreciation. Ideally located near major freeways, public transportation, shopping, dining, and employment centers, tenants enjoy convenient access to everything Downtown Los Angeles has to offer while benefiting from more affordable housing options.
-
2026-04-30historical $1,450,000 1083-char remark
Show marketing remark (1083 chars)
Attention Investors! Prime 7-Unit Opportunity with Value-Add Potential Near Downtown LA! Exceptional opportunity to own a 7-unit income property located at 7716 California Ave in the centrally located city of Huntington Park—a high-demand rental market just minutes from Downtown Los Angeles. This property offers immediate upside and strong income potential, featuring 4 vacant units ready to be leased at current market rents, allowing a new owner to increase cash flow from day one significantly. With rental demand continuing to grow in Huntington Park, this is a rare opportunity to stabilize and maximize returns quickly. The property also includes 4 garages with excellent potential for ADU (Accessory Dwelling Unit) conversion (buyer to verify with city)—creating additional income streams and long-term value appreciation. Ideally located near major freeways, public transportation, shopping, dining, and employment centers, tenants enjoy convenient access to everything Downtown Los Angeles has to offer while benefiting from more affordable housing options.
-
2025-06-23historical $1,600
-
2025-06-06price $1,600
-
2025-05-30historical
-
2025-05-22$1,700
-
2025-03-09price $1,668,000
-
2024-12-22price $1,675,000
-
2024-12-21price $1,435,000
-
2024-11-16price $1,750,000
-
2024-11-12$1,800,000 Active
-
2023-11-14soldstatus $1,625,000 Closed Sale
-
2023-10-12status Pending Sale
-
2023-09-14$1,699,000 Active
ⓘ Source: listings_history table (triggers on properties + properties_extension) + one-shot
backfill from property_details.listing_events for pre-trigger history.
Climate risk First Street
- Flood 1/10 Low FEMA zone X (unshaded) · 0% chance over 30 yrs
- Wildfire 1/10 Low
- Heat 5/10 Major 7 d/yr ≥91°F today · 21 d/yr by 30 yrs out
- Wind 1/10 Low
- Air quality 5/10 Major 9 unhealthy d/yr today · 9 by 30 yrs out
Nearby sold comps map
Loading sold comps map…
Walkable amenities ~0.75 mi
Loading nearby amenities…
Taxation est. · year 1
- Rental income
- $187,776
- − Mortgage interest
- −$77,021
- − Property taxes
- −$20,625
- − Insurance
- −$6,875
- − Repairs & maintenance
- −$15,022
- − Management
- −$15,022
- − Depreciation
- −$40,000
- Taxable income
- $13,210
- Est. tax owed @ 24.0%
- −$3,171
- After-tax cash flow
- $31,145/yr
For passive investors: Depreciation is non-cash, so a rental often shows a tax loss while cash-flowing — sheltering income. Rental losses are passive: they offset passive income freely, and up to $25,000/yr can offset ordinary (W-2) income if you actively participate and your MAGI is under $100k (phasing out to $0 by $150k); unused losses carry forward. On sale, claimed depreciation is recaptured at up to 25%, and gains may owe capital-gains tax (a 1031 exchange can defer both). Figures are a year-1 estimate at your 24.0% rate — not tax advice; consult a CPA.
Condition & rehab AI · 12 photos
This 7-unit property is in good condition with minimal repairs needed. It offers a good investment opportunity with potential for value-add improvements.
Value-add opportunities
- Both Painting the exterior and interior walls — Fresh paint can enhance the curb appeal and interior aesthetics.
- Both Landscaping improvements — Well-maintained landscaping can improve curb appeal and attract tenants.
- Rental HVAC maintenance — A well-maintained HVAC system can reduce utility costs and improve tenant satisfaction.
- Both Kitchen and bathroom updates — Updating the kitchen and bathrooms can increase the home's value and attract more tenants.
- Both Landlord insurance — Landlord insurance can protect the property and provide peace of mind for the investor.
Renovation cost estimate screening
Value-add ROI direction
- Both Painting the exterior and interior walls — Fresh paint can enhance the curb appeal and interior aesthetics. ↑
- Both Landscaping improvements — Well-maintained landscaping can improve curb appeal and attract tenants. ↑
- Rental HVAC maintenance — A well-maintained HVAC system can reduce utility costs and improve tenant satisfaction. ↑
- Both Kitchen and bathroom updates — Updating the kitchen and bathrooms can increase the home's value and attract more tenants. ↑
- Both Landlord insurance — Landlord insurance can protect the property and provide peace of mind for the investor. ↑
ⓘ Cost ranges are severity-bucket heuristics (US national rule-of-thumb). Get contractor quotes + a written scope before underwriting a rehab budget.
Schools (NCES district)
- District
- Los Angeles Unified
- NCES district ID
- 0622710
- Math proficiency
- 29% ▼ -4.00%
- Reading proficiency
- 54% ▲ 10.00%
- Median HH income
- $50,403
- Composite
- 35.67/100
- National rank
- #4875
- State rank
- #223 of 517 in CA
Livability — Huntington Park
- Score
- 62/100
- State rank
- #491
- US rank
- #16649
Category grades
Schools grade is shown separately in the Schools card above.
Census & demographics
- Census place
- Huntington Park, CA
- County
- Los Angeles County · 9,444,647 people
- City population
- 69,349
- Metro
- Los Angeles-Long Beach-Anaheim, CA
- Population (ZIP)
- 69,349
- Household income
- $64,766
- Rent vs Own
- Severe rent burden
- 3774.0
Population outlook (Los Angeles County) Hauer SSP2
- Today (2025)
- 10,940,515 people
- By 2030
- 11,256,481 · +2.9%
- By 2040
- 11,729,929 · +7.2%
- By 2050
- 11,948,407 · +9.2%
- By 2075
- 11,818,114 · +8.0%
- By 2100
- 10,842,928 · -0.9%
Race, ethnicity, and origin ACS 2023
- Neighborhood character
- Predominantly Hispanic (97%)
- Race & ethnicity
- Hispanic / Latino 97% Two or more races 31% Native American 2% White 1%
- Hispanic origin (detail)
- Mexican 78%
- Foreign-born
- 46% · Canada
- Languages at home
- 11% English-only · Spanish 88%
Political lean MEDSL · Los Angeles
- 2024 margin
- Solid D (+32.9) · D 64.8% · R 31.9% · Other 3.3%
- 2008→2024 swing
- -7.4pp toward R · 2008: 40.4pp · 2024: 32.9pp
- All cycles
- 2024: D+32.9 2020: D+44.2 2016: D+48.0 2012: D+40.0 2008: D+40.4
Not yet ingested
- Civics
- —
Market trends
- HPI YoY
- ▼ -666.90%
- Current HPI
- 432.2813
- Rent YoY
- ▼ -1.44%
- Metro
- Los Angeles-Long Beach-Anaheim, CA
- State GDP YoY
- ▲ 3.21%
- F500 in state
- 116
Industry mix (Fortune 500 HQ in CA)
| Industry | F500 HQs | Revenue |
|---|---|---|
| Technology | 27 | $1,492B |
|
||
| Financial Services | 3 | $174B |
|
||
| Retail | 3 | $44B |
|
||
| Insurance | 3 | $26B |
|
||
| Media / Entertainment | 2 | $115B |
|
||
| Pharmaceuticals / Biotech | 2 | $62B |
|
||
Price history
-19.1% since first listed15 events — show timeline
- 2026-05-07 Price Changed $1,375,000 CRMLS
- 2026-05-01 Listed $1,450,000 CRMLS
- 2026-04-30 Coming Soon $1,450,000 CRMLS
- 2025-06-23 Rental Removed $1,600 CRMLS
- 2025-06-06 Price Changed $1,600 CRMLS
- 2025-05-30 Listing Removed — CRMLS
- 2025-05-22 Listed for Rent $1,700 CRMLS
- 2025-03-09 Price Changed $1,668,000 CRMLS
- 2024-12-22 Price Changed $1,675,000 CRMLS
- 2024-12-21 Price Changed $1,435,000 CRMLS
- 2024-11-16 Price Changed $1,750,000 CRMLS
- 2024-11-12 Listed $1,800,000 CRMLS
- 2023-11-14 Sold (MLS) $1,625,000 CRMLS
- 2023-10-12 Pending — CRMLS
- 2023-09-14 Listed $1,699,000 CRMLS
Cash-flow waterfall
monthlySold comps — $/sqft
last 12 mo · ≤1 miLoading sold comps…